
Abstract
Vaccination efforts for Lyme disease prevention in humans have focused on wildlife reservoirs to target the causative agent, Borrelia burgdorferi, for elimination in vector ticks. Multiple host species are involved in the transmission and maintenance of the bacterium, but not all host species can be vaccinated effectively. To evaluate vaccinating a subset of hosts in the context of host–tick interactions, we constructed and evaluated a dynamic model of B. burgdorferi transmission in mice. Our analyses indicate that on average, a mouse-targeted vaccine is expected to proportionally reduce infection prevalence among ticks by 56%. However, relative to mouse vaccination, human risk of exposure is dominated by the number of tick bites received per person, the proportion of tick blood meals taken from the highly reservoir-competent white-footed mouse relative to other hosts, and the average number of tick bites per mouse. Variation in these factors reduces the predictability of vaccination outcomes. Additionally, contributions of nonmouse hosts to pathogen maintenance preclude elimination of B. burgdorferi through mouse vaccination alone. Our findings indicate that to increase the impact of wildlife vaccination, reducing tick populations by acaricide application, in addition to targeting additional reservoir-competent host species, should be employed.
Introduction
B. burgdorferi is transmitted by the black-legged tick, Ixodes scapularis. In each of three life stages, larva, nymph, and adult, I. scapularis takes a single prolonged blood meal from a different vertebrate host during discrete feeding periods. It is during these feeding periods that B. burgdorferi can be transmitted. Larvae hatch uninfected (Patrican 1997), but those that then feed on infected hosts can acquire and maintain the pathogen through the molt to the nymphal stage. The ticks emerge the following year as infectious nymphs and take another blood meal. Most hosts acquire the pathogen from these nymphal tick bites. Adult-stage ticks play less of a role in pathogen transmission, because they feed predominantly on deer, which do not become infected (Telford et al. 1988, Ullmann et al. 2003). The next generation of larvae then feed on the infected hosts, completing the transmission cycle. Vaccinating hosts can potentially interrupt transmission from one tick generation to the next.
The Lyme disease vaccine developed for humans blocks transmission by eliciting antibodies against the B. burgdorferi ospA protein in vertebrate hosts (Fikrig et al. 1990). During blood meals, B. burgdorferi expresses ospA, which targets the spirochetes for destruction within the feeding tick. Because this mechanism is effective, whether the tick was previously infected or is feeding on an infected host, transmission is prevented both from infected tick to host and from host to feeding ticks (Tsao et al. 2001). Field tests demonstrate that this vaccine is capable of reducing the proportion of infected nymphs when injected into white-footed mice (Peromyscus leucopus), a major reservoir host species in the northeastern United States (Tsao et al. 2004). To target other species that are also competent B. burgdorferi reservoirs but more difficult to capture, such as chipmunks (Mather et al. 1989) and shrews (Telford et al. 1990), the vaccine can be delivered as oral bait (Gomes-Solecki et al. 2006).
Previous modeling work has examined the relationship between B. burgdorferi transmission and host population and community composition (LoGiudice et al. 2003, Ogden et al. 2006) as well as natural host immunity and turnover (Schauber and Ostfeld 2002) and tick population dynamics (Mount et al. 1997a), but host vaccination against B. burgdorferi has not been previously modeled. Given the wide taxonomic and spatial ranges of host species, vaccine coverage of all hosts presents logistical challenges. Understanding the implications of incomplete host coverage is essential to determine efficacy and coverage goals for implementation.
Another factor to be taken into account is that the consistency of vaccination is unknown. The vaccine's effectiveness also depends on host–tick interactions, as a large potential source of variation lies in the number of ticks feeding on vaccinated mice and biting humans in the next life stage. These interactions are driven in part by relative population densities of ticks and hosts (Brunner and Ostfeld 2008), which fluctuate annually, especially given rodent population cycling patterns (for example, Miller and Getz 1977). Such within-population variation in host–tick interactions may be yet another important factor in wildlife vaccination success.
Here, we evaluate the effectiveness of wildlife vaccination in reducing Lyme disease pathogen spillover to humans. We constructed a model to predict the impact of mouse vaccination on B. burgdorferi infection prevalence in ticks, and consequently human risk, in the context of these ecological factors.
Model Description
Our model (Fig. 1) simulates B. burgdorferi transmission in a community of hosts, assuming spatially uniform population densities, habitats, and transmission rates. Hosts are divided into two functional groups: mice, and all other host species that ticks may feed on. Mice are further divided into susceptible (S), infected/infectious (I), and vaccinated (V) individuals. Rates of change among these groups are

Model diagram of Borrelia burgdorferi transmission simulation. White boxes, time-dependent variables; gray boxes, fixed values within simulations. Black arrows, calculations made continuously throughout the simulation; dashed arrows, mice that are only vaccinated at specified times at a fixed level of effectiveness, as described in the text. Quantitative relationships are described in the text.
where all mice are born susceptible (S) (Mather et al. 1991) at a per capita rate b and die at a rate μ (Table 1). These values are parameterized to generate annual population turnover (Whitaker and Hamilton 1998) and a constant population size. Susceptible mice become infected (I) at rate β. All infected mice are infectious to feeding I. scapularis ticks (Donahue et al. 1987) throughout their lifetimes, a characteristic of common strains of B. burgdorferi (Hanincova et al. 2008). Because B. burgdorferi has negligible impact on mouse survival (Hofmeister et al. 1999), there is no additional pathogen-induced mortality. Susceptible and infected mice are vaccinated (V) with the same vaccine effectiveness (Fig. 1, dotted line), the combined product of vaccine efficacy and population coverage.
Transmission to mouse hosts
Susceptible mice become infected at a rate:
where β(t) is the probability of mouse exposure to B. burgdorferi at time t (Ginsberg 1993). P
y is the infection prevalence among nymphal ticks, determined at an earlier simulated time point. Multiplying nymph-to-mouse transmission efficiency, ɛ
tm (Levin and Fish 2000), and nymphal burden, κ(t), gives the effective number of nymph bites per mouse. κ(t) is a seasonally dependent function for the average number of nymphs per mouse:
where N(t) reflects nymphal tick activity relative to the peak (Fig. 2) and κ p converts tick activity to host burdens.
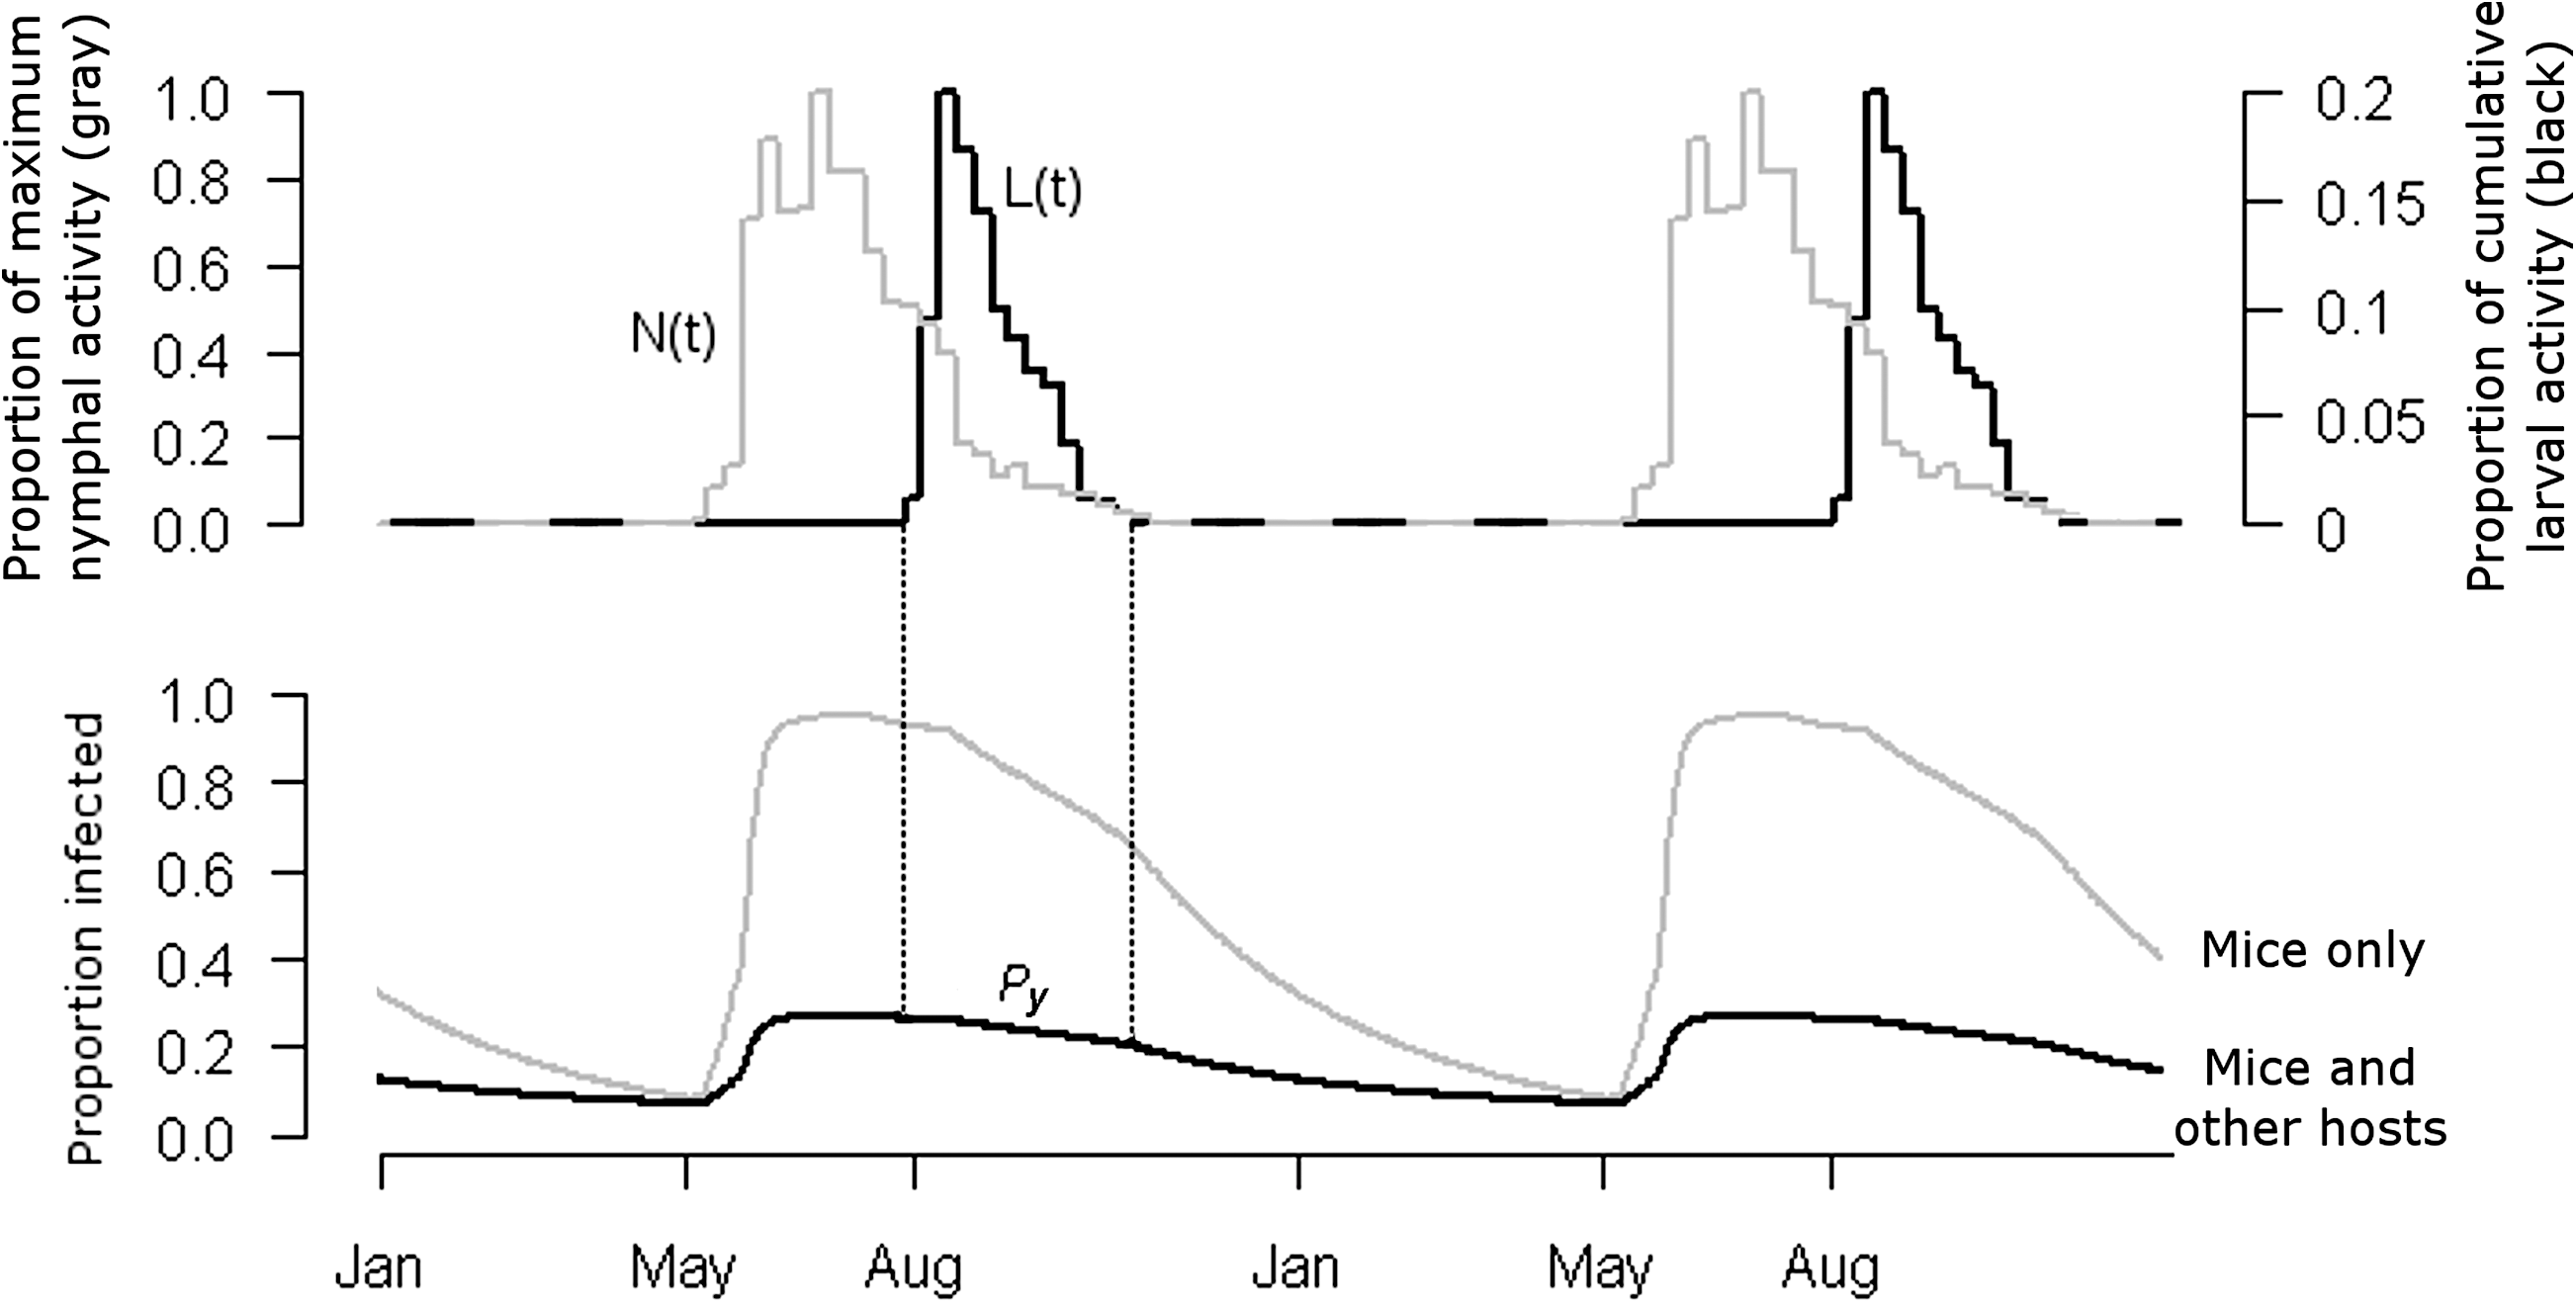
Output for transmission simulation. Tick activity (top) and host infection prevalence (bottom) over 2 years. The infection prevalence among all infected hosts is adjusted for larval tick allocation between mice and other hosts (λ). Nymphal tick activity levels, N(t) (top, gray line), and infection prevalence among the cohort (Py-1) drive mouse infection rates. Larval activity levels, L(t) (black), weigh overall host infection prevalence at each time point, and the sum is P y for the following year.
Nymphal tick activity
N(t) is based on weekly measurements of host-seeking (active) nymphal ticks collected at a single site in Westchester Co., NY, averaged over 3 years (Fish 1993). Each measured number of active nymphs was assigned to all simulated time points within 1 week of that measurement. We normalized activity levels by dividing by the maximum number of nymphs active at any given time point (Fig. 2).
Other hosts
Other hosts for I. scapularis ticks are combined into a single group with fixed average infection prevalence π o and transmission efficiency ɛ ot (Table 1; see Table A1 in Appendix). Although π o is constant, it only contributes to the overall infection prevalence while larval ticks are feeding. Thus, π o reflects infection prevalence among other hosts during this feeding period and is not assumed constant during the rest of the year. The proportion of tick meals taken from mice relative to these hosts is λ.
Determining vector infection prevalence
The overall infection prevalence among fed ticks is based on the ratio of all infected hosts to all hosts. Multiplying by their respective larval tick loads, transmission coefficients, and relative probabilities of tick survival gives the infection prevalence among ticks feeding at time t:
Transmission from infectious mice and other infectious hosts to larval ticks are ɛ
mt and ɛ
ot (see Table A1 in Appendix), respectively. Tick molt survival to the nymphal stage, δ, adjusts for differences attributable to feeding on particular host species (see Table A2 in Appendix). O, the relative number of nonmouse hosts, is calculated based on λ, such that
where M is the sum of all mice, S+I+V.
Larval tick activity
As with the nymphs, field data (Fish 1993) were used to simulate temporal larval activity. The proportional larval activity relative to total activity over the season is L(t) (Fig. 2). These proportions were used to weigh calculated values of P(t) to determine P y, the overall average infection prevalence among larval ticks in a given year. P y was assigned to nymphs emerging and infecting new hosts the following year. A 5-year period was simulated to determine the steady-state value of infection prevalence P y, referred to as P s, the outcome compared among simulations.
Vaccination
We simulated mouse vaccination during the period of larval tick activity. A realistic estimate of vaccine effectiveness is 50%, based on measured seroconversion and capture rates from field data (Tsao et al. 2004). Oral bait-delivered vaccines will likely have higher coverage, as only repeated feedings, and not captures, are required for vaccination. We compared P s values at mouse vaccine effectiveness levels of 50% and 100% to simulate lower-bound realistic and best-case scenarios.
Estimating Exposure Risk
Like other hosts, humans acquire B. burgdorferi from nymphal tick bites more often than from any other tick life stage (Piesman 1989, Falco et al. 1999). The probability (risk) of human exposure to B. burgdorferi is
where h is the number of transmission-effective nymphal tick bites on a human individual (Ginsberg 1993), in which the tick is attached long enough for transmission to occur (>24 h) (des Vignes et al. 2001).
Comparison to Alternative Disease Prevention Methods
We compared mouse vaccination to other methods of human Lyme disease prevention (Hayes et al. 1999). We assumed a probability of exposure of 26% equating to 0.01 Lyme disease cases per 10,000 people per year (Hayes et al. 1999). Based on the model's simulated changes in exposure probability, we calculated the expected number of human cases potentially prevented by mouse vaccination.
Parameter Estimation and Sensitivity Analyses
To determine the influence of each parameter on changes in exposure risk, we conducted one-way sensitivity analyses. P. leucopus mice have been traditionally thought to feed more larval ticks than any other host (Mather et al. 1989), but this value varies locally by tick and host populations (for example, Markowski et al. 1998, Brisson et al. 2008). We set λ, the percentage of all fed ticks that fed upon mice, to 50% as the baseline (Tsao et al. 2004). π o and ɛ ot may also vary by location as a result of host community composition and individual host exposure history. Accordingly, we varied λ, π o, and ɛ ot from 0% to 100% in our sensitivity analyses.
Similarity to Empirical Data
Temporal mouse infection patterns in our model are consistent with reported infection prevalence peaks and timing (Anderson et al. 1987, Hofmeister et al. 1999, Bunikis et al. 2004), despite our assumption of a constant b that simplifies the cyclic nature of the P. leucopus population sizes. Infection prevalence peaks in mice qualitatively match shifts in seasonal nymphal tick activity (Hofmeister et al. 1999).
Results
To determine the baseline infection prevalence in ticks, we simulated transmission without mouse vaccination and found that the average steady-state value of infection prevalence P s is 25%. Implementing mouse vaccination with 50% vaccine effectiveness yielded a final reduced value of P s=11%, a 56% proportional reduction in nymphal infection prevalence. With 100% vaccine effectiveness, P s=7%, the maximum reduction attained. Thus, our model shows that vaccinating B. burgdorferi mouse hosts reduces infection prevalence in ticks.
Our calculations also show that to maintain reduced P s levels, mice must be vaccinated annually to compensate for mortality, even in a closed population. The pathogen is not eliminated as long as other hosts act as a source to feeding ticks. Further, if P. leucopus mice feed proportionally few larval ticks, other hosts by definition feed an increased proportion of larval ticks, and their infection prevalence and infectivity then become increasingly influential. Targeting these other host species for vaccination would decrease their contribution to infecting larval ticks.
Potential variability in the vaccination outcome is considerable, particularly that contributed by tick–host interaction parameters, defined by the average number of nymphs per mouse and proportion of larval tick meals taken from mice. Nymphal ticks feeding on mice drive infection rates, and because only mice are vaccinated against B. burgdorferi, the number of larvae that feed on mice limits overall vaccine impact. Because nymphal and larval tick populations may change between years, we explored vaccination outcomes throughout ranges of these two factors. We assumed 1 to 5 nymphs per mouse during the nymphal activity peak (Goodwin et al. 2001). We let larval ticks feeding on mice relative to other hosts range from 0% to 100%. When incorporating these variation sources, the maximum postvaccination infection prevalence is similar to the prevaccination level (Fig. 3). Therefore, although vaccinating mice is predicted to decrease infection prevalence, the magnitude of the reduction effect varies widely.
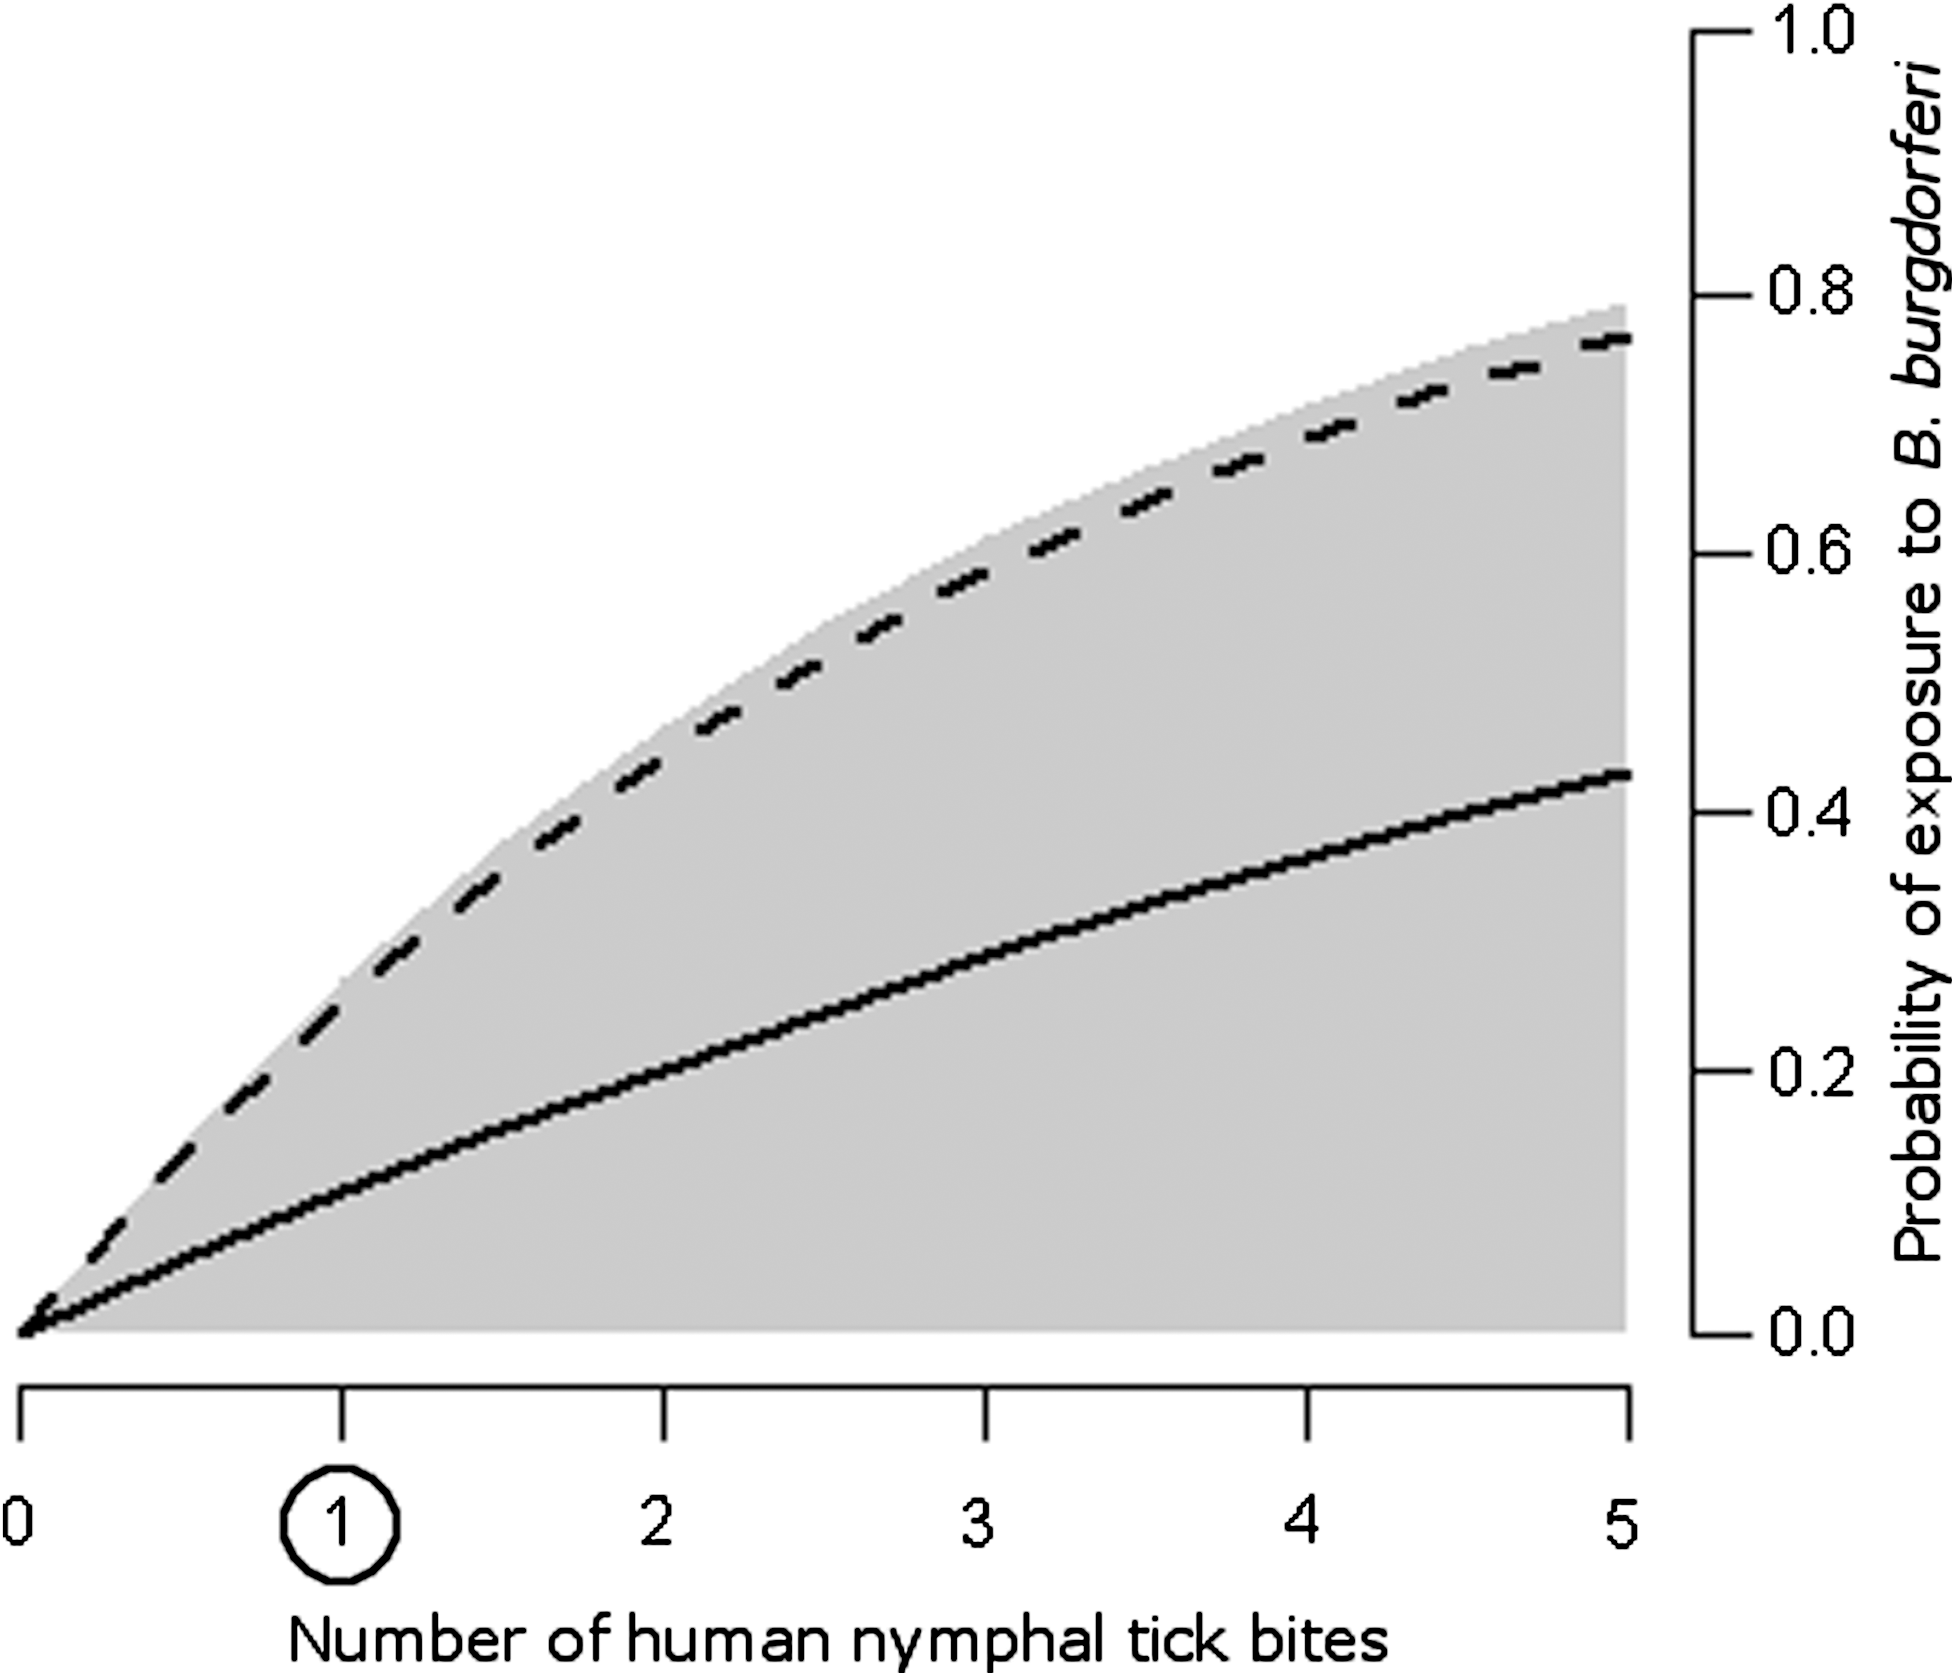
Predicted average probability of human exposure to B. burgdorferi before (dashed line) and after (solid line) treating mice at 50% vaccine effectiveness, as a function of nymphal tick bites on humans. Variation in the proportion of larval ticks feeding on the vaccine target (0–1) and numbers of nymphal tick bites on mice (0–5) results in a wide range of probabilities (gray shading). One nymphal tick bite on humans is slightly above average for endemic areas (circled).
Further, changes in infection prevalence may not equate to the same changes in human exposure risk. There may be regional, temporal, and individual differences in probabilities of tick contact with, and bites on, humans. In certain regions, the number of human tick bites may range from less than one to five (Ginsberg 1993). We assume one bite on average, but with five human tick bites, mouse vaccination reduces exposure from 0.76 to 0.44 (Fig. 3). Compared with the baseline exposure reduction from 0.25 to 0.11, we see that even constant infection prevalence can yield highly variable risk, especially given heterogeneous individual exposure due to occupational or recreational activities. The number of tick bites on humans is the most influential of the tested parameters determining exposure risk (Fig. 4).
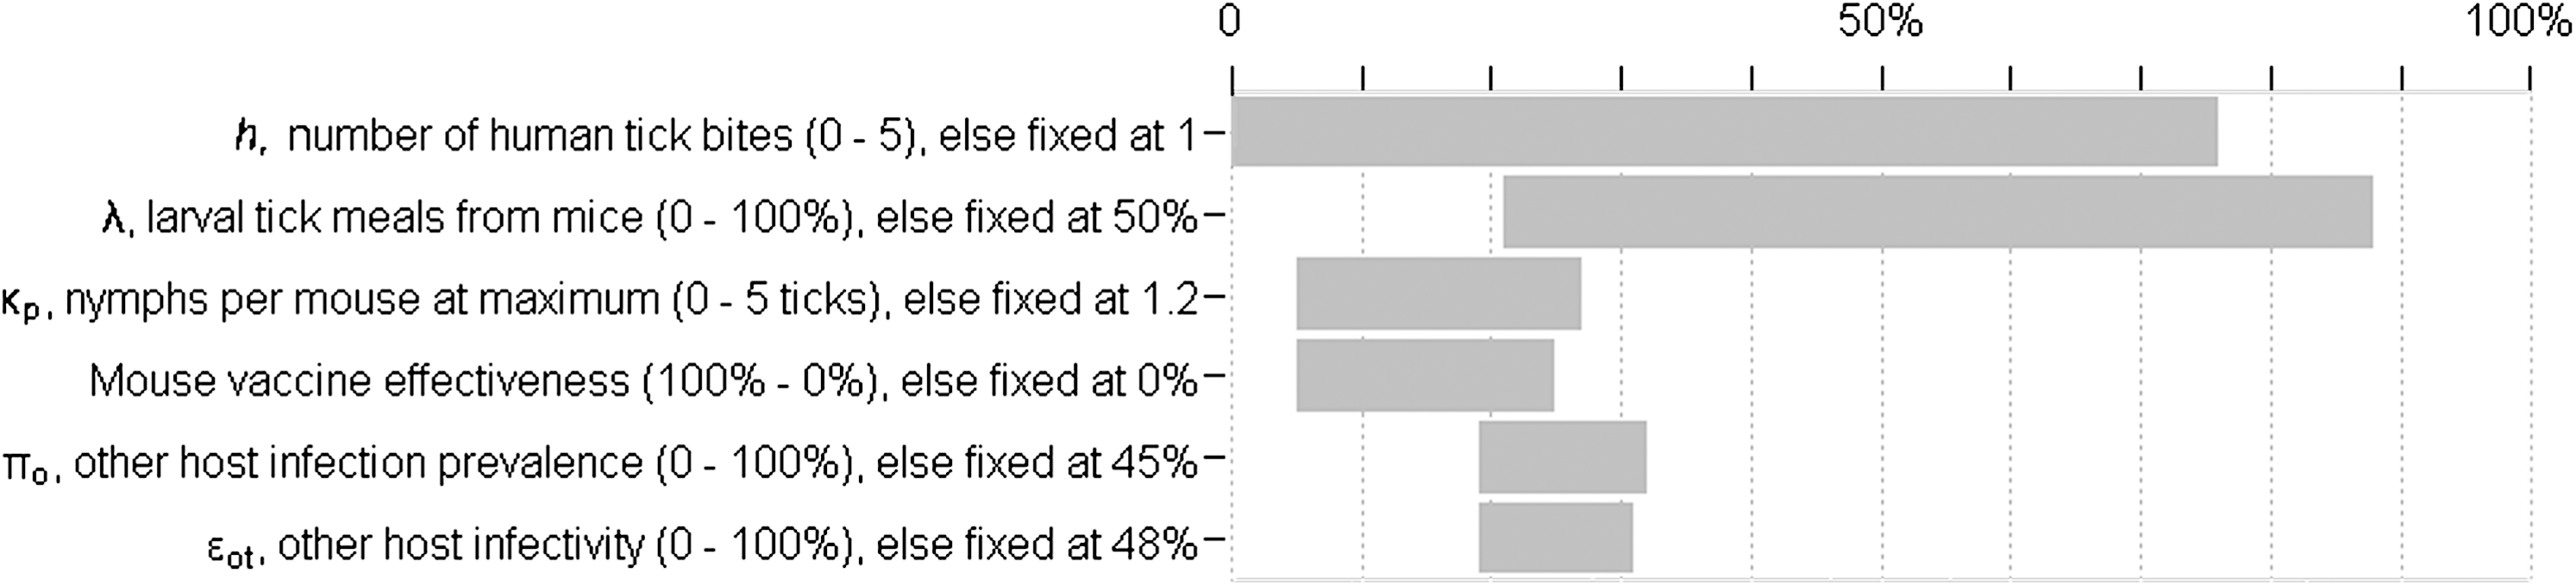
Ranges of probability of exposure resulting from independent variation of selected parameters. Parameters with the widest ranges (top) have the strongest influence on exposure risk. The most influential parameters are numbers of human tick bites from nymphs, percentage of larvae feeding on mice, and the average number of nymphs per mouse at the nymphal activity peak.
The average expected reduction of infection prevalence from 25% to 11% would equate to 96 to 42 cases per year, or 54 cases prevented per 10,000 people. Over a 4-year time period, as previously evaluated (Hayes et al. 1999), this compares favorably to methods such as application of acaricide to mice, deer removal, and personal protective measures such as use of tick repellent (Hayes et al. 1999). With an estimated 216 cases prevented per 10,000 people, mouse vaccination ranks second among the most effective intervention options, behind acaricide applied to deer (272 prevented cases), and ahead of acaricide applied to habitat (156 cases prevented) and the unavailable human Lyme disease vaccine (148 cases prevented).
Discussion
Our model demonstrates that mouse vaccination can reduce human exposure risk to B. burgdorferi, but the vaccine is more effective when human tick bites are frequent, mice receive numerous bites from nymphal ticks, and mice consistently feed a high proportion of larval ticks. Because of natural spatial and temporal variation in these factors, actual vaccination results can vary considerably.
Indeed, such variability in vaccination outcomes was observed in a field trial of the vaccine, with vaccine-attributed differences in infection prevalence ranging from +1% to −13% among sites, from initial infection prevalence values of 22% to 50% (Tsao et al. 2004). Although mouse vaccination appears to be comparable to other Lyme disease prevention approaches, the wide range of outcomes suggests mouse vaccination is quite sensitive to the inherent variability in tick and host populations. A more rigorous evaluation of the effects of tick–host interactions on other intervention approaches is necessary before these interventions and their variability can be compared appropriately in terms of costs and benefits.
Uncertainty in the effectiveness of intervention methods may be reduced if the factors driving variation can be controlled or measured. These factors are in part related to tick population densities. Thus, reducing the total number of nymphal ticks could reduce nymph bites on both humans and mice. Indeed, intervention methods with comparable risk reduction to wildlife vaccination are based on reducing tick populations, such as acaricide application in tick habitat and on deer hosts (Hayes et al. 1999). Other models agree that sustained tick population reduction will effectively decrease exposure risk to B. burgdorferi (Mount et al. 1997b).
Similar to combination drug therapy, a combination of intervention methods would result in the most effective approach in the prevention of Lyme disease. Simultaneously reducing tick populations and vaccinating wildlife should be more beneficial than using either approach alone. Reducing human tick bites provides the additional benefit of lowering human exposure to other I. scapularis-borne pathogens not considered in this model, such as Babesia microti and Anaplasma phagocytophilum. To set informed goals for tick reduction, threshold tick population levels for pathogen control should be defined; such thresholds have been suggested via modeling for B. burgdorferi (Mount et al. 1997a).
Another important factor, the relative distribution of tick blood meals among all host species, is challenging to estimate and control, particularly given spatial and temporal variation in host and tick populations. Progress in this field, such as developing methods to identify host blood meal sources of fed ticks (Humair et al. 2007), will inform us which hosts are involved in maintaining B. burgdorferi transmission and to what degree. Presumably, allocation of tick blood meals varies by host composition and population densities (Markowski et al. 1998, Tsao et al. 2004), but this relationship could be verified empirically by tick blood meal sources and host population density estimates. Such calculations would indicate whether host-targeted vaccination is appropriate or efficient at feasible scales.
Further logistical challenges exist in implementing a wildlife vaccine. Certain vaccination levels must be maintained among hosts, evidenced by the need to vaccinate mice annually in this model, driven by population turnover; this model structure could be used to determine the minimum percentage of vaccinated hosts required to achieve a targeted reduction in infection prevalence among nymphal ticks. Additionally, individual and temporal heterogeneity in immune responses will result in variable vaccine effectiveness. Further, vaccinated individuals may disperse, and susceptible or infected individuals may migrate into a treated area, further reducing the relative number of vaccinated individuals.
A potential benefit to targeting other species is that some are longer-lived; squirrels, for example, can live up to 6 or more years (Whitaker and Hamilton 1998), potentially requiring less frequent vaccination among these hosts. However, given the taxonomic breadth of reservoir hosts with varying immune responses, and their often large home ranges, attaining necessary levels of vaccine efficacy and coverage among all infectious hosts may be difficult. Vaccine delivery to these hosts is another issue. Insectivorous hosts such as shrews may prove difficult to vaccinate, but seed-eaters such as chipmunks could be targeted via grain-based baits. Vaccine delivery to, and effectiveness in, nonmouse host species should be further investigated and developed as an additional protective measure, as vaccinating mice alone is unlikely to eliminate the pathogen.
We have shown that reducing wildlife reservoir host competence via vaccination can reduce human risk of Lyme disease. These findings compare favorably with most other available intervention methods. However, mouse-targeted vaccination will not eliminate the pathogen as long as other hosts are reservoirs for the pathogen. The actual degree of reduction strongly depends on factors such as human tick bites, tick feeding allocation among hosts, and tick burdens on hosts. To maximize efforts for Lyme disease prevention, wildlife host vaccination could be used in conjunction with other tick population reduction measures.
Footnotes
Acknowledgments
Jan Medlock and Eunha Shim provided valuable input in model design and execution. The article was improved by comments from two anonymous reviewers. Funding was provided by the Division of Epidemiology of Microbial Diseases at the Yale School of Public Health, the Garfield Weston Foundation, and a National Science Foundation Doctoral Dissertation Improvement Grant to K. Tsao.
Disclosure Statement
All authors declare no conflict of interest.
Appendices
| Taxon | Density-based weights a,b | Proportion molt success c | Weighted molt success c |
|---|---|---|---|
| Chipmunk (Tamias striatus) | 0.21515 | 0.412 | 0.088640152 |
| Deer (Odocoileus virginianus) | 0.00215 | 0.563 | 0.001211013 |
| Raccoon (Procyon lotor) | 0.00172 | 0.365 | 0.000628165 |
| Opossum (Didelphis virginianus) | 0.00861 | 0.04 d | 0.00034424 |
| Skunk (Mephitis mephitis) | 0.00043 | 0.639 | 0.00027477 |
| Shrew (Blarina brevicauda) | 0.21515 | 0.468 | 0.100688328 |
| Birds, grouped | 0.27195 | 0.339 | 0.092189355 |
| Shrew (Sorex sp.) | 0.21515 | 0.496 | 0.106712416 |
| Squirrels, grouped | 0.06971 | 0.593 | 0.041336251 |
| Sum | 0.435475696 | ||
| White-footed mouse (Peromyscus leucopus) | 0.415 | ||
| δ e : 1.041 |
See Table A1 in Appendix for calculations.
LoGiudice et al. 2003.
Obtained by multiplying molt value for taxon by density-based weights.
Fish and Daniels 1990; using the estimate of 0.441 from LoGiudice et al. 2003 yields a similar δ of 1.049.
δ calculated by dividing survival after feeding on other hosts by survival after feeding on mice.