
Abstract
Rabies remains an important public health concern in the United States, with most human cases associated with bat rabies virus variants. Cases of rabies virus (RV) infection in bats are widely distributed across the continental United States and elsewhere in the Americas. In this retrospective study, data on bats submitted to state laboratories for RV diagnosis between 2001 and 2009 were analyzed to investigate epidemiological trends in the United States. Season, region, and roosting habits were the primary risk factors of interest. During the study interval, more than 205,439 bats were submitted for RV diagnosis, and 6.7% of these bats were rabid. Increased odds of a submitted bat being rabid were associated with species that exhibit inconspicuous roosting habits, bats originating in the Southwest, and bats submitted for diagnosis during the fall. Periodic analysis of zoonotic disease surveillance is recommended to detect changes in trends regarding geographic distribution, seasonal fluctuations, and host associations; this is particularly necessary, as existing trends may be influenced by climate change or other emerging factors.
Introduction
Multiple bat species play a role in the epizootiology of rabies in North America. Transmission occurs predominantly between conspecifics, although cross-species transmission has been documented (Velasco-Villa et al. 2006; Streicker et al. 2010). Rabies has been identified in the majority of the 46 species of bats that occur in the U.S. (Constantine 2009). The broad host range of bat rabies results in a wide geographic distribution of RV, as documented since the 1960s (Constantine 1967). The prevalence of rabies in bats submitted for rabies diagnosis shows strong seasonality, with bimodal peaks in the spring and fall (Constantine 1967; Mondul et al. 2003; Blanton et al. 2006). These peaks in rabies have been linked to the life-history patterns of bats in the U.S. Many species undergo short- and long-distance migrations in the spring and fall, moving between summer maternity colonies, summer-fall swarming sites, and winter hibernacula. A previous study suggested that the rabies burden was highest in the Southwest compared to other parts of the U.S., and was associated with a high number of Brazilian free-tailed bats (Tadarida brasiliensis) reported in this region (Mondul et al. 2003). Approximately 6% of bats submitted through passive surveillance are diagnosed rabid, but this percentage varies dramatically across taxa, and appears to be sensitive to the roosting ecology of different species (Mondul et al. 2003; Klug et al. 2011).
Following canine rabies control in the U.S. during the last century, the occurrence of rabies in humans declined considerably, to an average of two to four cases reported annually. However, since the 1980s, bat RV variants have been implicated in over 90% of indigenously-acquired human rabies cases in the U.S. (Messenger et al. 2002; Blanton et al. 2010). Three RV variants account for over 90% of bat-associated human infections: the tricolored bat (Perimyotis subflavus), silver-haired bat (Lasionycteris noctivagans), and Brazilian free-tailed bat (Tadarida brasiliensis) RV variants. Among the hosts of these three RV variants, only Brazilian free-tailed bats are known to be both highly gregarious and synanthropic across their geographic range in the U.S., suggesting a strong potential for contact with humans. In contrast, big brown bats (Eptesicus fuscus) are also known to be both gregarious and synanthropic, but have only been implicated in a single human rabies case (Messenger et al. 2002; Blanton et al. 2010).
Reports of bat-associated human rabies cases increased during the 1990s compared to previous decades. This increase, combined with the frequent cryptic nature of exposures to rabid bats, culminated in new criteria to define human exposure to bats in the 1999 Advisory Committee on Immunization Practices (ACIP) human rabies prevention recommendations. These new ACIP recommendations expanded the exposure scenarios for considering post-exposure prophylaxis (PEP) beyond historical recommendations of a known bite or contamination of mucous membranes with saliva, to include: persons who were in the same room as a bat and who might be unaware that a bite or direct contact had occurred (e.g., a sleeping person awakens to find a bat in the room, or an adult witnesses a bat in a room with a previously unattended child, mentally disabled person, or intoxicated person), and in which rabies cannot be ruled out by diagnostic testing of the bat (e.g., the animal was unavailable or the tissue was unsuitable). Though retained in the 2008 ACIP rabies recommendations, these criteria remain somewhat controversial and inconsistently applied in practice. In part due to these ACIP recommendations, increased public education and disease awareness have contributed to a substantial increase in the number of bats submitted for rabies diagnosis.
The objectives of this retrospective study were to describe surveillance trends for bat rabies in the U.S. between 2001 and 2009 using U.S. diagnostic laboratory submission data, and to determine the epidemiologic patterns of bat rabies during that time period. Data were analyzed to evaluate several factors, including the season and region of the country in which bats were tested, and the roosting habits specific to certain bat species, to consider the potential effects of these variables on the numbers of bats submitted for diagnosis and on the proportion of rabid bats among those submitted for testing.
Materials and Methods
The data used in this study included bat rabies surveillance data collected from 2001 to 2009 by state diagnostic laboratories and reported to the Centers for Disease Control and Prevention (CDC). States reported RV diagnostic results for submitted animals based on direct fluorescent antibody testing of brain tissue. In addition to diagnostic results, information on the county and month of submission, and identification of the bat to the level of genus and/or species, where possible, was provided for the specimens.
Puerto Rico and Hawaii were excluded from analysis due to an absence of reported rabid bats in either location. The states of Alabama (1 year), California (4 years), Connecticut (1 year), Florida (2 years), Georgia (5 years), Indiana (1 year), Iowa (3 years), Maryland (1 year), New Mexico (1 year), Oklahoma (5 years), and South Carolina (3 years), and the District of Columbia (1 year) did not report denominator data (the total number of bats tested) for some of the years between 2001 and 2005, and data from those corresponding years were excluded, where denominator data were required for the analysis. All states reported denominator data from 2006–2009. Bats which were identified as a species not indigenous to the U.S. were considered exotic and were also excluded from the analysis. In all cases, exotic bats were submissions from zoo colonies in the U.S.
Several categorical variables were established for analysis, including (1) the season in which the bat was submitted for rabies diagnosis: winter (December–February), spring (March–May), summer (June–August), and fall (September–November); (2) the region of the U.S. where the bat was submitted (corresponding to regions designated by Mondul et al. 2003 for purposes of comparison over time): Northwest (Alaska, Idaho, Iowa, Kansas, Minnesota, Missouri, Montana, Nebraska, North Dakota, Oregon, South Dakota, Washington, and Wyoming), Southwest (Arizona, Arkansas, California, Colorado, Louisiana, Nevada, New Mexico, Oklahoma, Texas, and Utah), Northeast (Connecticut, Illinois, Indiana, Maine, Massachusetts, Michigan, New Hampshire, New Jersey, New York, Ohio, Pennsylvania, Rhode Island, Vermont, and Wisconsin), and Southeast (Alabama, Delaware, District of Columbia, Florida, Georgia, Kentucky, Maryland, Mississippi, North Carolina, South Carolina, Tennessee, Virginia, and West Virginia); and (3) the roosting habits of the bat species: conspicuous species, defined as those that tend to roost or hibernate in places where they are visible to humans and that sometimes tend to form large groups (Choeronycteris mexicana, Corynorhinus rafinesquii, Corynorhinus townsendii, Eptesicus fuscus, Leptonycteris yerbabuenae, Macrotus californicus, Mormoops megalophylla, Myotis austroriparius, Myotis grisescens, Myotis lucifugus, Myotis occultus, Myotis sodalis, Myotis velifer, and Tadarida brasiliensis), and inconspicuous species, defined as those that tend to roost in small groups in locations where they are not often seen by humans (Antrozous pallidus, Artibeus jamaicensis, Eumops glaucinus, Euderma maculatum, Eumops perotis, Eumops underwoodi, Lasiurus blossevillii, Lasiurus borealis, Lasiurus cinereus, Lasiurus ega, Lasiurus intermedius, Lasiurus seminolus, Lasiurus xanthinus, Lasionycteris noctivagans, Myotis auriculus, Myotis californicus, Myotis ciliolabrum, Myotis evotis, Myotis keenii, Myotis leibii, Myotis septentrionalis, Myotis thysanodes, Myotis volans, Myotis yumanensis, Nycticeius humeralis, Nyctinomops femorosaccus, Nyctinomops macrotis, Parastrellus hesperus, and Perimyotis subflavus), as described by Weller and colleagues (2009).
Statistical analysis
Statistical analyses were performed using SAS version 9.2 (SAS Institute Inc., Cary, NC). Univariate analysis of risk factors for diagnosis of rabies in a bat was performed using Mantel-Haenszel chi-square test statistics. Odds ratios (OR) with 95% confidence intervals (CI) and associated p values were also calculated. A p value of less than 0.05 was considered statistically significant. The year 2000 decennial census figures by county were obtained from the United States Census Bureau.
Results
Between 2001 and 2009, bats accounted for 21.6% of the 63,356 reported rabid animals in the U.S. Over that period more than 205,439 bats were submitted to laboratories for rabies diagnosis, of which 13,693 were rabid. Excluding data from state-years where total submission data were not provided, 12,525 rabid bats were reported, accounting for 6.1% of bats submitted for diagnosis. Those bats that were diagnosed as rabid ranged from 5.8% (1114 bats) in 2005 to 6.5% (1935 bats) in 2007. During the study interval, laboratories identified 48 species of bats, 43 representing native bat species. Fourteen exotic bats (5 species), originating from zoological parks, were submitted for diagnosis and were not rabid (data not shown).
Of bats received by health departments from 2001 to 2009, 42.6% (87,508/205,439) were identified to the level of genus or species. The proportion of submitted bats that were identified ranged from 53.4% in 2001 to 31.6% in 2008. Among identified bats, 5.8% (5053 bats) were rabid, compared to 6.3% (7472) of non-identified bats.
Big brown bats (E. fuscus) and little brown bats (M. lucifugus) were the most frequently identified bats, comprising 74.5% (65,167) and 12.4% (10,877), respectively, of submitted and identified bats (Table 1). Unidentified Myotis bats (2.5%), Brazilian free-tailed bats (T. brasiliensis, 2.0%), and red bats (L. borealis, 1.7%) were the next most frequently submitted and identified.
Data excluded for state-years not reporting all bats submitted for rabies diagnosis.
Among species with ≥100 individual bats tested.
Among bat species with ≥100 submissions, Brazilian free-tailed bats (T. brasiliensis) had the highest percentage reported rabid (41.5%), followed by hoary bats (L. cinereus, 35.3%), canyon bats (P. hesperus, 21.7%), and seminole bats (L. seminolus, 19.2%; Table 1). Although big brown bats (E. fuscus) and little brown bats (M. lucifugus) were the most frequently submitted for diagnosis, these species ranked 12th (4.7%) and 17th (2.2%), respectively, based on the proportion of rabid bats.
The proportion of rabid bats of those submitted for diagnosis between 2001 and 2009 was lowest in the winter months (2.46%), with peaks in the spring (6.6%) and fall (12.2%; Fig. 1). The highest proportion of rabid bats (15.6% for all bats, 18.7% for identified bats) was in October. Most bats (58.7%) were submitted for rabies diagnosis during the summer, followed by 16.1% in the fall, 15.6% in the spring, and 9.7% in the winter (Fig. 1). The probability of a submitted bat being rabid increased in all seasons compared to winter, with highest risk associated with bats submitted in the fall (OR=5.5, 95% CI=4.98,6.05; Table 2).
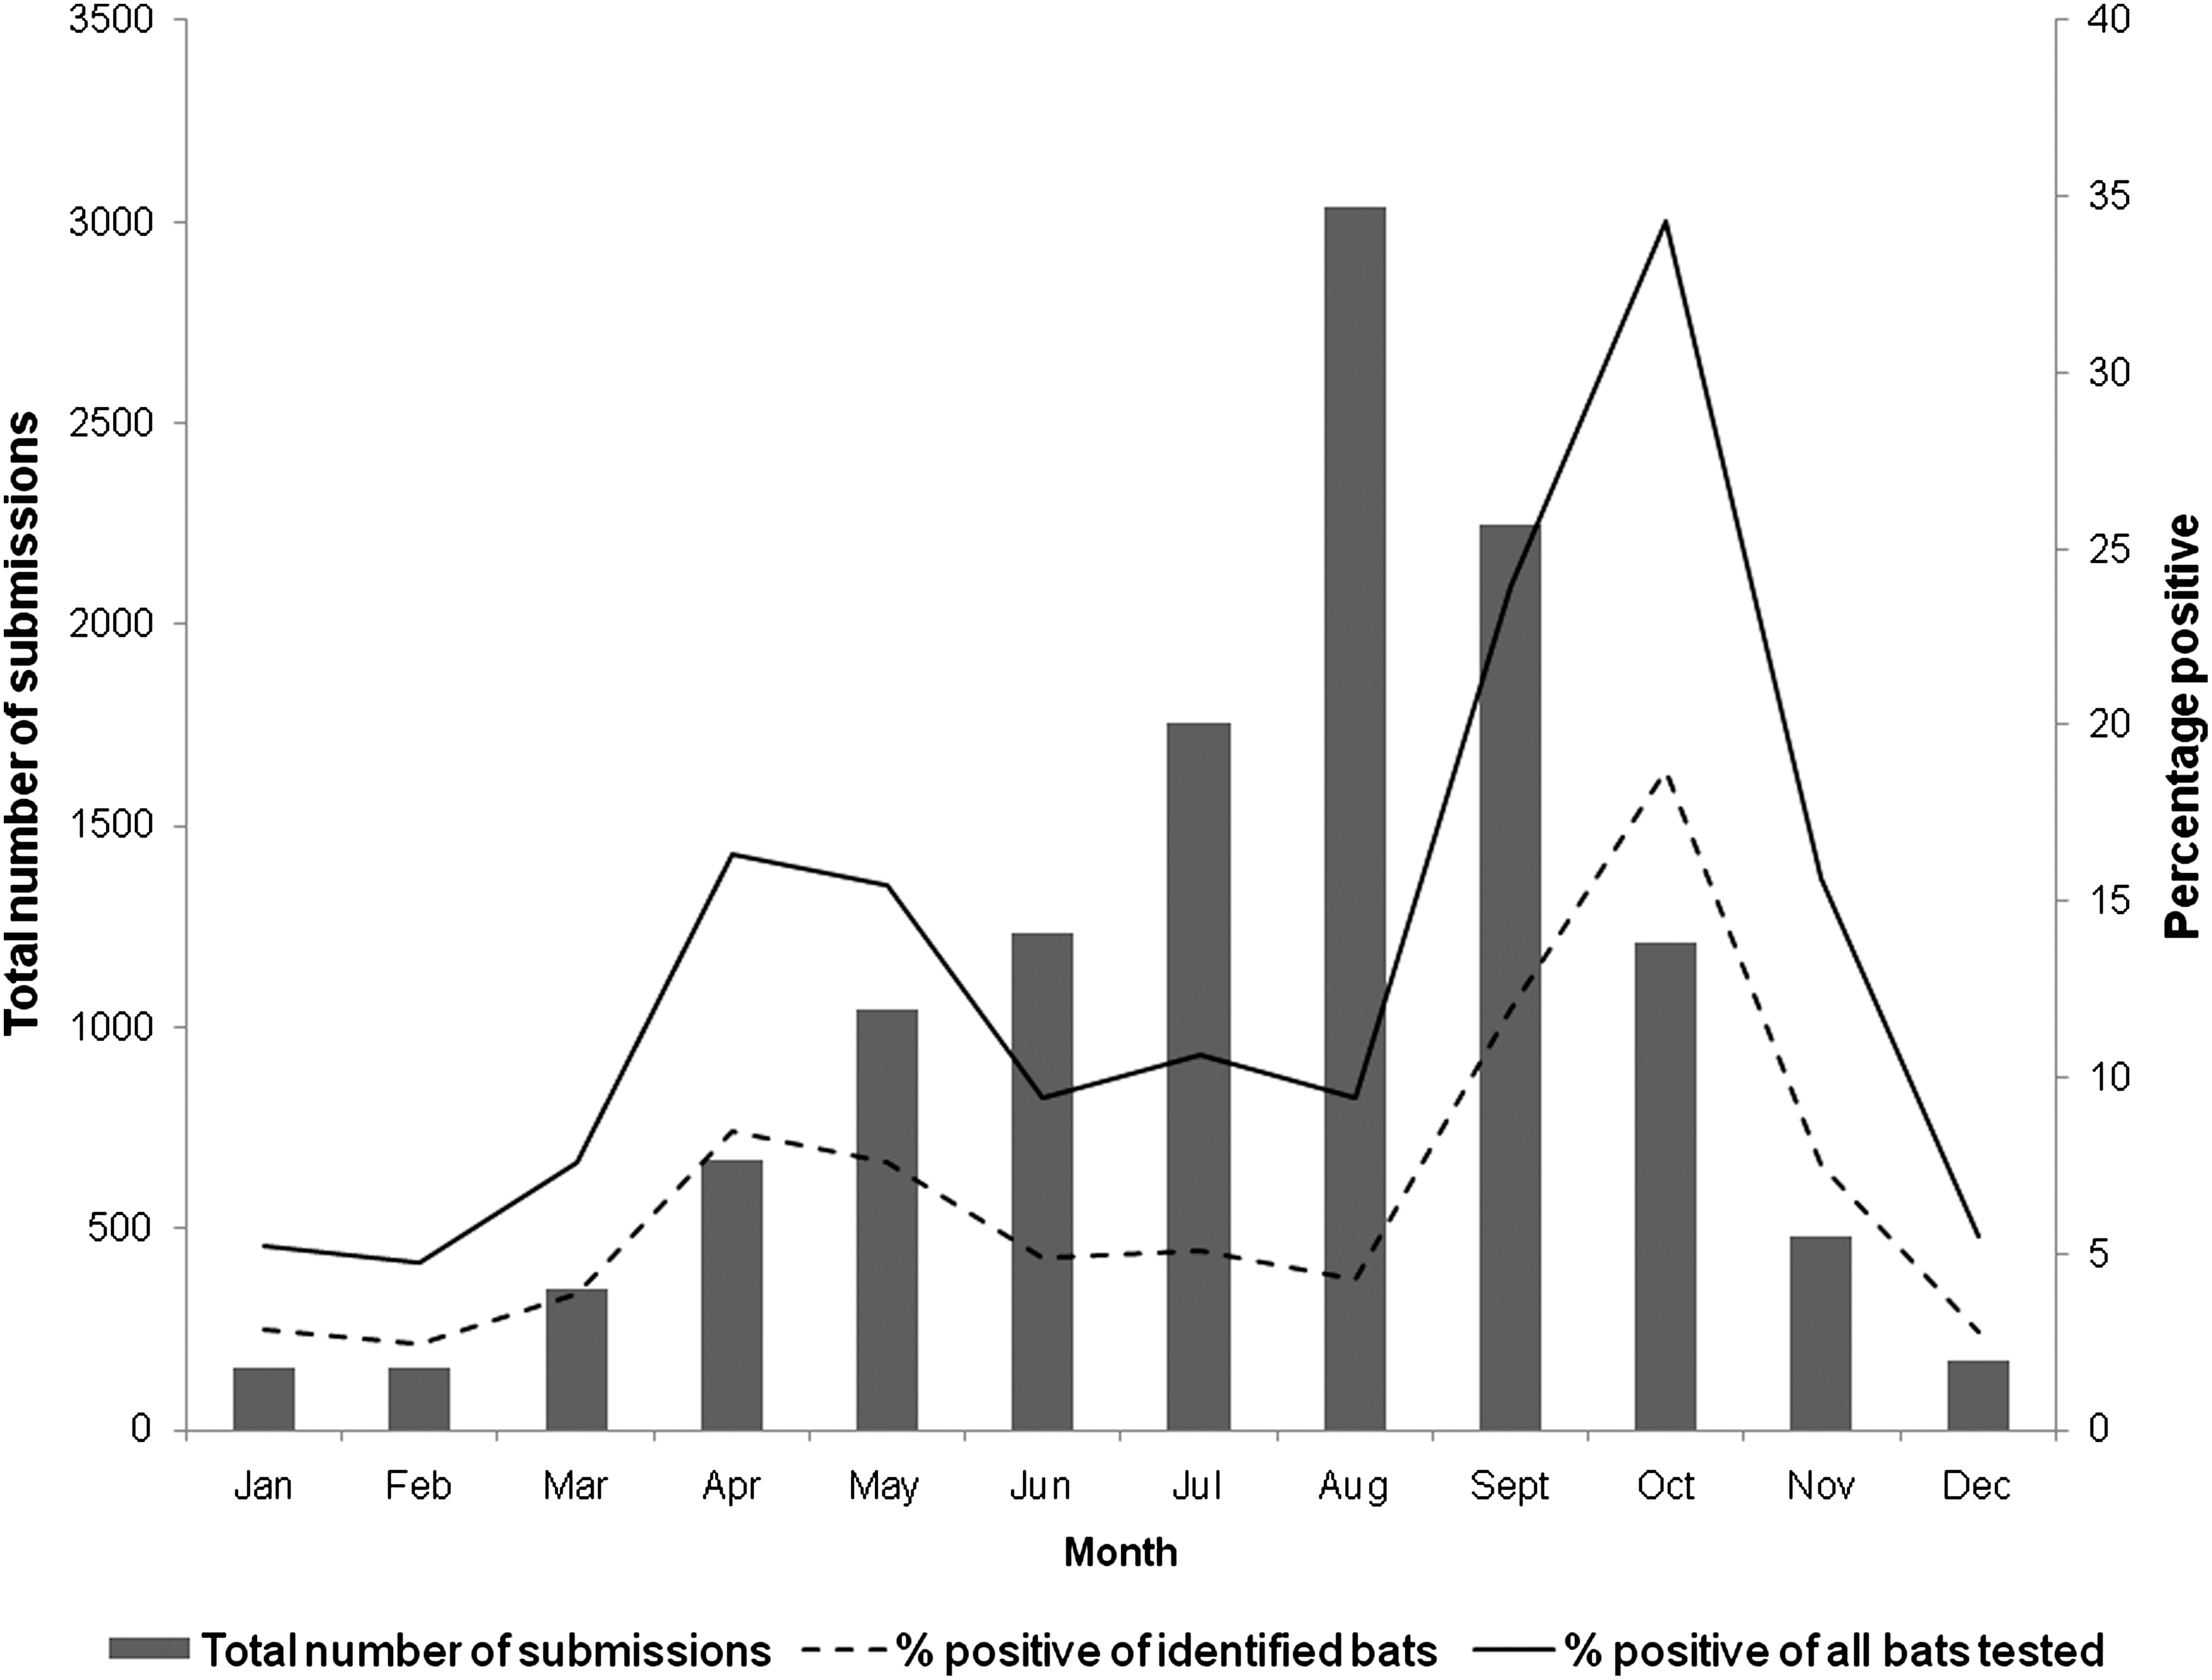
Seasonal trends in the total number of submissions of bats, the percentages of rabid bats among all bats tested, and the percentages of rabid bats among those identified to the level of genus or species, by month among bats submitted to diagnostic laboratories in the United States from 2001–2009. Data excluded for state-years not reporting all bats submitted for rabies diagnosis.
Data excluded for state-years not reporting all bats submitted for rabies diagnosis.
All ORs were statistically significant with a chi-square p<0.05.
OR, odds ratio; CI, confidence interval; ref, reference value.
The number of bats submitted for rabies diagnosis varied by region. Nearly half (49.9%) of the submitted bats were from states in the Northeast, followed by the Southwest (20.6%), Southeast (14.9%), and the Northwest (14.6%). To control for potential regional bias from excluding some state-years for which denominator data were unavailable, we calculated the average number of bats by state-year for each region. No difference was observed in the regional trend (Northeast: 826.8 bats/state-year; Southwest: 530.3 bats/state-year; Southeast: 293.9 bats/state-year; and Northwest: 262.5 bats/state-year). Bat submission rates also varied based on the human population, from 0.02 to greater than 69.68/100,000 population (Fig. 2). Compared to the Northeast, all other regions were associated with an increased probability of a submitted bat being rabid (Table 2). To further examine an association in the Southwest, Brazilian free-tailed bats (T. brasiliensis) were excluded due to the potential that this species was driving the trend (Mondul et al. 2003). However, no effect of this species was noted on the association.

Annual incidence of bat submission for rabies diagnosis by county, 2001–2009. Data excluded for state-years not reporting all bats submitted for rabies diagnosis; submission data by county unavailable for Oklahoma.
The majority of submitted bats identified to species level were categorized as having conspicuous roosting habits (91.7%) versus inconspicuous roosting habits (8.3%). Using conspicuous roosting habits as the reference group, bats with inconspicuous roosting habits were more likely to be rabid (OR=2.81, 95% CI=2.61,3.04).
In the multivariate analysis, year, season, region, roosting habits, and human population were associated with a greater likelihood of a bat being diagnosed with rabies. Fall submissions were most strongly associated with a positive RV diagnostic result, followed by bats originating from the Southwest.
Discussion
The elimination of dog-to-dog rabies transmission in the U.S. led to a significant decline in the incidence of rabies in humans (Smith 1996). An average of two to four human rabies cases have been reported each year in the U.S. since 1960 (Rupprecht et al. 2009). Over 90% of indigenously-acquired cases are associated with bat RV variants (Messenger et al. 2002; Blanton et al. 2010). Most human rabies deaths in the U.S. are attributed to individuals being unaware of RV exposure and therefore not obtaining PEP (Messenger et al. 2002). Of the 28 cases in patients with no known bite history seen between 1958 and 2000, 26 cases were associated with bat RV variants (Messenger et al. 2002). Cryptic rabies cases pose challenges to public health and medical personnel in diagnosis, identification of the offending host, and in assessing potential exposure to others (Messenger et al. 2002).
Bats are natural reservoirs for RV (Rupprecht et al. 2002). Cases of rabid bats were distributed throughout the continental U.S. between 2001 and 2009. The numbers of bats submitted to laboratories for rabies diagnosis varied by region during this period (Fig. 2). Although the largest number of submissions originated in the Northeast (102,523 bats), this region had the lowest percentage of rabid bats. The greatest risk of a submitted bat being rabid was in the Southwest. These results correspond in general with similar bat surveillance data reported from 1993 to 2000 (Mondul et al. 2003). Regional differences in the number of bats submitted could be related to the level of public awareness of rabies in specific regions (e.g., bat rabies education in New York State), as well as the density of the human population, and opportunities for interactions between humans and bats in shared environments. One additional explanation for regional differences in submission rates is the variation between states, and even counties within a state, regarding the public health guidelines for submitting bats for rabies diagnosis. Some regional differences may also be attributable to regional abundance or ecology of bat populations. However, the observable shifts in submission rates across geo-political borders (Fig. 2) suggest that local and state submission policies, as well as public awareness, may play a significant role in driving submission rates of bats for rabies diagnosis.
The overall number of submissions of bats to diagnostic laboratories in the U.S. has increased since 1994 when the last review of bat surveillance was published (Fig. 3). Submissions of bats for rabies diagnosis have increased from fewer than 10,000 per year in 1996, as the exposure criteria for the 1999 ACIP recommendations for human PEP were materializing, to almost 30,000 annual submissions recently (Blanton et al. 2010). Although human exposures to animals and administration of PEP are not notifiable in the U.S., the number of PEP courses administered per year appears to have remained relatively steady, despite changes in recommendations and increases in bat submissions (Christian et al. 2009).

Annual trends among bats submitted for rabies diagnosis and proportion rabid among 34 jurisdictions providing laboratory submission data, 1994–2009. Data excluded for state-years not reporting all bats submitted for rabies diagnosis. Data from 1994–1999 obtained from National Rabies Surveillance System, Centers for Disease Control and Prevention.
Between 2001 and 2009, the proportion of rabid bats was highest in the fall (15.6%). The apparent seasonality of bat rabies during the study interval is consistent with other reports (Constantine 1967; Pybus 1986; Burnett 1989; Mondul et al. 2003; Blanton et al. 2007; Balsamo et al. 2009). Such studies demonstrate an overall increasing trend in the proportion of rabid bats from the lowest values in winter months to a peak in the late summer or fall. Human contacts with bats primarily occur in late summer and early fall, and the onset of human rabies cases associated with bat RV variants in the U.S. between 1960 and 2000 most commonly occurred in September and October (Messenger et al. 2002). Maximum bat activity in the U.S. among both resident and migrant bats occurs in the summer and early fall, at the time when bats are preparing for hibernation, swarming, or migration, and when young bats are weaning and beginning to fly (Constantine 1967). Increased bat activity in addition to increased human activity outdoors during these months likely contributes to increased human encounters with bats. Our results show an increase in the proportion of rabid bats in the spring as compared to winter and summer. The increased odds of detecting a rabid bat in the spring could in part be a consequence of arousal from hibernation for some species, coupled with seasonal migration from winter hibernacula to summer maternity colonies (George et al. 2011).
Bats included in this study were only those submitted to laboratories due to suspicion of rabies or potential exposure to humans or animals. This use of passive surveillance to determine the occurrence of rabies among bats relies on direct human encounters, or observations of bats, which is an inherent limitation. Among identified species of bats submitted during the study interval, a greater number of conspicuous bat species were submitted for rabies diagnosis than inconspicuous bat species. Conspicuous species tend to roost in areas visible to humans and are more likely to be encountered and submitted for testing (Pool and Hacker 1982). However, bats with inconspicuous roosting habits were more likely to be rabid than those with conspicuous roosting habits. This observation of a greater proportion of rabid bats among nonsynanthropic bats, as compared to synanthropic bats tested as part of a passive surveillance program, is consistent with previous reports (Klug et al. 2011). Inconspicuous species tend to roost in locations such that they infrequently interact with humans (Weller et al. 2009). Inconspicuous bats are more likely to interact with humans and be noticed if they are showing abnormal signs and behaviors, or are suspected of being diseased or injured (Constantine 1967; Schowalter 1980). This tendency provides a source of bias in the reports of rabies in inconspicuous species, as estimated by passive surveillance. Rabies among synanthropic and nonsynanthropic bat species differs, when estimated by active surveillance as compared to passive surveillance (Klug et al. 2011). When estimated by active surveillance, rabies incidence among bats is generally ≤1% of a population, regardless of roosting habits (Constantine et al. 1968; Trimarchi and Debbie 1977; Steece and Altenbach 1989; Klug et al. 2011). Reported cases detected by active surveillance are substantially lower than our results (6.1%), further suggesting sampling bias in the proportion of rabid bats estimated by passive surveillance. However, with regard to public health risk, the passive surveillance estimate is still the most relevant for the general public, who do not in general seek out interactions with bats in the wild.
Rabies diagnostic laboratories frequently have limited capacity to identify bats submitted for rabies diagnosis. During the study interval, slightly less than half (42.6%) of all bats were identified to the level of genus or species. The lack of taxonomic identification of some bats, as well as probable errors in accurate identification (up to 7% of submissions as reported in the study by Streicker et al. 2010), are also limitations of the study. When resources are limited, states should partner with bat biologists or cooperate with universities to create a laboratory exercise for veterinary and wildlife students to identify submissions that have tested negative, which could improve the rates of bat identification among submissions, and could have invaluable educational value for training in taxonomy and the use of dichotomous keys. Use of imprecise nomenclature for recording bat species at the level of the diagnostic laboratory, and subsequent processing of data at the CDC into a national database, may also introduce sources of error in recording bat species identification data. For example, the use of common names (e.g., big brown bat) may create confusion between descriptive entries, versus actual species identification. Similarly, regional uses of common names may also create misidentification at a national level.
Results of our analyses demonstrate the role of epidemiologic factors associated with rabies in bats, including seasonality, regional differences, and the effects of roosting habits, on both the proportion of rabid bats and numbers of bats submitted for diagnosis. Continued improvements in the consistency of bat rabies submission policies among states, increased identification of bats and adoption of national vocabulary standards for reporting, in combination with active surveillance, will further advance the epidemiological knowledge of bat rabies in the U.S. Rabies cases in humans in the U.S. are uncommon, but their strong association with bat RV variants warrants further investigation of surveillance trends regarding bat rabies to address this important public health topic, especially as other potential drivers, such as climate change or other infectious diseases (e.g., white-nose syndrome), may affect future patterns and associations.
Footnotes
Acknowledgments
The authors acknowledge the work of state and local health departments to collect and report information on animal rabies diagnosis. A.T. is supported by a fellowship from the Oak Ridge Institute for Science and Education. Use of trade names and commercial sources are for identification only and do not imply endorsement by the U.S. Department of Health and Human Services. The findings and conclusions in this article are those of the authors and do not necessarily represent the views of their institutions.
Author Disclosure Statement
No competing financial interests exist.