
Abstract
Diagnosed cases of tick-borne encephalitis (TBE) and Lyme disease (LD) have been reportable infectious diseases in Hungary since 1977 and 1998, respectively. Clinically diagnosed cases have been registered in the National Database of Epidemiological Surveillance System (NDESS). All reported TBE cases are confirmed by laboratory serological and, if necessary, PCR tests, whereas the registered cases of LD are mainly based on the appearance of erythema migrans concurring with possible exposure of tick bite. Our work is the first comparative epidemiological and geographical information analysis of these 2 diseases together. The following demographic data from each individual case (703 TBE and 13,606 LD) recorded in the NDESS were used: Sex, age, the starting date and place of the onset of disease, and a short report from the affected person. The descriptive epidemiological analysis of incidence was carried out using directly standardized rates, and smoothed indirectly standardized incidence ratios were calculated by hierarchical Bayesian methods at the municipality level using a Rapid Inquiry Facility (RIF). The average yearly incidence rate of TBE was 0.64 per 100,000 inhabitants (range, 0.46–0.84) and of LD was 12.37 per 100,000 inhabitants (range, 9.9–18.1), with the highest incidence rates in 1998 for TBE and 2008 for LD. The most affected age groups were men between 15 and 59 years of age for TBE, and women between 45 and 64 years of age for LD. Seasonality, based on the starting date of the illness, was also characterized. Extended areas of high risk were identified in western and northern Hungary, illustrated on high-resolution (municipality level) maps. On the basis of our analysis, it is possible to associate areas and periods of high-risk with characteristics (sex, age, residence) of groups most affected by tick-borne diseases in Hungary.
Introduction
TBE is a reportable infectious disease in 16 European countries; between 1990 and 2007, a total of 157,584 TBE cases were documented (total includes Russian cases). This figure represents an average of 8755 cases per year in Europe within this 18-year period (Süss 2008a). More than 100,000 cases of LD are reported annually in the temperate zone of the Northern Hemisphere, approximately 85,000 cases in Europe and 20,000 cases in the United States. In Europe, the highest incidence rate of LD (300 per 100,000 population) occurred in Austria (Lindgren and Jaenson 2006). However, the number of TBE and LD cases may be largely underestimated in Europe because case-reporting systems differ among countries and are highly inconsistent. Additionally, many TBE or LD infections go undiagnosed or unreported. Still, increases in the incidence rates of both diseases were observed over the last decade in most European countries (Lindgren and Jaenson 2006, Süss 2011).
The distribution of I. ricinus ticks is determined by climatic conditions. In Europe, the range of I. ricinus has reportedly shifted toward northern and higher-altitude locations during recent years (Lindgren et al. 2000, Daniel et al. 2003). In addition to changing climatic conditions, socioeconomic and land-use practices may have contributed to environmental conditions favorable for I. ricinus range expansion, thus leading to a further spread of tick-borne diseases (Randolph 2008, Šumilo et al. 2008). Tick-borne diseases were found to be affected by the spatial distribution of forests, which are the main habitats for vectors and hosts (De Mik et al. 1997, Jackson et al. 2006, Rácz et al. 2006). In the Baltic states, land cover and climatic factors were identified as major elements contributing to the spatial variance of human TBE cases (Šumilo et al. 2006). It is also known that the spatial distribution of I. ricinus depends on the temperature and the normalized difference vegetation index (Estrada-Peña 2001).
The aim of this study was to analyze recorded TBE and LD morbidity data between 1998 and 2008 to examine the association between landscape characteristics (e.g., altitude and forest coverage) of the infection sites of TBE and LD and the spatial variance of incidence at municipality level in Hungary.
Materials And Methods
Data
In Hungary, TBE and LD are reported to the National Center of Epidemiology, and recorded in the National Database of Epidemiological Surveillance System (NDESS) using the infectious disease report card completed by the physician who established the medical diagnosis. The reported and confirmed TBE cases are based on laboratory serological tests, whereas the diagnosis of LD is mainly based on the presence of erythema migrans in connection with a report of tick bite exposure. TBE cases caused by the ingestion of unpasteurized dairy products were excluded.
Morbidity and corresponding demographic data (sex, age, place and date of disease onset) between 1998 and 2008, were obtained from two sources, the National Centre for Epidemiology and NDESS. Population data at the municipality level, by sex and age groups from 1998 to 2008, were obtained from the National Institute of Environmental Health. Age in the population data set was recorded in intervals: One group for each year between ages 0–4, then 1 group for each consecutive 5 years from age 5 to 85, and finally 1 age group for age 85 and above.
The source of the forest layer was the Digital Mapping Database 200 (MoD Mapping 2010) (based on a military-issue paper map).
Temporal analysis
Examination of the annual variation of TBE and LD incidence was based on morbidity rates directly standardized for the European standard population age distribution (1976) (Waterhouse et al. 1976), which is widely adopted by the European Commission (EUROSTAT 2013, PAHO 2002) and the World Health Organization (WHO) Regional Office for Europe (HFA-DB 2011) as well. Age groups were the same as those for the population data. The reported annual morbidity data were tabulated in weekly periods (1–52) between 1998 and 2008.
Spatial analysis
Disease mapping
The spatial patterns of TBE and LD incidence were investigated at the municipality level. Indirect standardized incidence ratios (SIR) smoothed using hierarchical Bayesian methods were calculated by taking the age-specific incidence rates of the Hungarian population as a reference; risks were adjusted for age (Besag et al. 1991). This model shrinks unstable risks (e.g., municipal-level data) toward the global mean risk (heterogeneous component), in this case the Hungarian average, and the local mean risk (spatial component), accounting for spatial autocorrelation by “borrowing” information from adjacent areas (which share a common border). The probability of each area having above-average risk (i.e., SIR>1.0) was computed as a measure of uncertainty (Richardson et al. 2004). The fraction of the variation in risk that could be attributed to the spatial component (spatial fraction) was also calculated.
GIS Pilot Study
The official Hungarian definition of a forest is described as a “…growing stock consisting of certain tree and shrub species (…) with a minimum extent of 5000 square meters, minimum average height of 2 meters, and minimal coverage of 50 percent” (Act XXXVII of 2009, Parliament of the Republic of Hungary). The attribute data of the available forest layer permitted only the area-based filtering (e.g., no coverage information was available) so the remaining conditions were assumed to be fulfilled by the source (the military base) map. To assure the precision of area calculation the layer was transformed to area preserving projection (World Cylindrical Equal Area [WCEA]). Our aim was to create the forest layer as a subset of the country-level elevation raster, a task that was performed by several steps using country-level 50-meter contour lines. Before interpolating to a continuous surface of elevation, an editing session of the contour lines was applied. This step minimized distortion during the projection step caused by the wide, continuous plains at low elevation above the sea level (e.g., Great Hungarian Plain). The triangulated irregular network (TIN) created from the refined contour lines made up the source of the elevation raster (ER) of Hungary (where cell value refers to elevation) (Fig. 1).
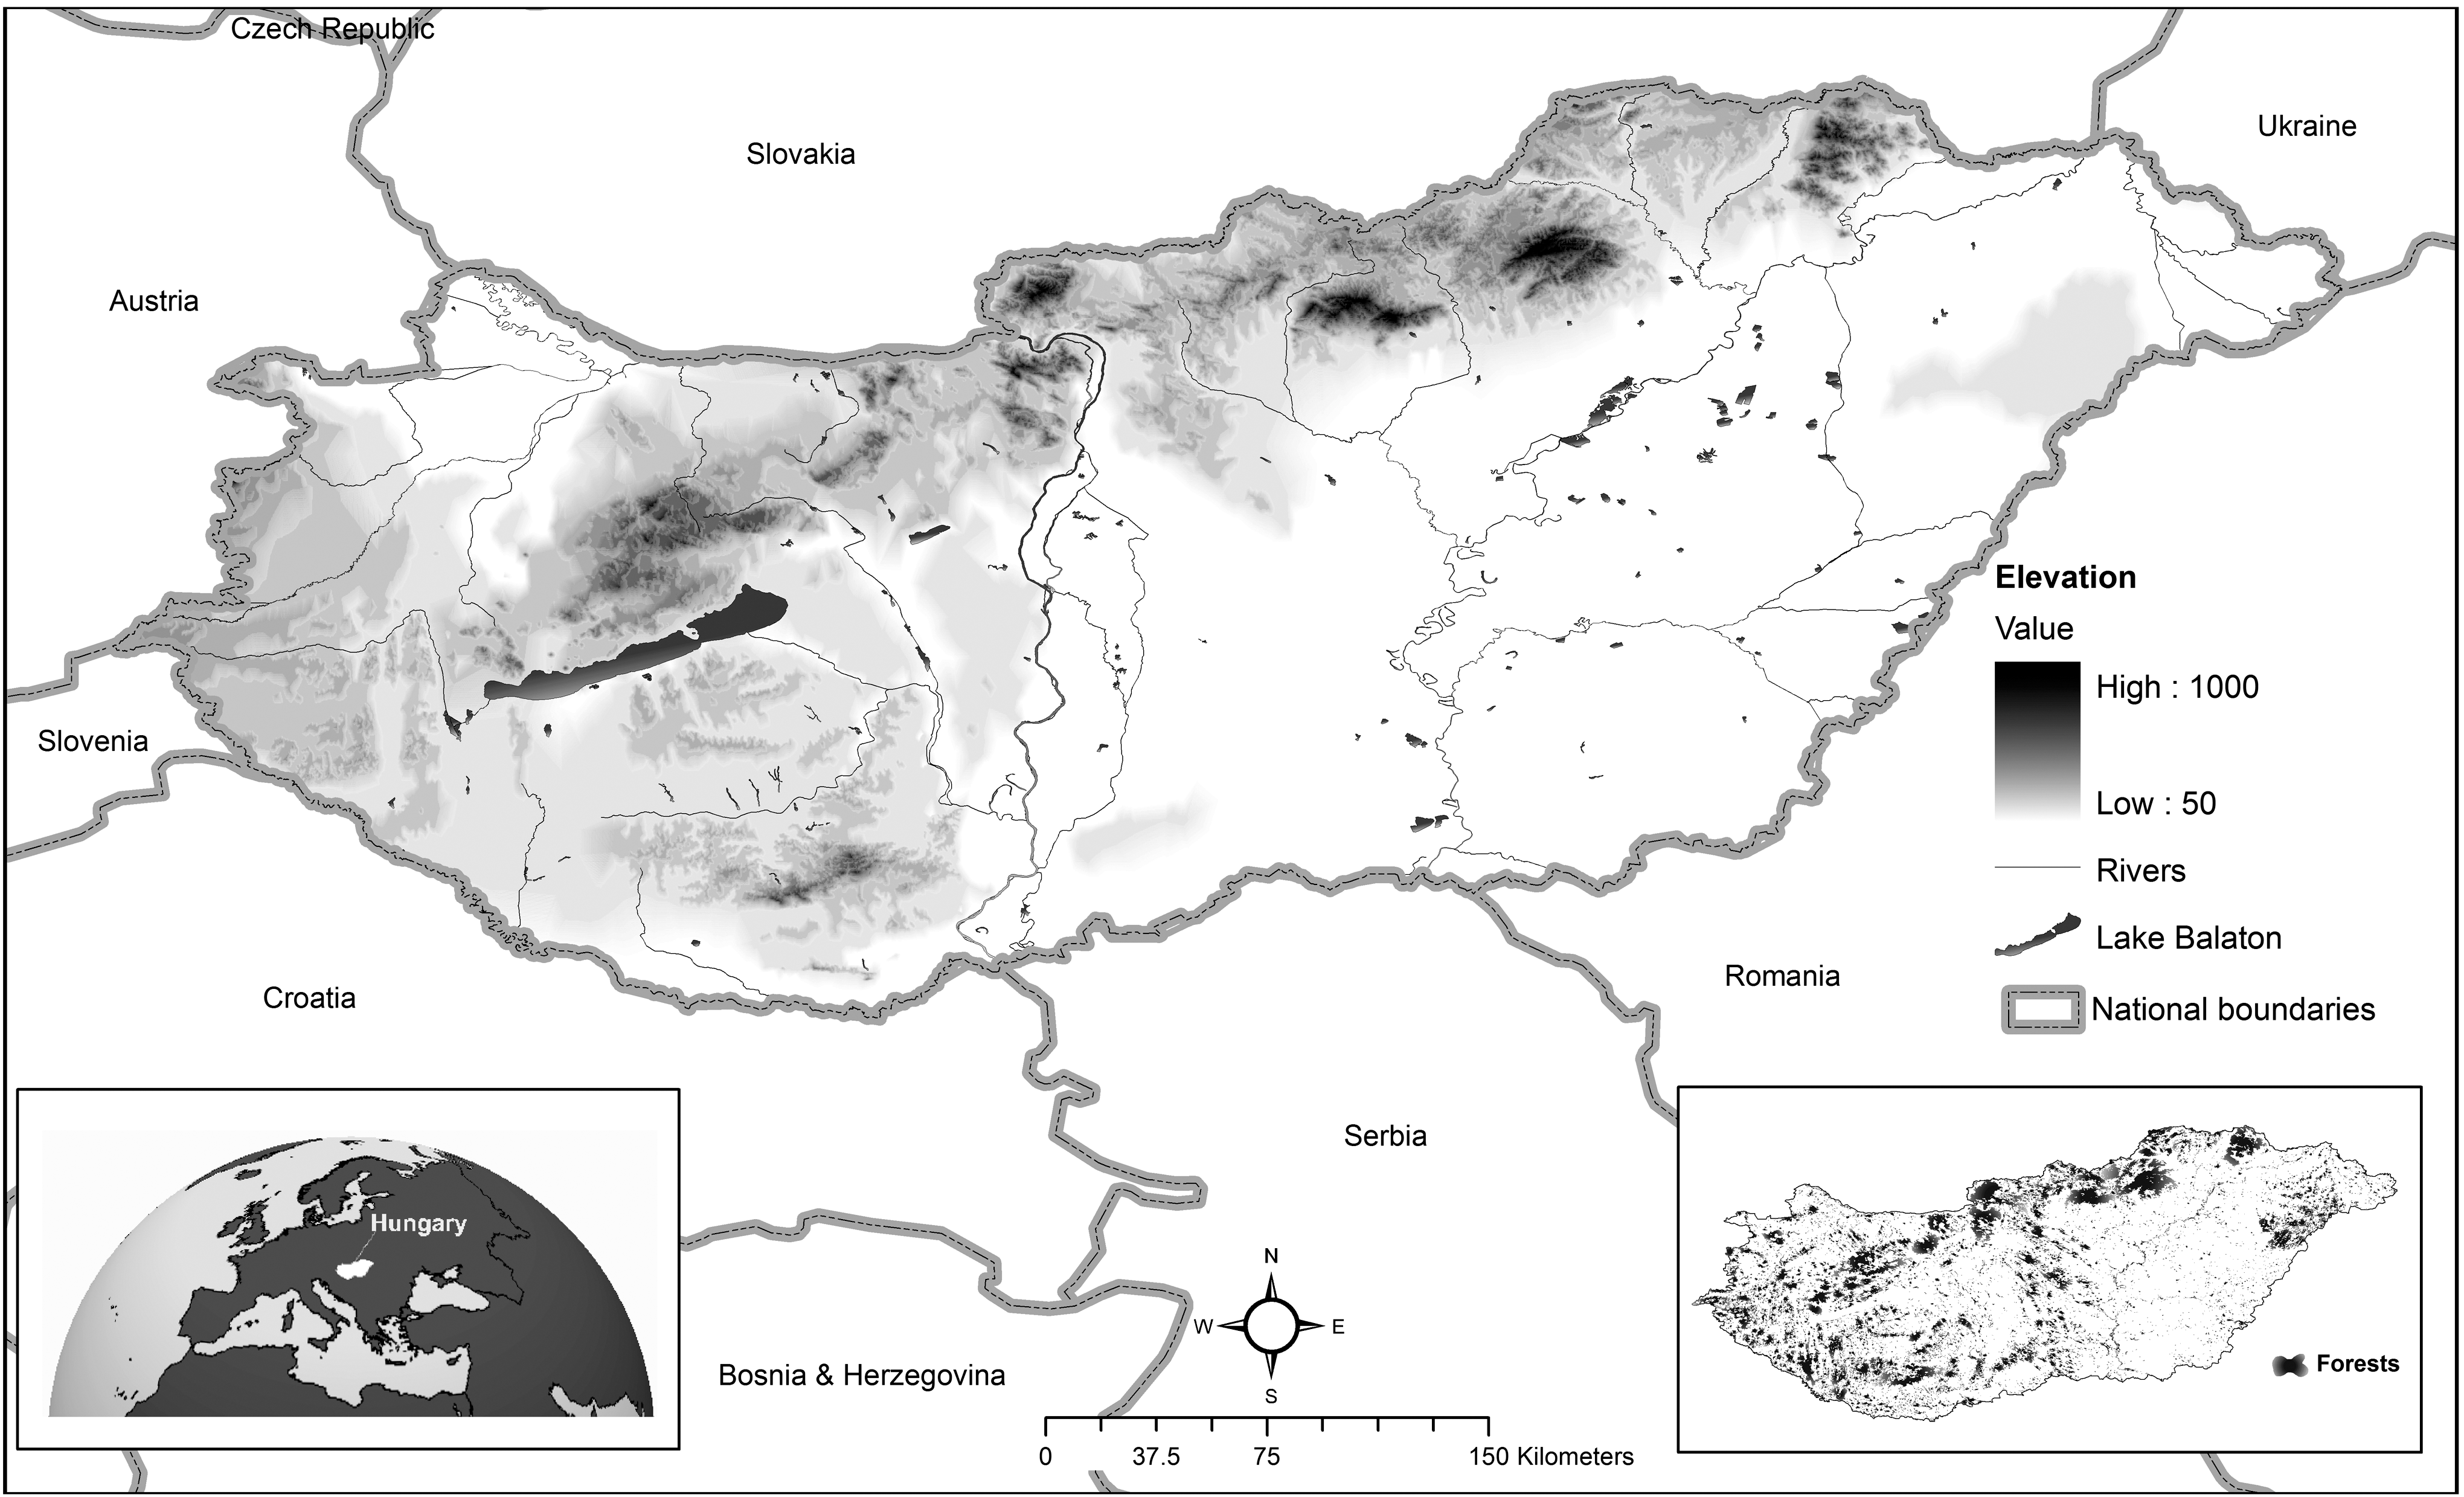
Topography of Hungary.
A uniform (cell value=1 meter) forest-based raster was created from the forest polygon, and then it was spatially overlaid with the ER using specific weights (ER weight=1, forest weight=0.1). The resulting forest layer was a location-based subset of the country level elevation raster, where the cell value was a good approximation of the original elevation data (height difference below 1 meter).
Risk analysis
As a pilot study, the association between altitude of the reported locality of TBE and LD and the spatial variance in incidence due to TBE and LD was assumed. SIRs were obtained using latitude quintiles for each municipality where the risk of lowest quintile (lowest areas, band 5) was featured as a reference. The association between distance of the place of TBE and LD notifications from borders of forests exceeding 150 meters altitude (high forests) and the spatial distribution of incidence due to TBE and LD was also calculated (Fig. 2).
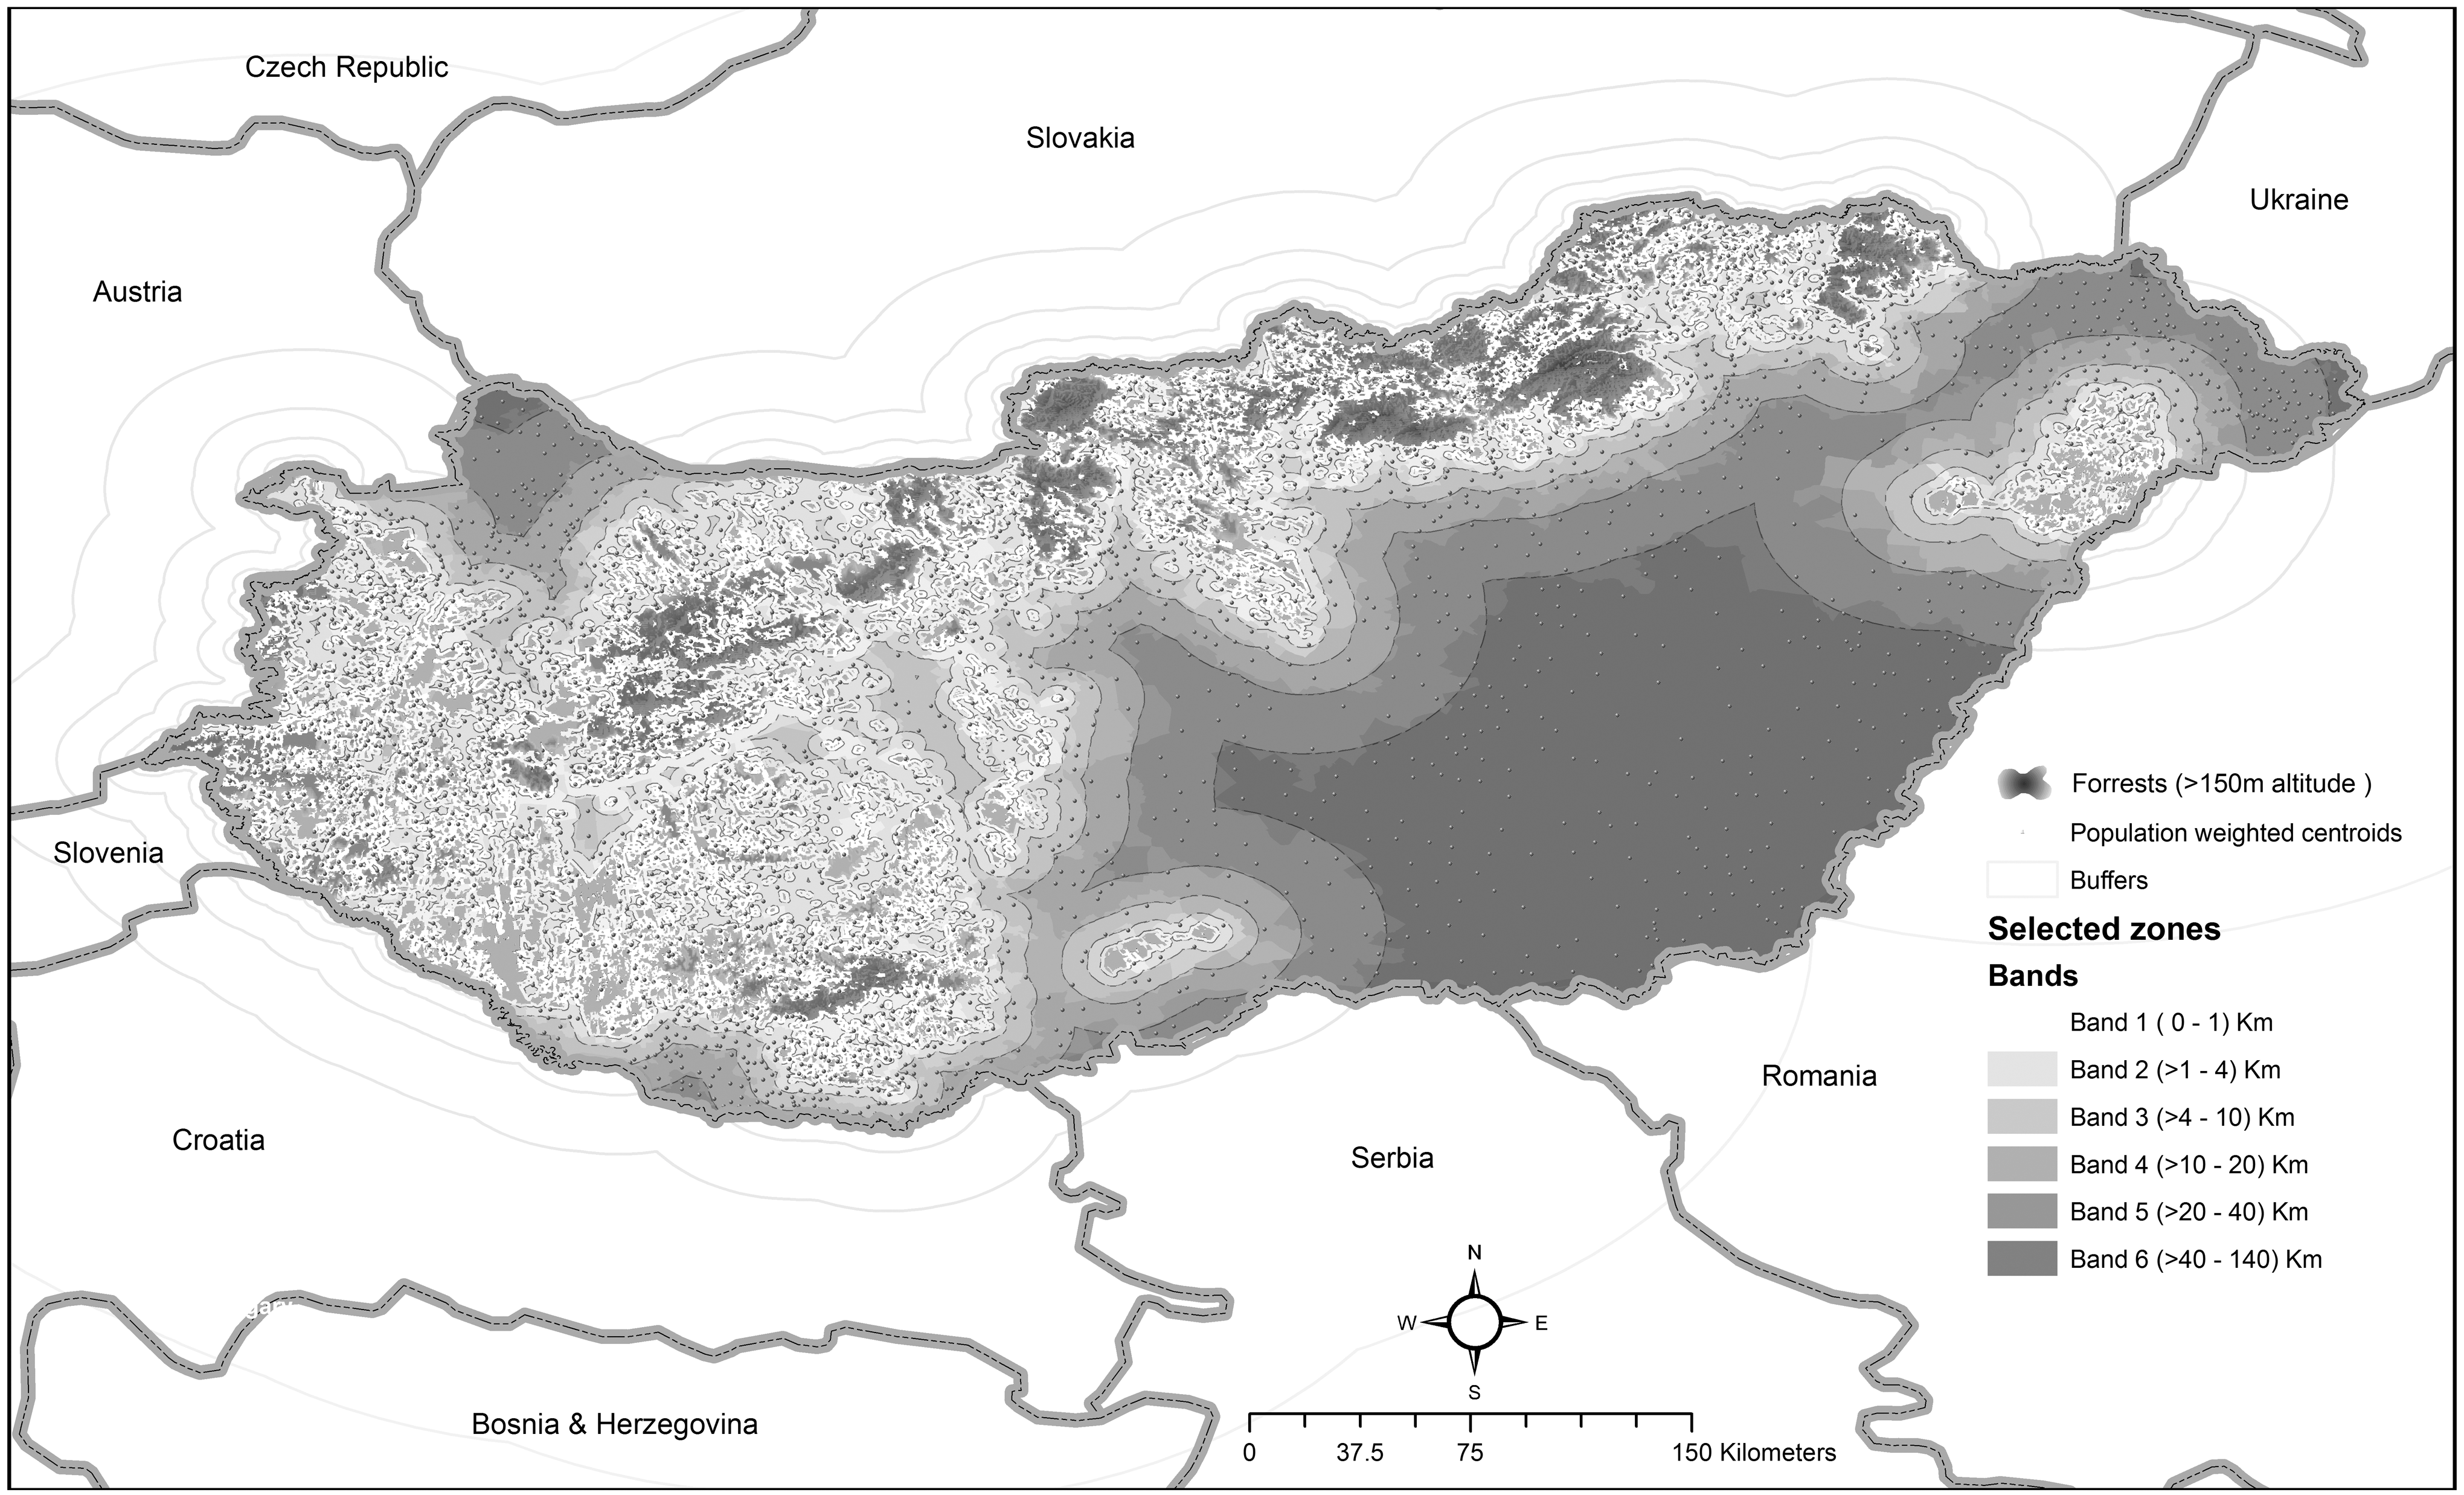
Forests above 150 meters of altitude and bands of municipalities grouped according distance from these forests in Hungary.
The altitude cut point was suggested by the pilot study. Incidence rates of populations living in municipalities falling within 1-4-10-20-40 kilometers from high forests were compared with incidence rates of populations residing in municipalities falling over 40 kilometers from these forests (places farthest from the high forests). These distances (1-4-10-20-40 kilometers) reflect differences in the topography of the country that may influence exposure and capture sufficient size of population (particularly remote areas) for meaningful analysis. The distances mentioned above were determined in a preliminary test. We looked for values where the risk within and between the selected radii proved to be sufficiently homogeneous.
The population-weighted centroids of each municipality around the high forests were used to reduce the misclassification caused by the inhomogeneous population distribution within the units. Homogeneity and linear trend tests were carried out to check whether the risk is statistically homogeneous across bands and to test the global association of the latitude/distance and the relative risk of incidence due to TBE and LD (Breslow and Day 1987, Bland 2000).
Software
The spatial epidemiological studies were performed using Rapid Inquiry Facility (RIF 3.1.2), a free extension of ArcGIS Desktop (using “disease mapping” and “risk analysis” functionalities). The topographical modeling was performed using ArcGIS version 9.3 (ESRI 2008, Beale et al. 2010).
Results
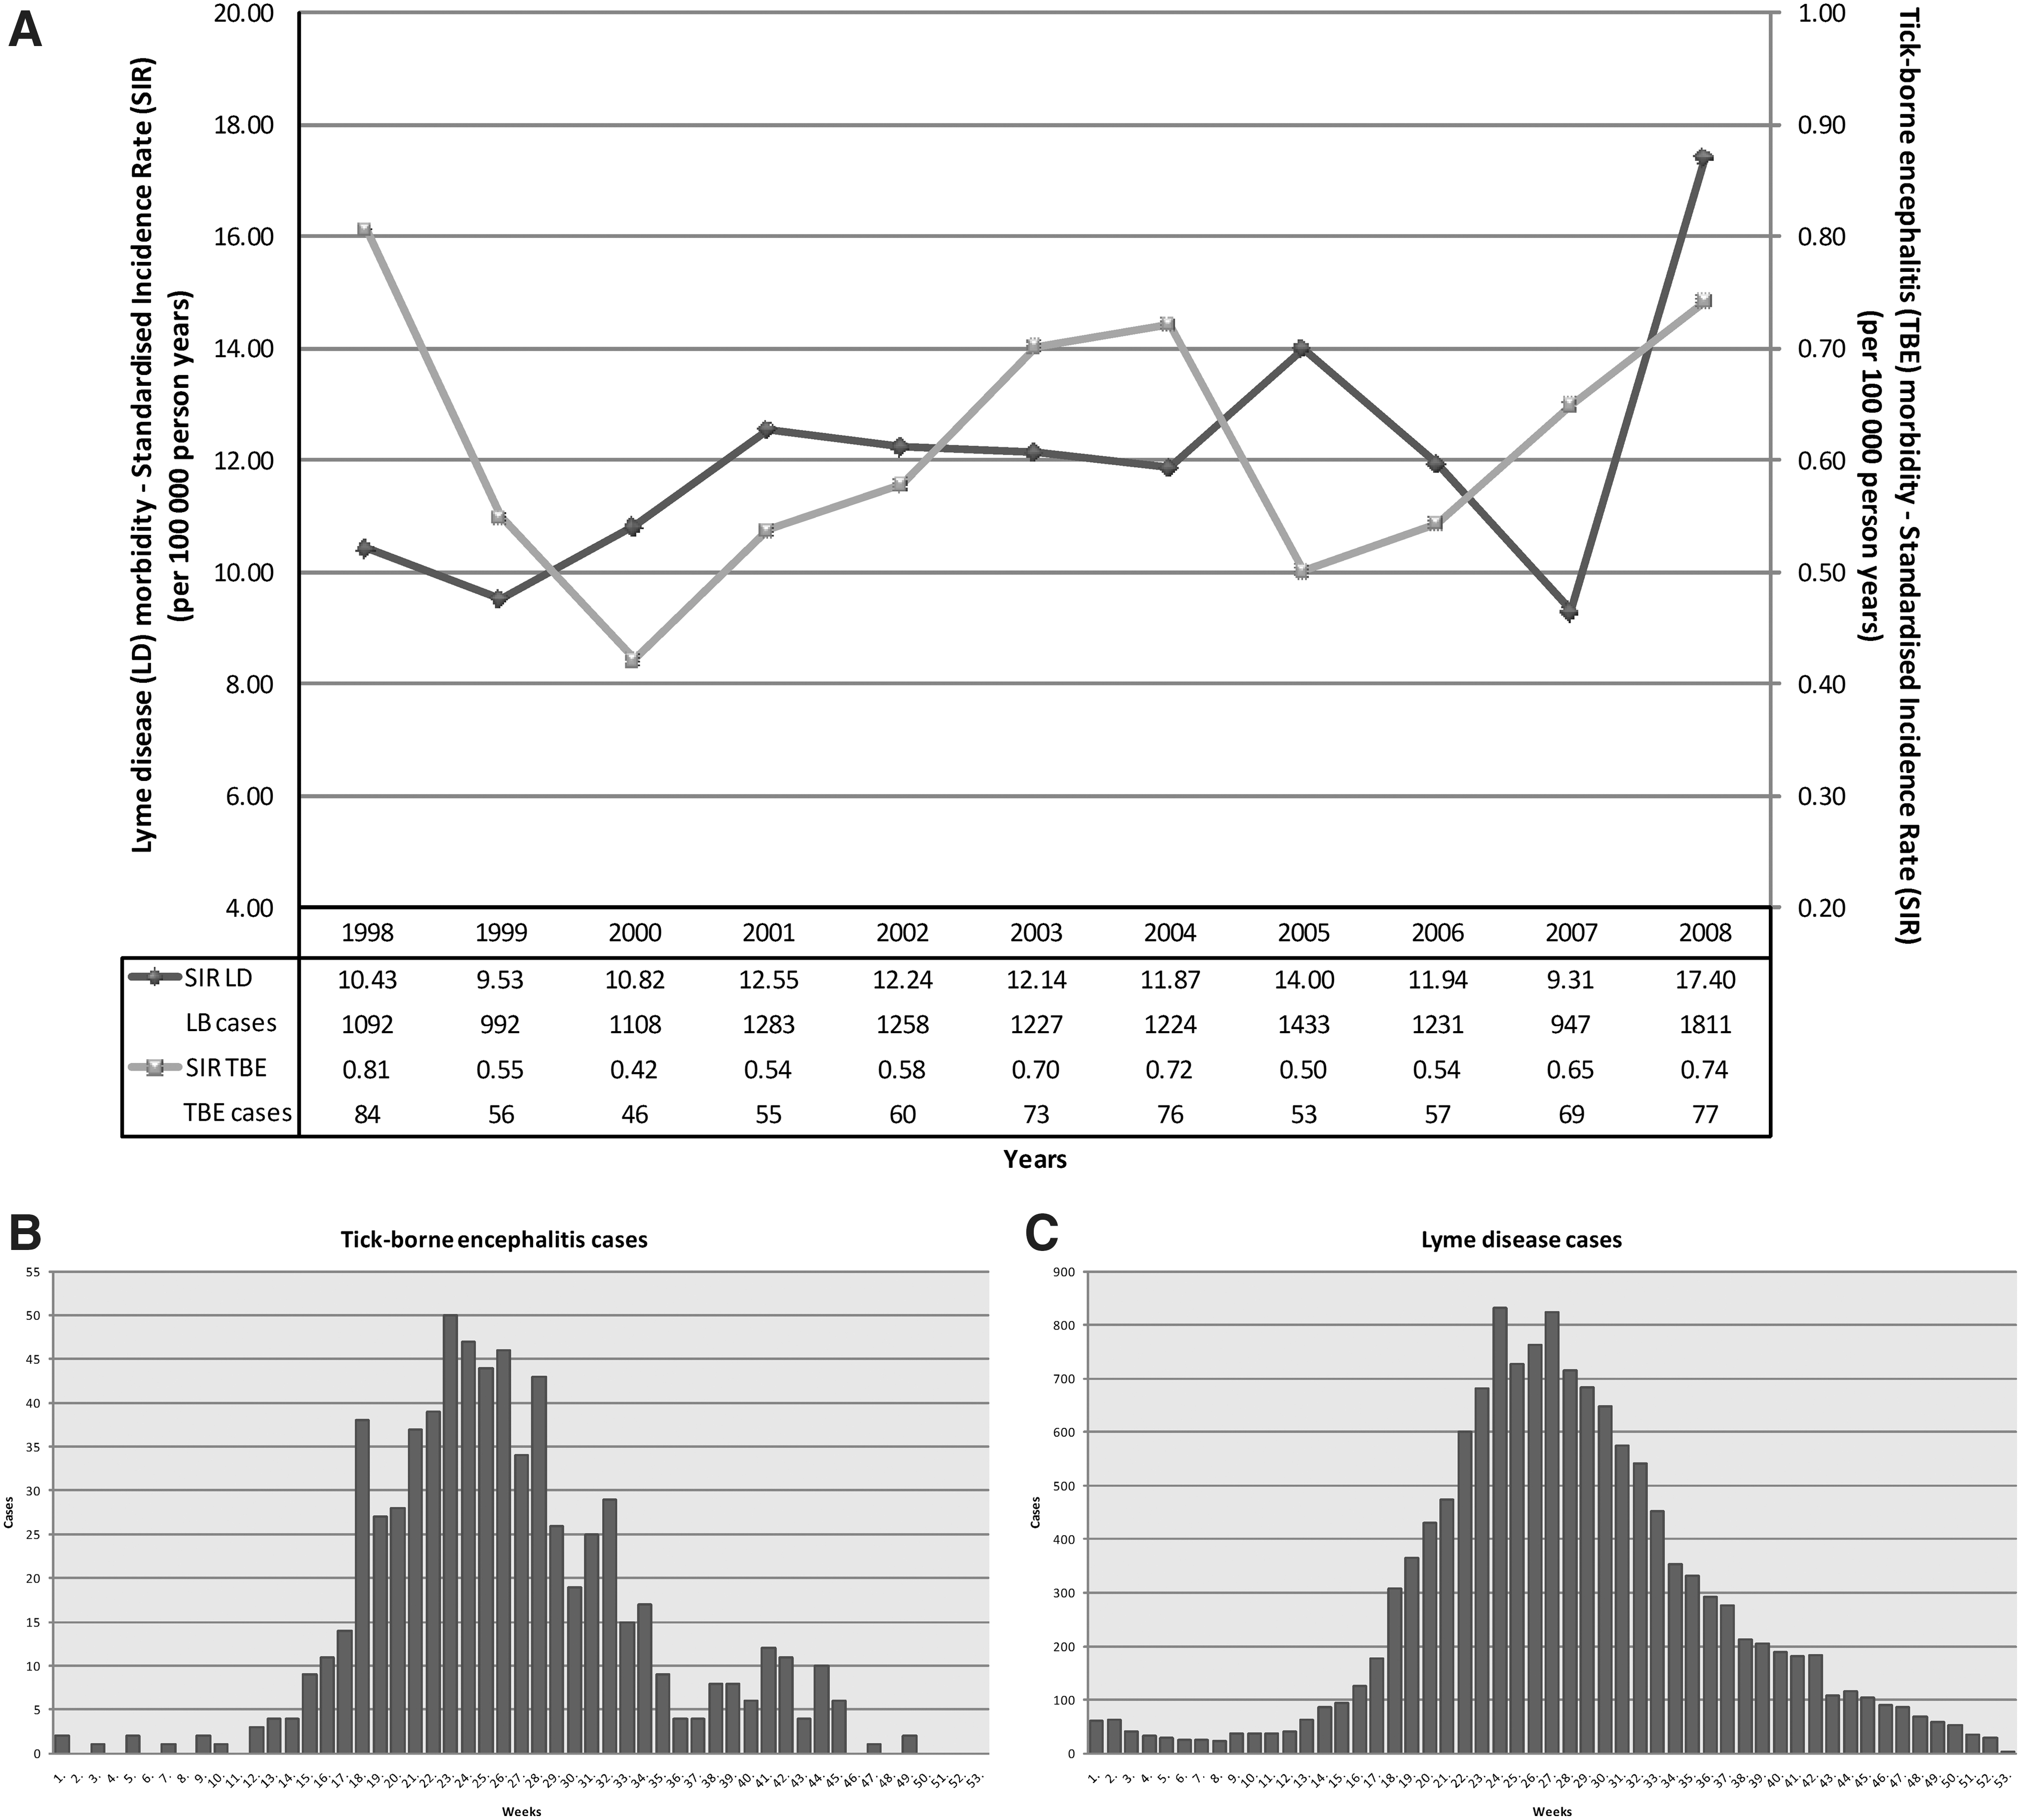
Overall, 703 TBE and 13,606 LD cases were recorded in the infectious disease reporting system in the 11 years between 1998 and 2008 in Hungary (annual average of 64 TBE and 1237 LD cases). The incidence of TBE was characterized by a W-shaped fluctuation with relative minima in 2000 and 2005 (Fig. 3A). Due to a higher number of cases, the yearly values and the trend of LD incidence (with highest value in 2008) did not show the smaller irregularities that can be seen in TBE. TBE incidence in the last 4 years indicates a rising tendency, where the incidence of LD demonstrated a slow and constant increase (Fig. 3A).
Evaluation of incidence (
The TBE cases and the vast majority of the LD cases occurred between weeks 17 and 34 and 18 and 36 (May–August), with a culmination between weeks 23 and 26 and weeks 24 and 27, respectively (Fig. 3B, C). The seasonal fluctuations of the notified TBE and LD cases from year to year were negligible. Despite the seasonal nature of LD and tick activity, there was not a single week between 1998 and 2008 when LD was not reported (Fig. 3C). A second explicit peak in the number of cases (in autumn) could only be observed in case of TBE. (Fig. 3B).
More than two-thirds (68%, 478 cases) of the reported TBE cases were males; only 32% (225 cases) were females. On the other hand, the LD cases had a nearly equal sex ratio (53%, 7211 cases were female, and 47%, 6395 cases were male). The age-specific TBE incidence rate was characterized by a predominance of men in all age groups during the study period. The rates were elevated in boys aged 2–4 and in men aged 35–39 and 45–49 years (Fig. 4A). The age-specific morbidity rates due to LD were considerably different from TBE. The highest, statistically significant morbidity rates due to LD were determined for females ages 45–64. A high rate was observed for children ages 2–9, but this difference was not significant (Fig. 4B).

Distribution of age-specific morbidity rate of registered TBE (
The spatial distribution of the smoothed SIR values was characterized by a strong spatial structure for both diseases. (Fig. 5A, B). The high values of the spatial fraction of the modeled random variation (95.97% [95% confidence interval (CI) 92.94–96.16] for TBE and 91.57% [95% CI 88.44–91.63] for LD) suggested a strong spatial dependency of incidence (spatial autocorrelation).
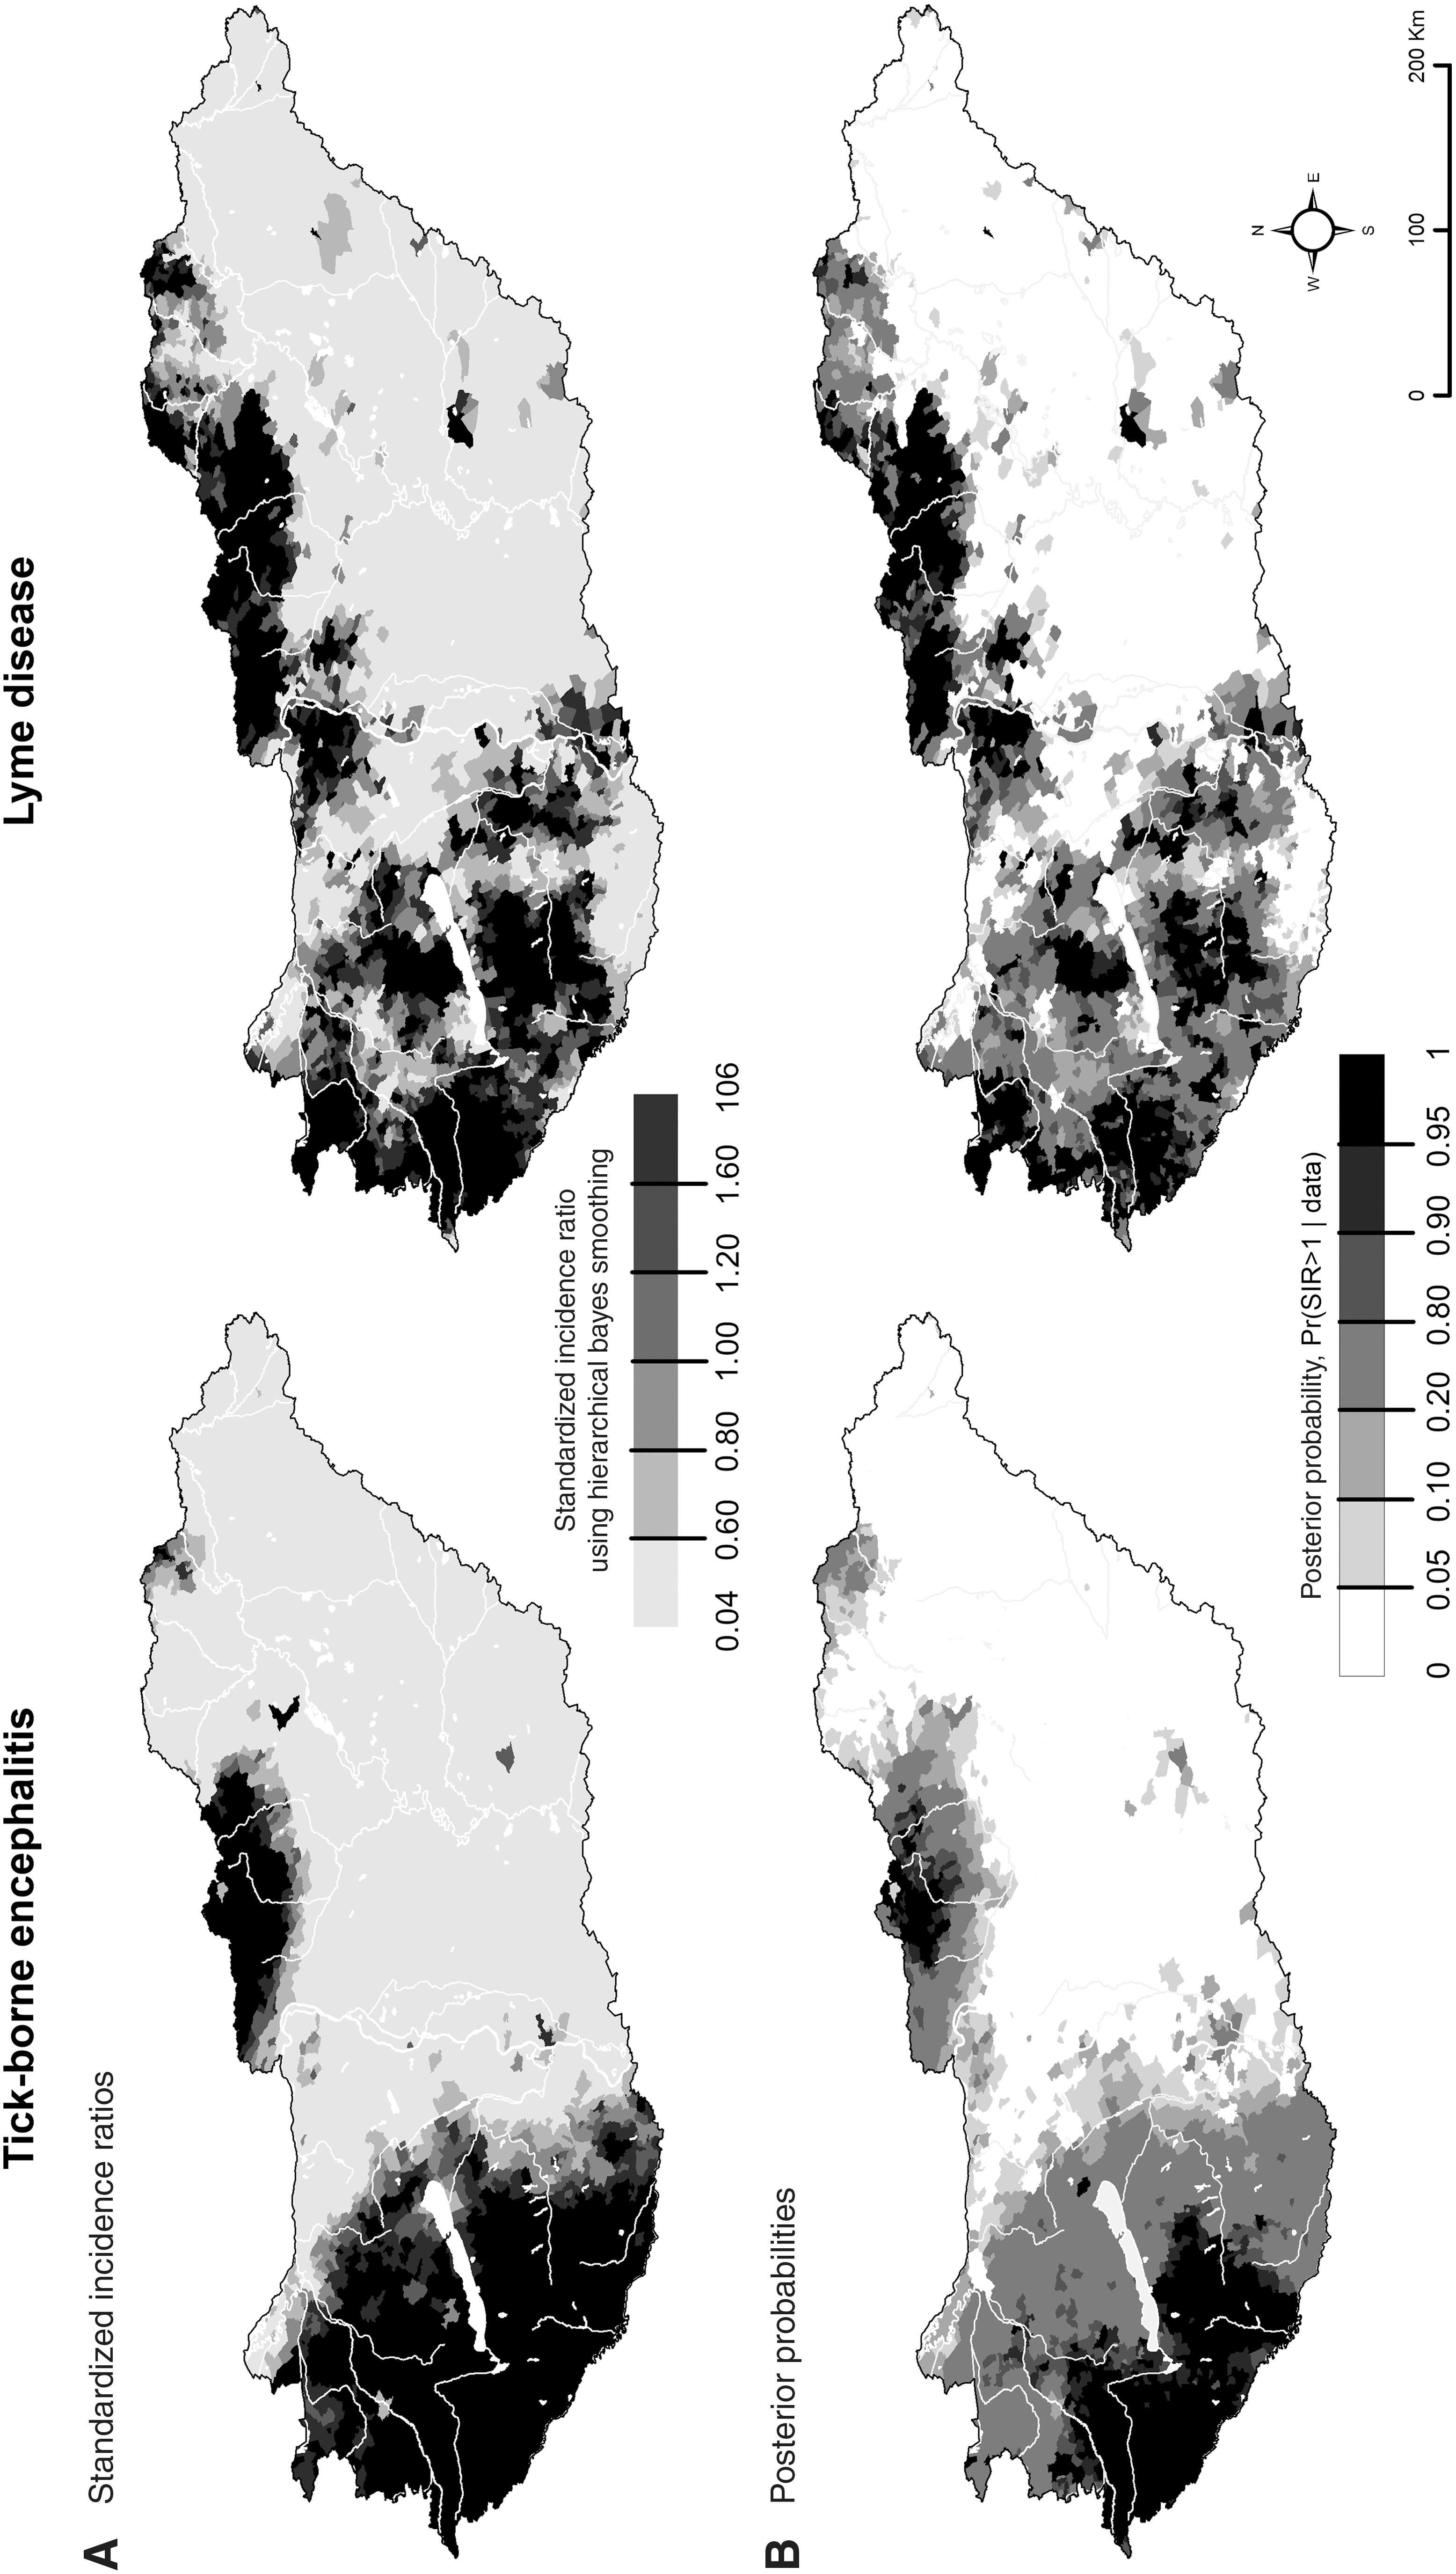
The spatial distribution of smoothed standardized incidence ratios (
The areas of significant excess morbidity risk were located in the southwestern part of Hungary and in areas near the central section of the northern border of the country for TBE (Fig. 5A, B). For LD areas of significant excess morbidity risk were located in the midwestern part of Hungary, above and below Lake Balaton and along the northeastern border (Fig. 5A, B).
In the pilot study, evidence of association between altitude of the place of TBE and LD notifications and the spatial inequalities of incidence due to TBE and LD was found (LD, χ2 Homogenity=6855.24, p=0 χ2 Linearity=6718.55, p=0; TBE, χ2 Homogenity=374.15, p=0 χ2 Linearity=334.08, p=0) (Table 1).
CI, Confidence interval.
The LD incidence rate assigned to localities above 200 meters (band 1) was 7.87 [95% CI 7.61–8.13] times higher and the TBE incidence rate was 10.93 [95% CI 9.37–12.75] times higher than those below 114 meters (band 5). The incidence in band 3 (municipalities falling between 140 and 155 meters of altitude) was equal or already higher than the national average incidence (LD, 1.031 [95% CI 0.994–1.069], TBE, 1.404 [95% CI 1.224–1.610]). The average altitude of these municipalities was 148 meters, so we chose the forests exceeding 150 meters of altitude as source. The results of the risk analysis showed a strong inverse j-shaped association between the risk of morbidity due to both diseases and their distance from high forests (forests exceeding 150 meters of altitude) (LD, χ2 Homogenity=1463.49, p=0 χ2 Linearity=1427.89, p=0; TBE, χ2 Homogenity=862.29, p=0 χ2 Linearity=841.59, p=0). Disease risks showed a decreasing tendency with increasing distance from high altitude forests for both diseases (Table 2, Fig. 6).
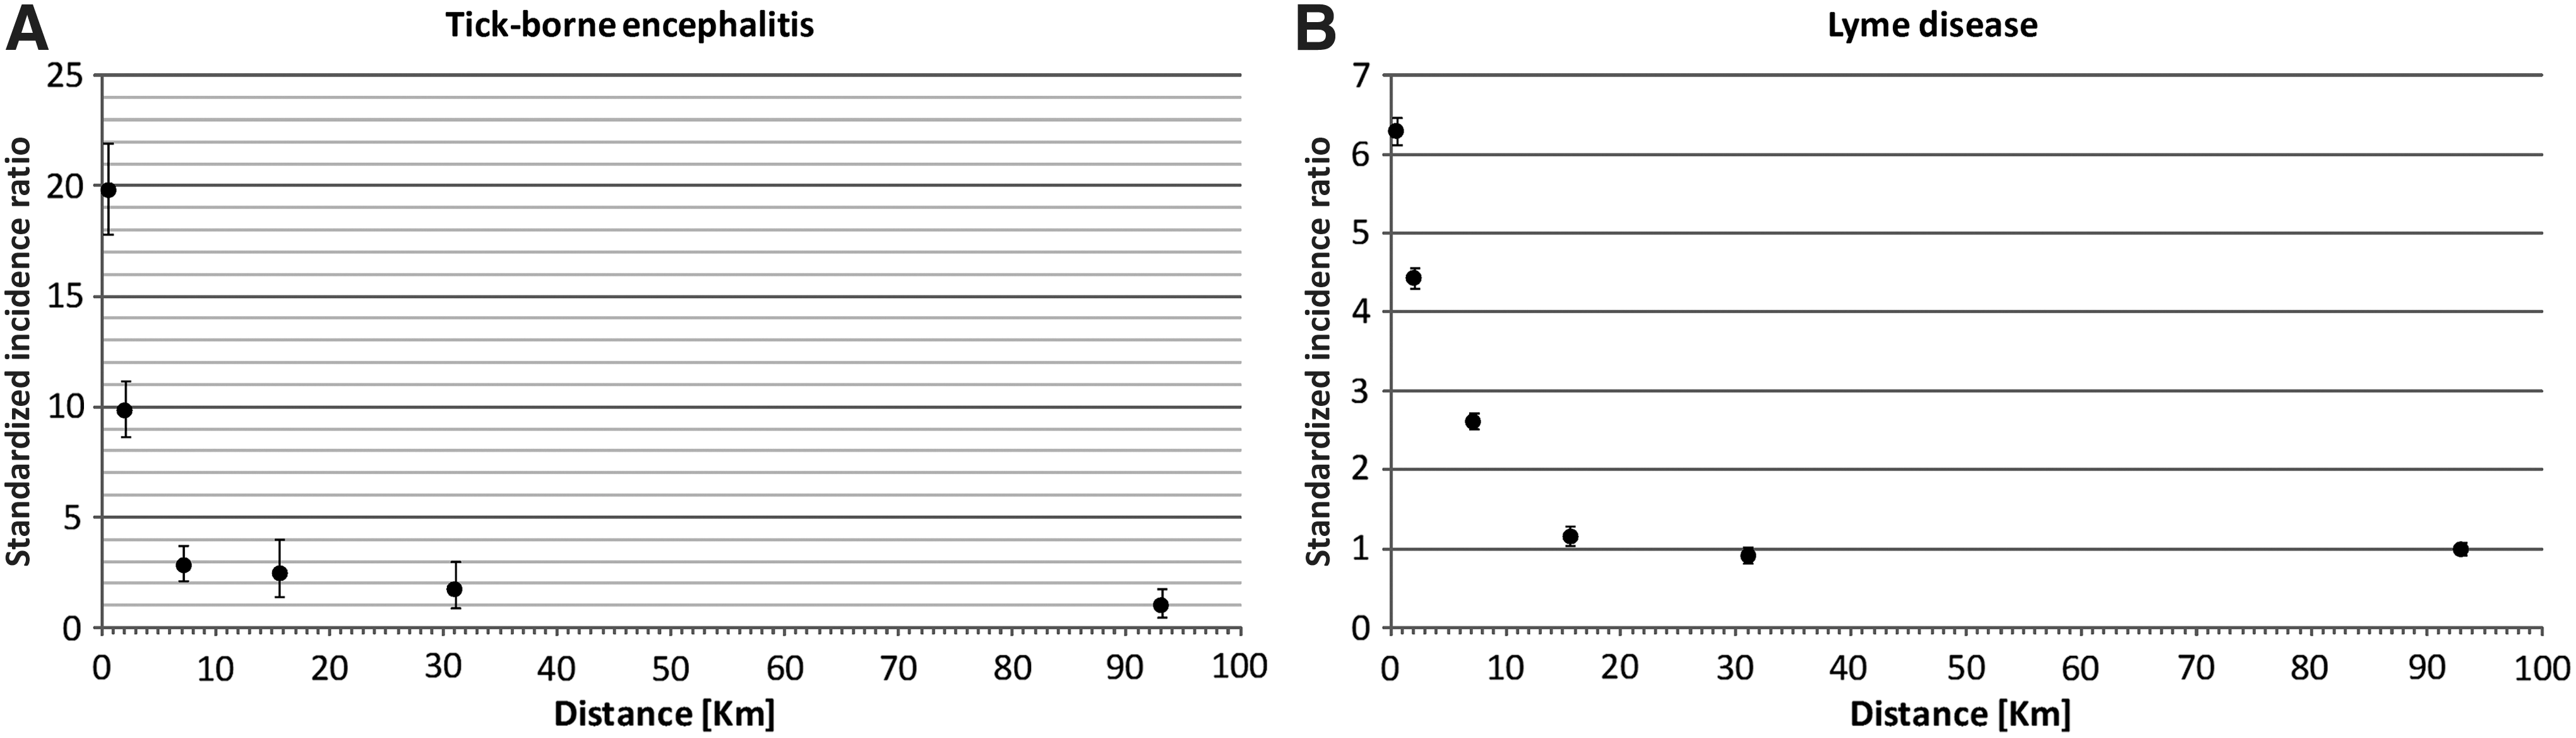
Association between incidence due to TBE (
CI, Confidence interval.
The association was similar for both diseases as described above; however, greater significant differences were identified between distance bands for TBE morbidity. Disease risk was nearly 20 times higher among populations living in the immediate vicinity of the high-altitude forests (0–1 km) compared to populations living farthest from the high-altitude forests (40 km and farther; SIR=19.78; [95% CI 17.85–21.92]; Fig. 6A). The morbidity risk of LD among populations living within 0–1 km distance from the high-altitude forests was more than 6 times higher than those living 40 kilometers or farther from the high-altitude forests (SIR=6.29; [95% CI 6.12–6.46]) (Fig. 6B).
Discussion
Contrary to the growing incidence of TBE and LD characteristic for several European countries, this tendency was only observed for LD in Hungary. Dissimilar gender distribution was described among the patients of TBE and LD. It was previously known that 70% of the 5561 TBE cases recorded between 1968 and 1995 were males (Lakos 1998). The main reason for this sex bias phenomenon is unknown, but it is congruent with the fact that working-age (15–59 years old) males, especially forestry workers, represented the group of the highest risk of TBE exposure. In contrast to TBE, a slight majority of LD cases were women. Our findings confirmed the latter in each year observed, except for 2003, which was presumably the consequence of the highly affected female age group 45–64. Results from a Slovenian study also showed a female dominance (54.6% of the 339 cases) (Ogrinc et al. 2008), but CDC's passive surveillance suggested a slight male dominance among LD cases (53.1% of the 243,564 cases) (Bacon et al. 2008).
Seasonal variation in the number of cases is a well-known feature of both diseases. Early Hungarian papers suggest that the first acute cases usually appear from late spring to early autumn, with a peak in summer (TBE, Fornosi and Molnár 1952, Gyergyai and Kamarás 1953, Juba 1953; LD, Török et al. 1987, Lakos 1988); our data confirmed this pattern. This seasonal pattern is caused by the seasonal activity of the tick vector (Ogden et al. 2007). Studies concerning spatial variation in human cases, as well as specific pathogen prevalence in ticks, concluded that the risk of TBE and LD showed dissimilar spatial patterns within the distribution area of I. ricinus (Daniel et al. 2006, Lindgren and Jaenson 2006). This pattern was recognized even in early papers on TBE and described as natural foci of infection (Pavlovsky 1966).
In Europe, the prevalence of both pathogens in ticks showed a notable variance depending on the site of collection, but central European and Baltic–Scandinavian foci of high transmission rates were outlined (Daniel et al. 2006, Lindgren and Jaenson 2006). A high probability of transmission can be expected in localities with high pathogen prevalence where the competent vector species, and the reservoir hosts are present simultaneously. In addition, the pathogen transmission rate is also affected by specific climatic and ecological factors and the extent of human exposure to tick bite as well. The most favorable biotopes in Hungary are the deciduous forests with rich undergrowth and their surrounding areas. The highest altitude at which I. ricinus was found in Hungary was 900–1000 meters above sea level (Hornok and Farkas 2009). Our results indicated higher incidence at places of natural foci known from previous human epidemiological studies and/or at locations with specific landscape or vegetation favorable for I. ricinus.
Geographic information system (GIS)-based methods in the study of tick-borne diseases have a rich literature (Glass et al. 1995, Rácz et al. 2006, Eisen and Eisen 2007). The spatial components of reported and serologically confirmed TBE cases were previously examined in Hungary (Rácz et al. 2006); however, our study is the first to include LD cases as well. We found, that the TBE foci of infection were characterized by a smaller, more compact (“patch-like”) spatial spread compared to LD. This may be the result of the fact that virus prevalence in ticks is 1 or 2 orders of magnitude lower than Borrelia prevalence (Rauter and Hartung 2005, Daniel et al. 2006, Süss 2008b, Lakos 2009).
The simultaneous analysis of the higher-altitude locations (at least to a certain elevation) and the forest coverage added a new aspect to the definition of a typical transmission area. The human habitats lying in the high-altitude or in the immediate vicinity (0–1 km) of a high-altitude region can be considered as exposed to significant risk. Previously, it was stated that the forest cover is related to the number of reported TBE cases in each Hungarian county, and the proximity of human habitats and forests explained the observed pattern of TBE incidence in Hungary (Rácz et al. 2006). Our results confirmed these findings in the case of TBE and demonstrated these for the first time in the case of LD.
Limitations of findings
It is clear that unreported morbidity cases can be a major limitation of studies based on routine surveillance data. The number of identified cases of both diseases is influenced by several factors: The occasional poor symptoms, the patient's habits to see a physician, the reporting discipline of the medical staff, and, finally, especially in the case of LD, the uncertainty of the diagnostic methods.
Geocoding of cases was based on reported residence of the patient instead of probable location of infection. Because the reported cases denoted strong spatial structure, a short effective distance between these two places was assumed. GIS approach was also source of limitation because our base map predated the Hungarian law regarding the definition of forests (only area-based filtering was performed). The relative low resolution of contour lines (50 meters) may have also added some distortion during the interpolation process. Problems related to the ecological fallacy need to be noted: thus, no individual-level assumptions should be made based on these findings (Beale et al. 2008). The observed associations with morbidity at population level may not necessarily be associated with disease in individuals.
The methods used and mentioned within this study may help to identify more accurately, based on specific age and gender groups, the population at high risk. These findings may also facilitate targeted prevention (e.g., early removal of the tick, usage of repellents, vaccination), and the increased awareness and education regarding the early symptoms. Because this descriptive epidemiological study was based on location-specific information, it may also help the planning of detailed analytical investigations (e.g., tick surveillance, vaccination coverage of TBE).
This study was the first joint analysis of the reported TBE and LD cases at the municipality level in Hungary. We examined the data from both descriptive and spatial epidemiological points of view. Our study demonstrated that in Hungary, between 1998 and 2008, the incidence rates of both TBE and LD were the highest at places mostly covered by forests and with the highest altitude above sea level as well. It is important to note that vegetation (e.g., forest type) itself can also be characterized by a certain altitude-related diversity, which could also be a contributing factor to our findings.
The locations most affected by these diseases overlapped considerably, but there were specific hot spots for both diseases. Further studies may be performed to reveal the changes of spatial distribution of disease over time using spatio-temporal disease mapping within a hierarchical Bayesian statistical framework (Abellan et al. 2008). In addition, the common risk and disease-specific areas are clearly identifiable using a shared component model (Knorr-Held and Best 2001).
Footnotes
Acknowledgments
The authors would like to thank Gábor Rácz and S. Elizabeth Rácz for many useful discussions and critical reading of the article.
Author Disclosure Statement
The authors state that no competing financial interests exist.