
Abstract
Yersinia pestis, the causative agent of plague, is primarily a rodent-associated, flea-borne zoonosis maintained in sylvatic foci throughout western North America. Transmission to humans is mediated most commonly by the flea vector Oropsylla montana and occurs predominantly in the southwestern United States. With few exceptions, previous studies showed O. montana to be an inefficient vector at transmitting Y. pestis at ambient temperatures, particularly when such fleas were fed on susceptible hosts more than a few days after ingesting an infectious blood meal. We examined whether holding fleas at subambient temperatures affected the transmissibility of Y. pestis by this vector. An infectious blood meal containing a virulent Y. pestis strain (CO96-3188) was given to colony-reared O. montana fleas. Potentially infected fleas were maintained at different temperatures (6°C, 10°C, 15°C, or 23°C). Transmission efficiencies were tested by allowing up to 15 infectious fleas to feed on each of 7 naïve CD-1 mice on days 1–4, 7, 10, 14, 17, and 21 postinfection (p.i.). Mice were monitored for signs of infection for 21 days after exposure to infectious fleas. Fleas held at 6°C, 10°C, and 15°C were able to effectively transmit at every time point p.i. The percentage of transmission to naïve mice by fleas maintained at low temperatures (46.0% at 6°C, 71.4% at 10°C, 66.7% at 15°C) was higher than for fleas maintained at 23°C (25.4%) and indicates that O. montana fleas efficiently transmit Y. pestis at low temperatures. Moreover, pooled percent per flea transmission efficiencies for flea cohorts maintained at temperatures of 10°C and 15°C (8.67% and 7.87%, respectively) showed a statistically significant difference in the pooled percent per flea transmission efficiency from fleas maintained at 23°C (1.94%). This is the first comprehensive study to demonstrate efficient transmission of Y. pestis by O. montana fleas maintained at temperatures as low as 6°C. Our findings further contribute to the understanding of plague ecology in temperate climates by providing support for the hypothesis that Y. pestis is able to overwinter within the flea gut and potentially cause infection during the following transmission season. The findings also might hold implications for explaining the focality of plague in tropical regions.
Introduction
Despite its historical human toll, plague is primarily a flea-borne zoonosis of rodents; however, nearly all mammals are susceptible to infection with the highly virulent plague bacterium, and some experience severe disease (Pollitzer 1954, Gage and Kosoy 2005). Plague is thought to persist in nature in enzootic or maintenance cycles involving transmission between rodents and their associated fleas (Gage and Kosoy 2005). Periods of enzootic transmission are characterized by low to virtually undetectable levels of rodent mortality. Although this might be explained simply by low-level but sustainable transmission between rodents and their fleas, the actual mechanism(s) of persistence of Y. pestis during enzootic or interepizootic periods is still a subject of much speculation (Gage and Kosoy 2005, Eisen and Gage 2009). However, under favorable conditions, which are likely to include certain abiotic environmental factors, such as those related to climate, as well as the abundances of both fleas and susceptible mammalian hosts (amplifying hosts), rapidly spreading epizootics can occur that often have devastating effects on local populations of rodents and, occasionally, other wildlife species. Periods of epizootic activity also can pose significantly increased risk for human plague as infected fleas seek alternative hosts (Poland and Barnes 1979, Poland et al. 1994, Gage et al. 1995, Gage and Kosoy 2005, Eisen and Gage 2009).
Transmission of Y. pestis typically occurs through the bite of an infectious flea that has fed on a heavily bacteremic host. Subsequent transmission to a naïve host has been reported to be dependent on the ability of the plague bacteria to colonize the midgut and proventriculus of the flea, eventually forming bacteria-laden masses large enough to occlude the proventricular valve separating the foregut from the midgut. This blockage phenomenon, which was first described by Bacot and Martin (1914) in the flea Xenopsylla cheopis and quickly became the prevailing paradigm for flea-borne transmission of Y. pestis, prevents the flow of blood to the midgut, resulting in starvation of the flea. Blocked fleas, although tenacious in their repeated attempts to feed, are typically unsuccessful in moving blood past the proventricular blockage. Consequently, blood and Y. pestis bacteria are ostensibly flushed back into the bite site, thus infecting the parasitized host (Gage and Kosoy 2005).
More recently, the molecular mechanisms responsible for blockage-dependent transmission of Y. pestis from flea to mammalian host have been elucidated (Hinnebusch et al. 1996, Perry and Fetherston 1997, Hinnebusch 2005). Y. pestis forms a biofilm whose synthesis is temperature-dependent and reliant on the gene products of the hms (hemin storage locus) operon involved in the adsorption of exogenous hemin or the dye Congo Red and which comprises 3 gene loci (Perry et al. 1990, Hinnebusch et al. 1996, Lillard et al. 1997, Perry and Fetherston 1997, Jones et al. 1999, Kirillina et al. 2004). Moreover, regulation of biofilm production occurs posttranscriptionally, and synthesis of this polymeric β-1,6-N-acetyglucosamine-containing extracellular polysaccharide matrix appears optimal at ambient temperatures (23–28°C) and thus conducive to the environment of the flea gut (Kirillina et al. 2004, Perry et al. 2004, Bobrov et al. 2008, Hinnebusch and Erickson 2008).
Recently, Sun et al. (2011) described the differential control of Y. pestis biofilm formation in vitro and in the flea gut by the diguanylate cyclases (DGCs) HmsT and Y3730, respectively, with the latter exhibiting significantly greater involvement in blockage formation within the flea X. cheopis. While biofilm-mediated proventricular blockage has been the prevailing paradigm for flea-borne transmission of plague for nearly a century, recent evidence has demonstrated that unblocked fleas are also capable of transmitting Y. pestis almost immediately after obtaining an infectious blood meal, with the time to transmission being largely determined by how soon an infected flea will take its next blood meal (Eisen et al. 2006, Eisen et al. 2007b, Eisen et al. 2008a, Eisen et al. 2008b, Wilder et al. 2008a, Wilder et al. 2008b). This so-called early-phase transmission (EPT) model, which focuses on the ability of unblocked fleas to transmit for a period of a few days postinfectious feeding (≈4 days), may be a means of explaining the dynamics of rapidly moving plague epizootics (Eisen et al. 2006). Moreover, EPT can occur in the absence of biofilm formation, although biofilm likely is required for long-term maintenance of Y. pestis infection in fleas (Vetter et al. 2010 Vetter et al., unpublished data). Furthermore, Schotthoefer et al. (2011b) observed that infectious X. cheopis fleas can successfully transmit Y. pestis during EPT at temperatures up to 30°C, a temperature that equals or exceeds what has historically has been reported to result in blockage inhibition, low transmission rates, and higher clearance of infection (Kartman 1969, Cavanaugh 1971, Hinnebusch et al. 1998, Schotthoefer et al. 2011b).
The relationship between climate, temperature, and plague transmission has been studied for decades. Climatic conditions have been shown to influence the prevalence of plague, with variations in temperature, relative humidity, vapor pressure deficits, and precipitation as factors either favoring epidemic spread of plague or causing its rapid decline, with the latter being significantly influenced by temperatures that exceed 27–28°C (Verjbitski, et al. 1908, Cavanaugh 1971, Cavanaugh and Marshall 1972, Pham et al. 2009). Similarly, in the southwestern United States, increased late winter–early spring precipitation (Parmenter et al. 1999) or time-lagged increases in late winter precipitation correlated positively with increased human plague cases, whereas case declines were significantly impacted by the number of days exceeding threshold temperatures of 32°C or 35°C, depending on the area investigated (Enscore et al. 2002, Gage et al. 2008). Recent studies have demonstrated successful transmission of Y. pestis by X. cheopis fleas at temperatures up to 30°C during the early-phase (days 1–4 postinfection [p.i.]) (Schotthoefer et al. 2011b) and late-phase periods (days 7–28 p.i.) (Schotthoefer et al. 2011a). X. cheopis-mediated transmission of Y. pestis at low temperatures has met with limited success due either to increased mortality of this tropical flea species (Schotthoefer et al. 2011a) or prolonged extrinsic incubation periods (Kartman 1969).
In the current study, we report on the successful transmission of Y. pestis by the temperate-zone ground squirrel flea Oropsylla montana maintained at temperatures as low as 6°C over a period of 21 days p.i. Exposure of fleas to subambient temperatures is not without precedent because ground squirrel burrow temperatures reportedly have been measured at 15°C (Baudinette 1972). The implications of low-temperature growth, survival, and persistence within the O. montana gut as a means of explaining the potential for Y. pestis to persist during the colder winter months and remain viable transmitters of the plague bacillus during the subsequent transmission season are discussed. We also discuss the implications of these findings for the potential role of fleas as reservoirs of Y. pestis and the maintenance of long-term plague foci in both temperate and tropical regions.
Materials and Methods
Yersinia pestis growth conditions
The bacterial strain used in this study, CO96-3188 (Pgm+, pCD1+, pMT1+, pPCP1+) (Engelthaler and Gage 2000), is a fully virulent North American strain of Y. pestis. Culture stocks of CO96-3188 were maintained in heart infusion broth (HIB) supplemented with 10% glycerol and stored at −80°C. For artificial infection of fleas, Y. pestis CO96-3188 was grown in HIB and incubated at 28°C overnight for 14–16 h with shaking at 175 rpm.
Infection of fleas
Colony-reared, O. montana, the California ground squirrel flea, were obtained from the Centers for Disease Control and Prevention (CDC)/Division of Vector-Borne Diseases (DVBD) for artificial infection with Y. pestis and for transmission feeds on 6- to 8-week-old naïve, female Charles River (Charles River Laboratories International, Inc., Wilmington, MA) CD-1 outbred mice obtained from the specific pathogen-free mouse colony maintained by the DVBD (Fort Collins, CO).
The artificial feeding procedure used to feed O. montana fleas an infected blood meal was performed as previously described (Eisen et al. 2006). Briefly, O. montana male and female adult fleas were randomly collected and removed from an established colony and starved for 4 days at 23°C. An overnight culture of CO96-3188 was prepared by inoculating 60 mL of HIB with a 0.5-mL aliquot of bacterial glycerol stock and grown as described above. Bacteria were pelleted by centrifugation and resuspended in 40 mL of defibrinated Sprague-Dawley strain rat blood (Bioreclamation, Jericho, NY) prewarmed to 37°C. Artificial feeders, each containing approximately 200 O. montana fleas, were prepared according to Eisen et al. (2006), and fleas were allowed to feed for 1 h through mouse skins taken from euthanized, hairless SKH-1 mice (specific pathogen-free mouse colony maintained by the DVBD, Fort Collins, CO) on blood infected with 108–109 colony-forming unites (CFU) mL−1 of Y. pestis CO96-3188. Three independent artificial infections of O. montana fleas were performed for each temperature. Fleas were then examined by light microscopy to determine whether fleas had consumed a potentially infectious blood meal. Fed fleas were collected and maintained in 25-cm2 tissue culture flasks (Corning, Lowell, MA) at their respective treatment temperature (6°C, 10°C, 15°C, or 23°C) and held in acrylic desiccation chambers (Thermo Scientific, Rockford, IL) containing beakers of saturated potassium chloride (KCl) solution to maintain relative humidity at 80–85%. Fleas that did not feed on the infected blood were discarded.
Flea-borne transmission to naÏve mice
Transmission feeds were performed on days 1–4, 7, 10, 14, 17, and 21 p.i. using fleas maintained at each temperature to determine the relative efficiencies of transmission of low-temperature fleas compared to those maintained at 23°C. Capsules were affixed to seven 6- to 8-week-old, naïve, specific pathogen-free, CD-1, outbred mice (CDC, DVBD mouse colony, Fort Collins, CO), and pools of ∼15 potentially infectious fleas were allowed to feed for 1 h (Eisen et al. 2006). Fleas were then collected and viewed by light microscopy to determine fed status as well as the sex of each flea in the pool. Fleas were stored individually in microcentrifuge tubes and placed at −80°C for later analysis to determine infection prevalence and bacterial loads. Exposed mice were held in individually ventilated cages (Tecniplast, Philadelphia, PA) at 27°C and monitored for signs of infection (e.g., ruffled fur, lethargy, hunched posture, slow response to stimuli). At the first sign of illness, mice were euthanized and later necropsied to detect Y. pestis infection by performing Y. pestis anti-F1 antigen direct fluorescent antibody (DFA) assays on liver and spleen smears. Positive transmission events were confirmed by specific bacteriophage lysis of bacterial colonies isolated from mouse tissues (Chu 2000). Although subjective in nature, monitoring for distinct signs of illness in exposed mice correlated well with the presence of Y. pestis organisms in mouse tissues following euthanasia and necropsy. There were no instances in which mice were euthanized and Y. pestis bacteria were not recovered. Time to death or time to euthanasia for individual mice for each time point and temperature also was recorded. Mice showing no signs of infection were held for up to 21 days p.i. before being euthanized. Animal procedures used in this study were approved by the CDC, DVBD, Institutional Animal Care and Use Committee (Protocol #09-020).
In vitro bacterial viability curve
A 0.5-mL aliquot of frozen glycerol stock of strain CO96-3188 was used to inoculate 3 mL of HIB and grown for 16 h at 28°C and 175 rpm. Overnight cultures were diluted 1:50 into 15 mL of fresh HIB to achieve a bacterial concentration of ∼1×10⁷ CFU mL−1
Flea infection prevalence and bacterial loads
Fleas were homogenized in 100 μL of HIB+10% glycerol using sterile Teflon pestles and plated on SBA medium to determine infection status. The number of artificially fed fleas that were both infected and uninfected and that fed on naïve mice were used in determining the infection prevalence of fleas at each time point and incubation temperature. Bacterial loads of Y. pestis-infected fleas were estimated by decimally diluting individual flea lysates and plating on SBA medium in duplicate. Per flea bacterial load estimates were used in calculating the median bacterial burden of fleas at each time point and temperature as well as computing the average of the log-transformed sum of bacteria within groups of fleas that fed on naïve mice at each time point and temperature (average log sum, described below).
Statistical analyses
Maximum likelihood estimates for percent per flea transmission rates were calculated by using the Microsoft Excel Add-In PooledInfRate v. 4.0 (Biggerstaff 2005) for each time point at each temperature. Estimates were based on the number of infected fleas that were also determined to have fed on an individual mouse and whether subsequent transmission occurred in that mouse. Pooled percent per flea infection rates were also used to analyze the effect of day p.i. as well as temperature on transmission by using a pooled binomial regression algorithm in R (binGroup package, the Comprehensive R Archive Network (CRAN),
Pooled percent per flea transmission rates for each temperature, total mouse transmission rates for each temperature, and bacterial viability curve analysis by temperature, time point, and bacterial counts were compared using one-way analysis of variance (ANOVA). The average log sum values of bacterial CFU of infected, fed fleas at each time point were compared between temperatures using one-way ANOVA with a Dunnett post hoc control test. Log sum data comprise the log-transformed sum of the bacterial loads of all infected fleas that fed on an individual naïve mouse for a particular time point and temperature. Log sum calculations were determined for each group of fleas that fed on mice within a cohort (7 mice) for each time point at a particular treatment temperature. The bacterial log sum value to which each individual mouse within a cohort was exposed were then averaged to obtain a single log sum value at each time point for all 4 temperatures. These averaged log sum values were then used in further statistical analyses. Differences among or between groups were considered statistically significant at p<0.05. Contingency table analysis was also performed to determine differences in transmission efficiencies for each temperature, and day p.i. Wilcoxon/Kruskal–Wallis tests (rank sums) were used to establish the significance of incubation temperature on (1) in vitro bacterial viability, (2) average bacterial log sum data, (3) pooled percent per flea transmission rate, (4) mouse infection rate, and (5) median flea bacterial loads. All statistical comparisons were performed using JMP statistical software (SAS Institute, Cary, NC).
Results
Effects of temperature on flea transmission efficiencies
Y. pestis transmission was observed on each challenge day p.i. using fleas maintained at each of the 3 low temperatures tested (6°C, 10°C, and 15°C), whereas no transmission was observed on days 3 and 4 p.i. from fleas held at ambient temperature (i.e., 23°C) (Table 1). With the exception of results for the in vitro bacterial viability curve (see below), all references to temperatures and numerical notations for specific temperatures (e.g., 10°C) refer to the maintenance temperatures of infected fleas and not to temperatures at which mice were exposed. All mice used in this study were held at a constant temperature of 27°C. Percent per flea transmission efficiencies, which estimate the number of infected fleas that were also determined to have fed on an individual mouse and whether subsequent transmission occurred in that mouse, were highest at 10°C. The lowest percent per flea transmission efficiency (1.02%) was exhibited at day 1 p.i. for 10°C, with transmission efficiency for the remaining 8 time points ranging from 5.55% to 13.09%, with day 17 p.i. showing the highest observed percent per flea transmission efficiency (Table 1). Similarly, percent per flea transmission efficiencies were observed at 15°C ranged from 1.12% to 15.05%, excluding days 10, 14, and 17, which showed percent per flea transmission efficiency estimated at 100%. Percent per flea transmission efficiencies at 6°C ranged from 0.96% to 7.52% with successful transmission events observed on each challenge day (Table 1).
When all pools are positive, likelihood methods cannot be calculated. Likelihood estimates therefore do not exist in this case, indicated as N/A for these quantities.
p.i., postinfection; CI, confidence interval.
Surprisingly, the lowest overall percent per flea transmission efficiencies were observed at 23°C, the temperature at which most previous transmission studies for O. montana has been performed (Burroughs 1947, Eisen et al. 2006, Eisen et al. 2007a). In the current study, percent per flea transmission efficiencies ranged from 0.00% to 3.45%, in which no successful transmission events were observed on days 3 and 4 p.i. (Table 1). Pooled percent per flea transmission rates, incorporating all days p.i., were 4.11 (95% confidence interval [CI] 2.83–5.84), 8.67 (95% CI 6.43–11.65), 7.87 (95% CI 5.82–10.58), and 1.94 (95% CI 1.16–3.09) for 6°C, 10°C, 15°C, and 23°C, respectively. By pairwise comparisons, significant differences in pooled percent per flea transmission rates were observed between temperatures, 6°C and 10°C (p=0.0170), 10°C and 23°C (p=0.0022), and 15°C and 23°C (p=0.0136) (Fig. 1). Pooled binomial logistic regression analysis by temperature incorporating simultaneous 95% CIs for each time point also demonstrated significant differences between 6°C and 10°C, 10°C and 23°C, and 15°C and 23°C (p<0.05). Logistic regression analysis by day p.i. showed no significant differences in pooled percent per flea transmission rate with the exception of day 1 versus day 14 p.i. (p<0.05). Overall, the data reflect that pooled percent per flea infection rate was influenced by temperature (χ2=13.69, degrees of freedom [df]=3, p=0.0034).
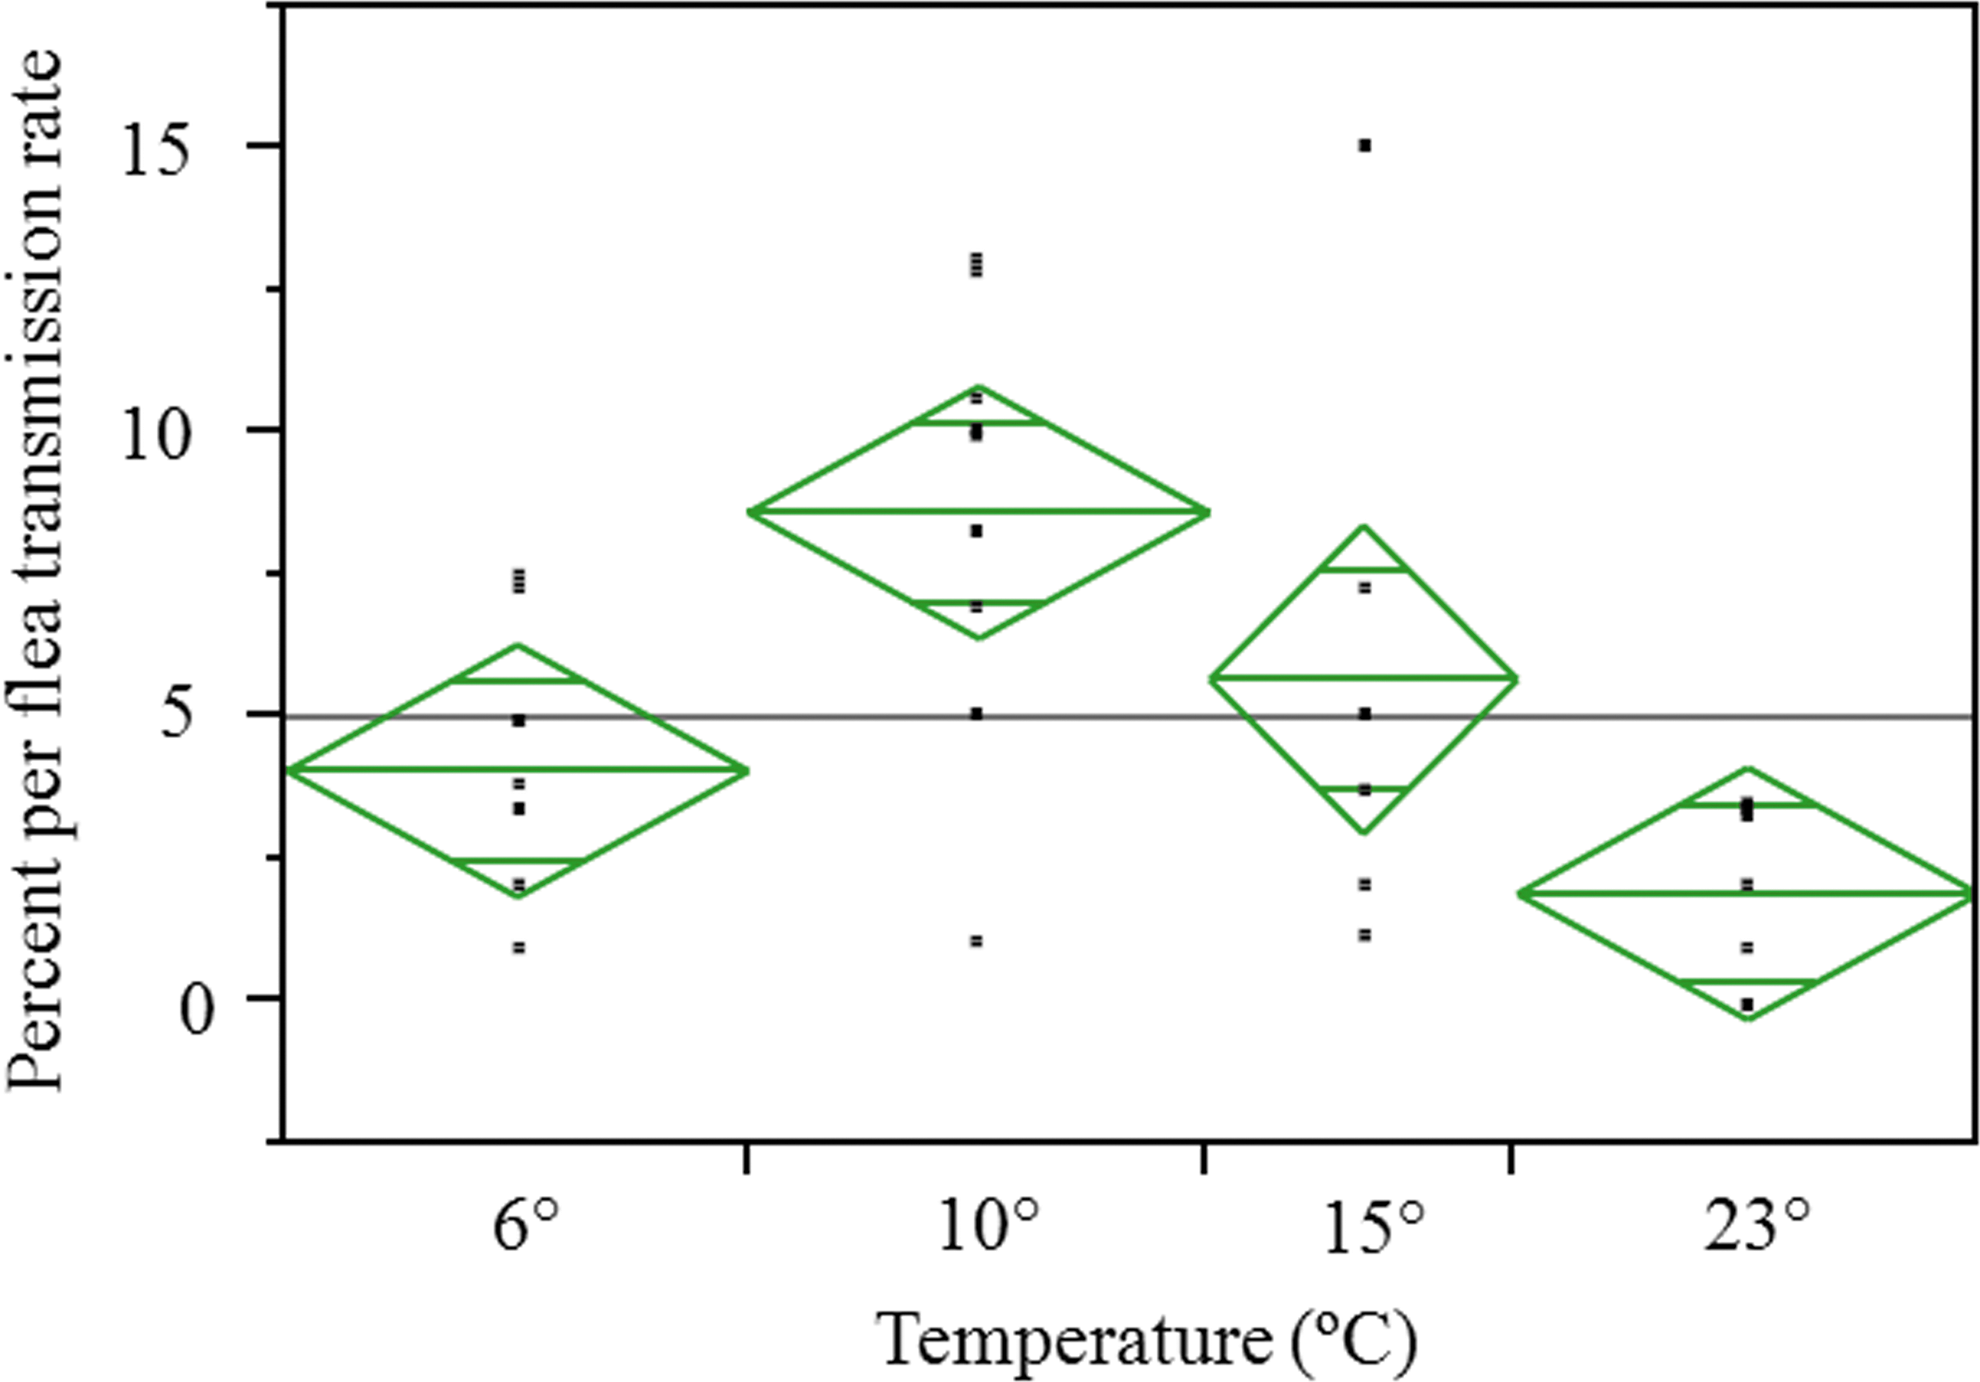
A one-way analysis of variance (ANOVA) analysis comparing pooled percent per flea transmission rates by temperature and including all experimental time points (represented by closed squares). Means are indicated by the center horizontal lines within each rhombus and parallel lines above and below the means denote the 95% confidence intervals (CI). The horizontal line extending from the y axis to the right margin of the graph is the mean of response across all temperatures. The mean pooled percent per flea transmission rates were: 6°C (4.11; 95% CI 2.83–5.84), at 10°C (8.67; 95% CI 6.43–11.65), 15°C (7.87; 95% CI 5.82–10.58), and 23°C (1.94; 95% CI 1.16–3.09). (Color image is available at
The number of successful transmission events directly correlated with the pooled percent per flea transmission rates. Late-phase time points (days 7–21 p.i.) showed the highest rates of transmission, with days 10, 14, and 17 p.i. showing 100% transmission in all 7 mice challenged at 15°C (Table 1). Consistent with the 10°C percent per flea transmission efficiencies being the highest, the number of total transmission events that occurred at this temperature was also found to be the highest, with 46 out of the 63 (71.4%) mice exposed succumbing to infection by Y. pestis (Table 1). Transmission events for days p.i. 2–21, ranged from 57.1% to 85.7%, with only a single successful transmission occurring on day 1 p.i. for 10°C fleas. Transmission events at 15°C were also successful at each of the 9 time points, with the fewest number of events observed on day 4 and 100% transmission occurring on days 10, 14, and 17 p.i. (Table 1). Transmission rates to naïve mice ranged from 14.3% to 100% for fleas maintained at this temperature. For Y. pestis-infected fleas maintained at 6°C, 46.0% (29 of 63) of naïve mice challenged successfully became infected and died, with each time point having successful transmission events (range, 14.3–71.4%). The lowest number of transmission events occurred at 23°C on days 3 and 4 with no successful transmission, and overall, only 25.4% (16 of 63) of mice exposed to fleas at this temperature resulted in mortal infection by the pathogen (range, 0–42.9%) (Fig. 2).
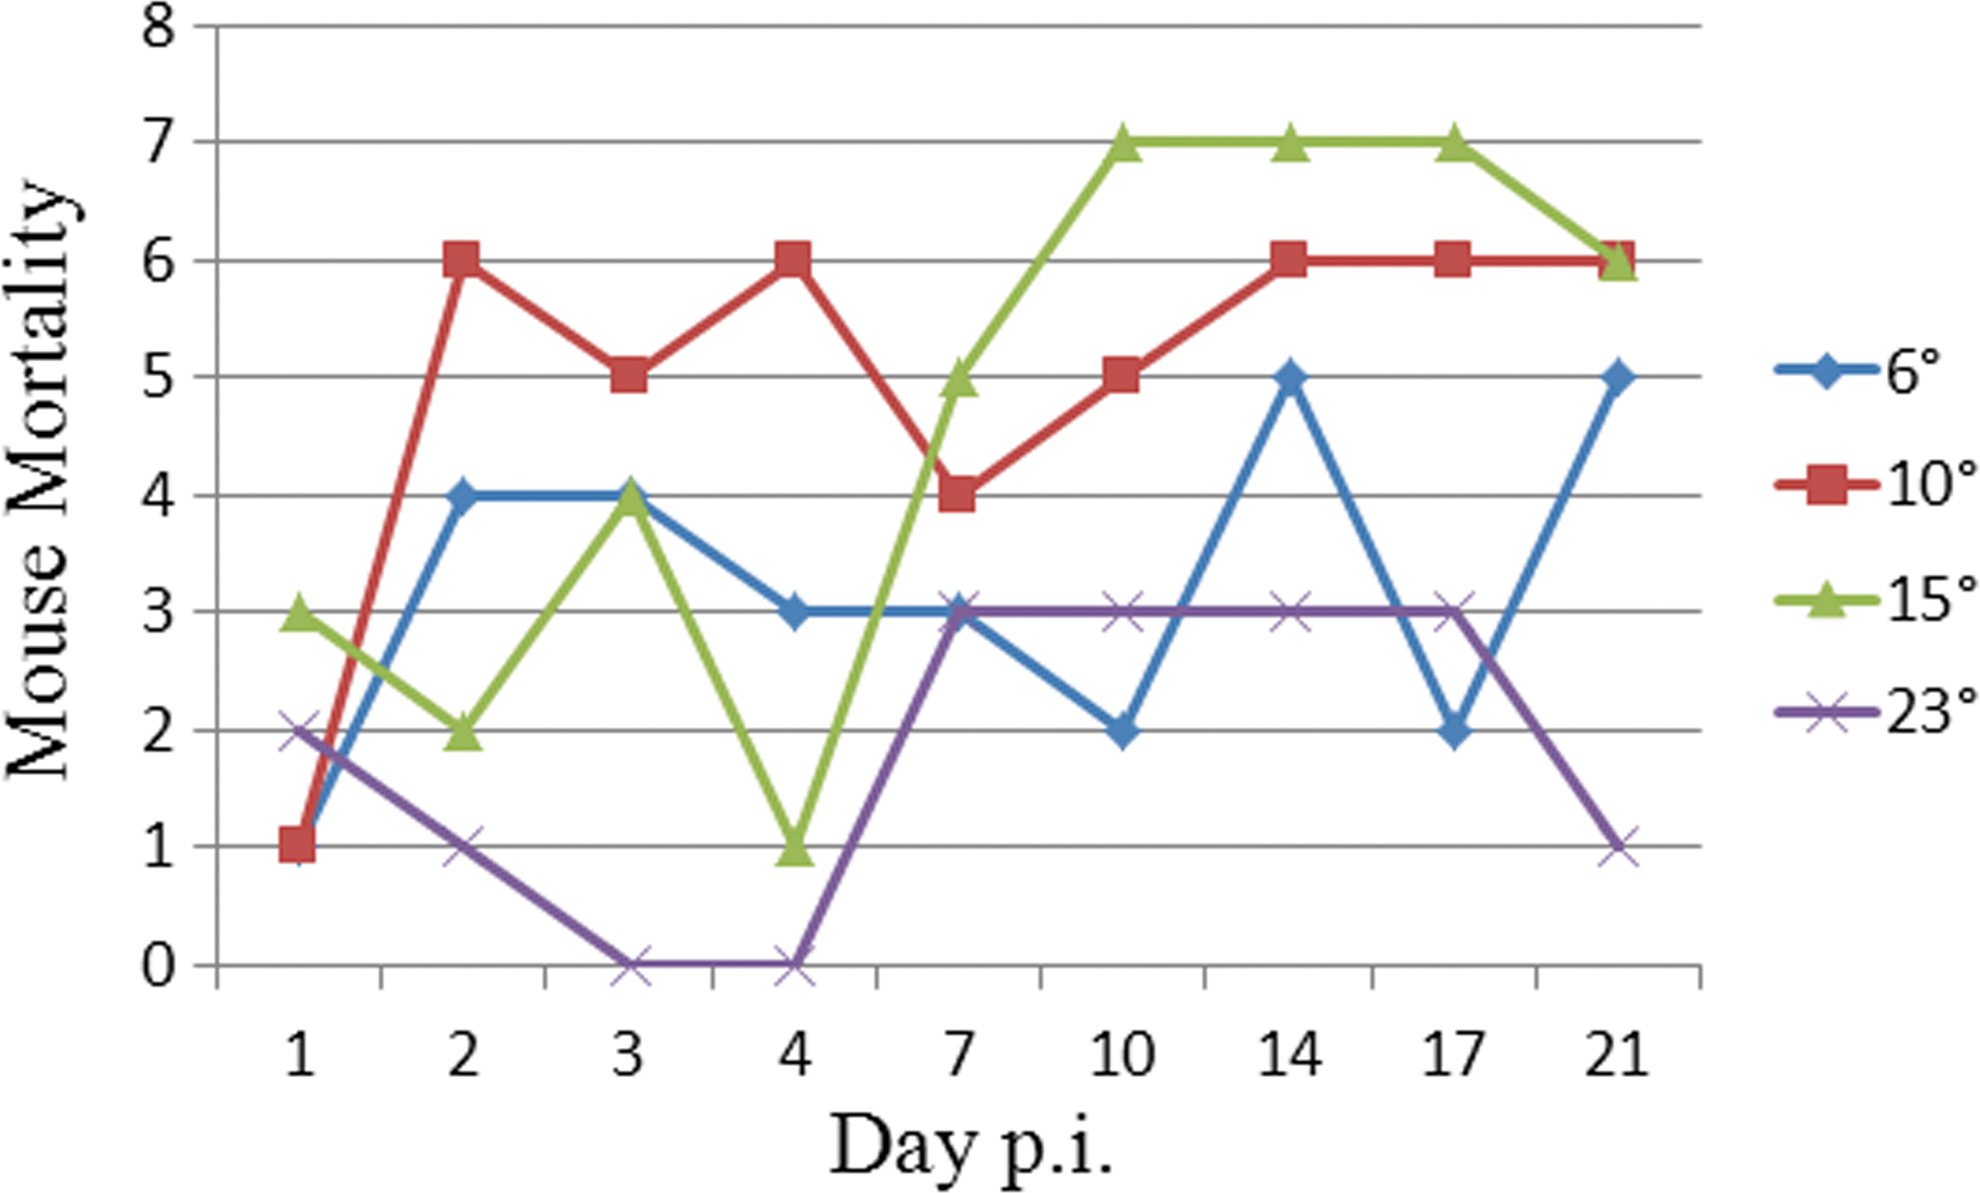
Graph showing the number of mice that succumbed to Y. pestis infection, or were euthanized and confirmed to be infected by Y. pestis by bacteriophage lysis of culture isolates from mouse tissues, for each temperature and day postinfection (p.i.). The x axis denotes days on which naïve mice (7 mice were used for each time point and temperature) were exposed to infected fleas (infected fleas were obtained from three independent artificial infections for each temperature) and the y axis indicates mouse mortality (dead or euthanized mice). (Color image is available at
Flea maintenance temperature was a significant factor in mouse mortality (χ2=13.52, df=3, p=0.0036). Similar to pairwise comparisons for pooled percent per flea transmission, statistical significance in the number of successful transmission events were found between 6°C versus 10°C (p=0.0343), 10°C versus 23°C (p=0.0003), and 15°C versus 23°C (p=0.011) (Fig. 2). Moreover, binomial logistic regression analysis revealed flea maintenance temperature and day p.i. to be significant predictors of the rate of mouse infection. Specifically, as day p.i. increased, the probability of a successful transmission event occurring also increased (all p values<0.05).
Effects of temperature on Y. pestis bacterial loads in fleas
Individually homogenized infected fleas maintained at each of the 4 temperatures that fed on exposed naïve mice were quantified to determine infection prevalences and bacterial loads. Although more female than male fleas were used in our study, no significant differences were found between male and female fleas with regard to feeding rate and infection prevalence, and thus sex of the flea was not used as a criterion in our study. Overall, flea infection prevalences for each of the 4 temperatures tested and on each day p.i. ranged from 93.8% to 100%. The average number of fleas feeding on each of 7 mice per time point and temperature (Table 1) yielded a range of 13.1–15.1 fed fleas per naïve mouse. No significant differences in the number of infected fleas that successfully took a blood meal from naïve mice were shown on any of the challenge days or among temperatures (Table 1). When quantifying bacterial loads for each infected, fed flea, a significant difference was found between fleas maintained at 6°C, (2.45×10⁶ median CFU per flea, averaged for each time point), when compared to fleas maintained at 10°C (1.03×10⁶ median CFU per flea, averaged for each time point) (p=0.0181), 15°C (5.96×10⁵ median CFU per flea, averaged for each time point) (p=0.0026), and 23°C (1.61×10⁴ median CFU per flea, averaged for each time point) (p=0.0002) (Fig. 3). While fleas maintained at 23°C were found to harbor the lowest median number of bacteria, comparisons to average median bacterial loads for 10°C and 15°C were not statistically significant (p=0.0832 and p=0.3159, respectively) (Fig. 3). However, our results indicate that temperature is an influential factor on median bacterial loads (χ2=23.31, df=3, p<0.0001).

Histogram comparing median Y. pestis colony-forming units (CFU) per flea (y axis) for temperatures 6°C, 10°C, 15°C, and 23°C and across all experimental time points denoted as days post infection (p.i.) (x axis). Sets of bars for each day p.i. represent the average of the median CFU per infected, fed fleas for all temperatures at that time point.
To determine whether the total number of CFU calculated from all fleas within a cohort that were infected and fed on an individual naïve mouse, we employed average log sum data as a means to evaluate whether or not this parameter was affected by incubation temperature of the flea. Pairwise comparisons of average log sum CFU per temperature and incorporating all time points show that values for fleas maintained at 6°C were significantly higher than those for 10°C (p=0.0231), 15°C (p=0.0071), and 23°C (p<0.0001) (Fig. 4). Moreover, average log sum values at 23°C were also significantly less than the determined values for 10°C (p<0.0001) and 15°C (p<0.0001) (Fig. 4). Overall, temperature proved to be a significant factor with respect to log sum values (χ2=22.06, df=3, p<0.0001).
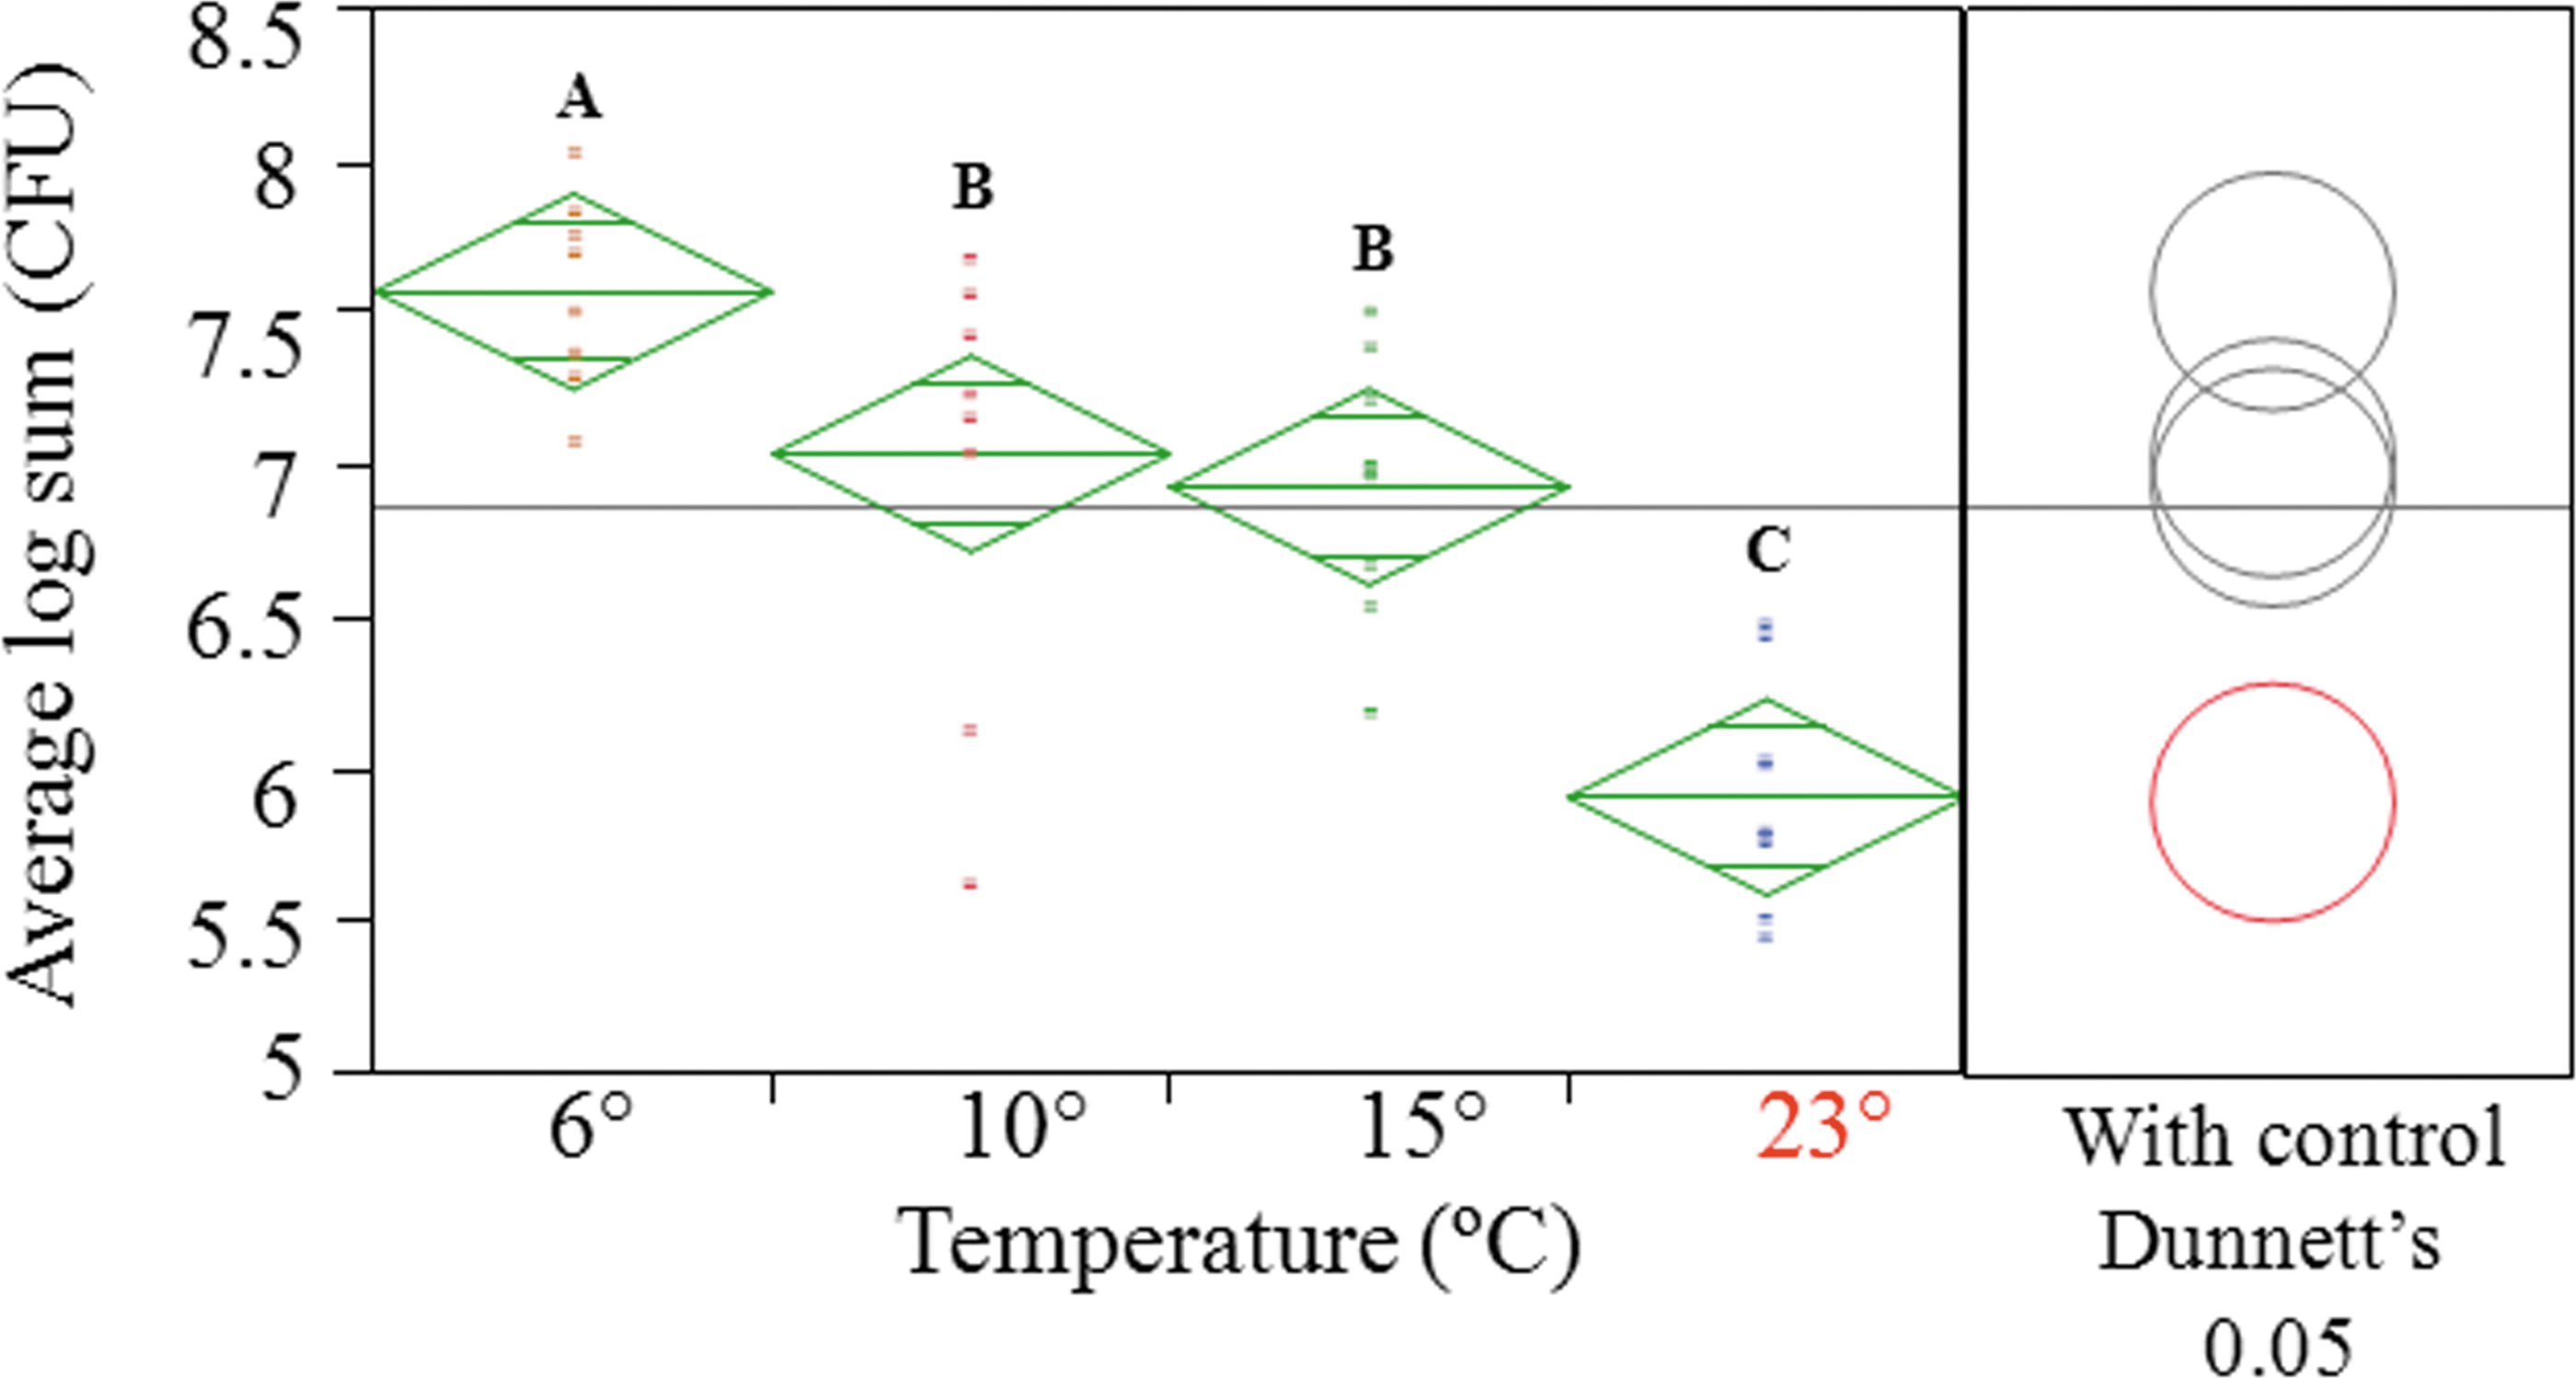
A one-way analysis of variance (ANOVA) analysis (left panel) with a Dunnett post hoc control test (right panel) comparing the average logs sum colony-forming units (CFUs) (y axis) of infected, fed fleas maintained at each temperature (x axis) incorporating all time points. Diamonds not connected by the same letter are significantly different. Means are indicated by the center horizontal lines within each rhombus, and parallel lines above and below the means denote the 95% confidence intervals (CI). The horizontal line extending from the y axis to the right margin of the graph is the mean of response across all temperatures. The Dunnett post hoc control test (right panel) shows a significant difference between all 3 lower temperatures when compared to the control temperature (23°C), which is represented by the bottom circle in the right panel. (Color image is available at
In vitro bacterial viability curve
On the basis of observations of in vivo growth of Y. pestis within fleas at 6°C, 10°C, 15°C, and 23°C, and the patterns revealed in the results for median bacterial loads and log sum values, we chose to examine growth and viability of Y. pestis in vitro at the same temperatures. A 5-day growth curve analysis measuring bacterial cell viability showed statistically higher peak growth at temperatures 10°C and 15°C when compared to 6°C (p=0.0121 and p=0.0099, respectively) and 23°C (p=0.0075 and p=0.0060, respectively) (Fig. 5). Static growth (without aeration) at 6°C appears to be more linear and approaching stationary phase at the end of the 5-day sampling period, whereas 23°C had achieved peak growth by 24 h. Although pairwise comparison of results by temperature indicate that Y. pestis grows more favorably in vitro at 10°C and 15°C when compared to 6°C and 23°C, a comparison of all temperatures incorporating all time points showed no statistical significance in overall growth of Y. pestis (χ2=7.68, df=3, p<0.0531) (Fig. 5). Moreover, in vitro growth at 6°C does not appear to mimic in vivo bacterial loads as shown in Figures 3 and 4; however, the comparative trend of higher peak growth of Y. pestis at lower temperatures remains consistent when compared to growth at 23°C.
In vitro static growth of Y. pestis CO96-3188 over 5 days at different temperatures. Viable bacterial counts depicted as colony-forming unties (CFU)/mL (y axis) for a period of growth ranging from 0 h to 120 h (x axis) were determined by plating in duplicate from 2 independent experiments. Error bars for each sampling time point represent the standard deviation of 2 independent experiments. Pairwise significant differences for mean growth between temperatures and inclusive for all time points were observed between 6°C and 10°C (p=0.0121), 6°C and 15°C (p=0.0099), 10°C and 23°C (p=0.0075), and 15°C and 23°C (p=0.0060).
Discussion
Historically, it has been shown that increases in the mean monthly ambient temperature above 27.5°C result in declines in epizootic and human plague activity (Pollitzer 1954, Cavanaugh 1971, Cavanaugh and Marshall 1972, Enscore et al. 2002, Collinge et al. 2005, Brown et al. 2010). These declines in transmission are thought to be associated with reductions in flea blockage or loss of infection (Kartman and Prince 1956, Kartman 1969, Hinnebusch et al. 1998) however, Schotthoefer et al. recently demonstrated Y. pestis transmission by the flea X. cheopis at temperatures as high as 30°C during the early-phase transmission period (days 1–4 p.i.) (Schotthoefer et al. 2011b), as well as during late-phase (days 7–28 p.i.) (Schotthoefer et al. 2011a), suggesting that other factors, such as threshold host or flea densities, could also be involved.
Similar studies have not been performed at low temperatures. The aim of the current study was to examine the effect of low-temperature incubation of O. montana (formerly D. montanus) fleas on transmission during both early- and late-phase periods. Kartman et al. (1969) demonstrated survival and transmission of X. cheopis at 8.5°C; however, these fleas were held until blockage was observed, which was beyond the extrinsic incubation period of the fleas held in the current study. We used O. montana, a temperate flea that rarely blocks (Burroughs 1947, Engelthaler and Gage 2000), to demonstrate transmission during early- and late-phase periods at subambient temperatures. Our data clearly demonstrate that efficient flea-borne transmission of Y. pestis does occur at low temperature during both early- and late-phase periods and is particularly robust at 10°C and 15°C.
Although the data do not provide a specific explanation for greater transmission as measured by mouse mortality from infected fleas held at subambient temperatures relative to 23°C, reasons for this may include higher median bacterial loads and bacterial log sum values of flea groups held at the lower temperatures that fed on individual mice (Figs. 3 and 4, respectively). Although overall transmission events from infected fleas held at 23°C were significantly lower than fleas held at 10°C and 15°C and differ substantially during EPT from data reported by others using O. montana (Eisen et al. 2006), our study used CD-1 outbred mice, which may have slightly different susceptibility characteristics. Moreover, Eisen et al. (2006) used only female fleas for transmission experiments. Additionally, bacterial load and log sum data were significantly lower at 23°C in the current study. Furthermore, EPT studies by Vetter et al. (2010) using O. montana fleas and biofilm biosynthetic mutants also showed reduced mouse mortality numbers during these time points, including 1 EPT p.i. time point in which no transmission was observed (Vetter et al. 2010).
Percent per flea transmission efficiency data (Table 1 and Fig. 1), a maximum likelihood estimate of transmission by infected fleas that also fed on a naïve mouse, clearly indicate the significance of low-temperature incubation in promoting flea-borne transmission. Pooled percent per flea transmission efficiencies were highest at 10°C and 15°C. Additionally, binomial logistic regression analysis also showed an increased probability of flea-borne transmission over time, particularly at 10°C and 15°C. Schotthoefer et al. demonstrated transmission in X. cheopis fleas held at 10°C up to 14 days p.i. (Schotthoefer et al. 2011a), although these fleas showed much lower survivability than was observed in our study for O. montana fleas held at the same temperature at 14 days p.i. (data not shown). Because ground squirrel burrow temperatures of 15°C have been described previously (Baudinette 1972), it is possible that temperatures of 10–15°C represent burrow conditions that are optimal for both bacterial growth and transmission potential by O. montana or the fleas of other burrow-dwelling rodent hosts of plague.
Changes in lipopolysaccharide (LPS) structure for Y. pestis at lower temperatures may provide an alternative explanation to explain enhanced transmission at low temperatures by O. montana fleas (Anisimov et al. 2005, Han et al. 2005, Knirel et al. 2005a, Knirel et al. 2005b). These changes may be more conducive to survival, growth, and transmission potential for Y. pestis within the flea, although Suomalainen et al. (2010) recently reported a dramatic reduction in LPS-dependent plasminogen activation by the Pla surface protease as a result of temperature-induced (20°C) changes in the LPS of Y. pestis (Suomalainen et al. 2010), from which one might conclude that dissemination of Y. pestis may be delayed and flea-borne transmission impaired at temperatures even lower than 20°C. However, results of the current study suggest that the reduction in Pla protease activity is only transient because transmission of Y. pestis by O. montana fleas maintained at 10°C and 15°C is significantly higher than at the other study temperatures and no significant differences were observed in mean time to death among transmission events across all temperatures (data not shown), It should also be noted that LPS biosynthesis by an alternative pathway has been suggested for Y. pestis grown at 6°C resulting in a novel LPS structure (Knirel et al. 2005a). It would be of interest to know whether this novel Y. pestis LPS structure interacts with the Pla protease or fosters enhanced resistance to antimicrobial factors in the flea gut, although very little is known about immunity in fleas.
Due to significantly greater bacterial growth within the flea gut at lower temperatures (Figs. 3 and 4), it may be likely that up-regulation of bacterial factors that contribute to growth and survival occurs at subambient temperatures. Although a direct comparison cannot be made due to presumed differences in the growth environments of HIB medium and the flea midgut, it is interesting to note that the in vitro static growth characteristics of Y. pestis at different temperatures showed peak growth at lower temperatures similar to the growth kinetic patterns observed in vivo. Conversely, physiological changes within the flea may favor maintenance and growth of the plague bacilli. Moreover, factors that contribute to resistance to infection or elimination of Y. pestis within the flea may be downregulated or altered in function at lower temperatures. In a recent study, genes identified as being involved in the production of reactive oxygen species in response to Y. pestis infection in X. cheopis fleas (Zhou et al. 2012) may be less active or nonfunctional at lower temperatures. Toxic degradation products derived from the flea blood meal and from which Y. pestis is thought to be protected via expression of ymt, encoding a phospholipase D required for survival of Y. pestis in the flea, may be less abundant in fleas maintained at low temperatures, thus reducing exposure of Y. pestis to these compounds (Hinnebusch et al. 1998). Moreover, likely induction of the cold shock protein stimulon (Han et al. 2005) may act as a global regulatory mechanism for factors that enhance the growth and survival of Y. pestis within the flea at low temperatures. These factors will require further investigation, and planned studies involving transcriptomic analysis of Y. pestis-infected O. montana may reveal additional factors that contribute to enhanced growth and survival.
Increased growth and survivability of Y. pestis in the flea gut at low temperature may contribute to the transmissibility of overwintering fleas, particularly in burrow-dwelling fleas such as O. montana. Overwintering of Y. pestis infection in fleas has been reported previously for various species of fleas, including ground squirrel fleas (Golov and Ioff 1925, Evseeva and Firsov 1932, Kartman et al. 1962, Baltazard et al. 1963, Bazanova and Maevskii 1996, Bazanova et al. 2007, Bizanov and Dobrokhotova 2007). O. montana or other fleas overwintering as infectious fleas in burrows may transmit to hibernating hosts or hosts in late winter and early spring. Because low-temperature incubation of infected fleas enhances the growth of Y. pestis (Figs. 3 and 4), it would be of interest to know whether these conditions also promote partial or complete blockage and/or enhanced biofilm production within O. montana, a flea that rarely blocks at temperatures and time periods used in earlier studies (Burroughs 1947, Engelthaler and Gage 2000). Additional experiments, beyond the scope of the current study, will employ reporter strains of Y. pestis to localize the bacteria within the flea gut. Biofilm biosynthetic mutants will be used to determine the contribution of exopolysaccharide production in the growth and survival of Y. pestis within the flea at low temperatures. The results of the current study have significant implications for the utility of fleas as reservoirs for plague from one season to the next as well as the focality of plague in global endemic foci, including those in tropical regions that occur at higher elevations and experience cooler temperatures. This is particularly true in the East African countries of Uganda and Tanzania where elevated plague risk is associated with vegetation and higher elevation, the latter being a factor in predictably cooler temperatures (Eisen and Gage 2012).
Footnotes
Acknowledgments
The authors wish to acknowledge the staff of the Diagnostic and Reference Activity, Bacterial Diseases Branch as well as the assistance of Animal Resources Branch, Division of Vector-Borne Diseases, Centers for Disease Control and Prevention, Fort Collins, CO, for their outstanding technical expertise. The authors also acknowledge the invaluable contributions of statisticians Brad Biggerstaff and Kalenthe Horiuchi.
Author Disclosure Statement
No competing financial interests exist.