
Abstract
Background:
Tularemia, caused by a Gram-negative bacterium Francisella tularensis, is an occasional disease of cats in the midwestern United States and a public health concern due to its zoonotic potential. Different environmental, climatic, and pet-owner's housing and socioeconomic conditions were evaluated as potential risk factors for feline tularemia using Geographic Information Systems (GIS) in a retrospective case–control study.
Methods:
The study included 46 cases identified as positive for tularemia based upon positive immunohistochemistry, isolation of F. tularensis using bacterial culture, and 4-fold or greater change in serum antibody titer for F. tularensis. Cats with a history of fever, malaise, icterus, and anorexia but no lesions characteristic of tularemia and/or negative immunohistochemistry, no isolation of bacteria in bacterial culture, and less than 4-fold raise in serum antibody titer for F. tularensis were treated as controls (n=93). Candidate geospatial variables from multiple thematic sources were analyzed for association with case status. Variables from National Land Cover Dataset, Soil Survey Geographic Database, US Census Bureau, and Daymet were extracted surrounding geocoded case–control household locations. Univariable screening of candidate variables followed by stepwise multivariable logistic modeling and odds ratios were used to identify strengths of variable associations and risk factors.
Results:
Living in a residence located in newly urbanized/suburban areas, residences surrounded by areas dominated by grassland vegetation, and mean vapor pressure conditions recorded during the 8th week prior to case arrival at the hospital are significant risk factors for feline tularemia.
Conclusions:
Prevention strategies such as acaricide applications in residential backyards during spring and early summer periods and any behavior modifications suitable for cats that will prevent them from contracting infection from ticks or dead animals are necessary. Mean vapor pressure conditions recorded during the 8th week prior to case arrival at a diagnostic facility is a predictor for feline tularemia.
Introduction
Multiple factors could affect the survival and transmission of F. tularensis in the environment and as well as the outcomes of tularemia in humans and cats. The role of physical environmental characteristics, such as dry forests (Eisen et al. 2008), and the potential for different climatic influences (Brown et al. 2011, Clark et al. 2012) on human tularemia have been documented. It is highly likely for the same or similar factors to play an influential role in tularemia outcomes in pet cats as well. Trends related to increased climatic variability and intensity (Karl et al. 2009) due to global climate change are a concern because these factors could exacerbate vector-borne disease outbreaks by affecting a vector's life cycle and improve opportunities for pathogen survival and transmission (Githeko et al. 2000, Patz et al. 2005). Changing climatic trends may increase the likelihood that F. tularensis will impact new geographic locations (Nakazawa et al. 2008).
In addition to the effects of various environmental and climatic factors, studies show that pet owner settlement patterns, for instance, urban versus rural residential location, proximity to periurban forest/farmland, and also some socioeconomic conditions, may play a role in the prevalence of different zoonotic diseases (for, e.g., Raghavan et al. 2011, Raghavan et al., 2012). This may be particularly true in cases of vector-borne diseases such as tularemia, which involve pet animals who share most of their living conditions with their owners. Studies investigating pet owner socioeconomic, housing, and demographic effects for human or feline tularemia cannot be easily found. An evaluation of risk factors for feline tularemia from multiple spheres of influence, viz., environmental, climatic, and socioeconomic domains, has the potential to help recognize not only the individual effects of such factors but also to allow developing appropriate hypotheses as to how these factors may interact with each other in the mechanisms of a disease. Furthermore, identifying key areas for focused prevention/management strategies based on the knowledge of identified risk factors becomes possible. Much of the information needed for this type of assessment is fairly readily available in the public domain in digital forms of remotely sensed geospatial data and census information. Geographic Information Systems (GIS) can be used to model and analyze disease outcomes in relation to such geospatial data layers containing potential influential factors.
The purpose of this study was to evaluate the role of different physical environmental factors, past climatic effects, and pet owner socioeconomic conditions on tularemia outcomes in cats that were submitted to a diagnostic laboratory.
Materials and Methods
Case selection
All cats submitted to the Kansas State Veterinary Diagnostic Laboratory (KSVDL) that exhibited gross lesions characteristic of tularemia on examination were selected as candidates for histopathologic tissue verification for tularemia by board-certified pathologists, and preliminary tests were conducted using immunohistochemistry (DeBey et al. 2002) and bacterial culture on chocolate agar. Regardless of the outcome, tissue samples were submitted to the Centers for Disease Control and Prevention (CDC), Fort Collins, CO, where confirmatory tests were done. These tests were based on isolation of F. tularensis in tissues and/or 4-fold or greater change in serum antibody titer to F. tularensis antigen (Centers for Disease Control and Prevention 2012). Feline cases that exhibited symptoms indicative of tularemia, viz., fever, malaise, icterus, and anorexia, but did not exhibit lesions characteristic of tularemia (n=82), and that were negative for immunohistochemistry testing and/or bacterial culture (n=30) were treated in this study as controls.
Host factors
Cats were grouped based on their age (<1 year, 1–3 years, 3–5 years, >5 years), sex (male, female, unknown), and breed (indoor, outdoor, unknown) categories.
Time of case arrival
Cases and controls received at the KSVDL were grouped on the basis of the season at which they arrived at the diagnostic facility into 4 categories—fall (September–November), winter (December–Feburary), spring (March–May), and summer (June–August).
Geocoding
Street-level addresses, including house number, street, city, state, and zip code, were provided to us by clients at the time of case submissions. These addresses were geocoded in ArcGIS 10 using the US Census TIGER 2007 street file. Addresses were verified retrospectively for their accuracy either by using MapQuest (MapQuest, America Online, Denver, CO) or Google Maps (Google Inc., Mountain View, CA) and/or by calling telephone numbers provided by clients. Geographic coordinates for these addresses were derived using a geocoding tool in ArcMap 10.1 software and US Census 2007 TIGER (Topographically Integrated Geographic Encoding and Referencing system) shapefile with street-level address information (US Census Bureau 2012). The geographic coordinates for unmatched addresses (4%) were obtained using Google Earth software (v. 6.2.2.6613) (Google Inc., Mountain View, CA). In all, there were 46 cases (out of 49), and 93 controls (out of 112) for which precise point locations of households could be obtained.
Projection and data storage
All geospatial datasets used in this study were projected (or reprojected from the original coordinate systems) into the USA Contiguous Equal Area Conic Projection to preserve area measurements in the data. This coordinate system is based on the Geographic Coordinate System North American 1983 Geographic Datum. All original, intermediate, and processed geospatial data were stored in a SQL Server/ArcSDE 10 Geodatabase.
Land cover land use
The publicly available 2001 National Land Cover Dataset (NLCD) (MRLC 2012; Homer et al. 2007, Wickham et al. 2010) for the study region was obtained from the United States Geological Survey (USGS) in a raster grid format. Land cover grids surrounding individual case–control locations were extracted from the raster dataset using 2500-meter polygon buffers and converted to polygon area features in ArcMap. The area of different land cover type within individual buffer was divided by the total buffer area to generate percent land cover values. Different land cover classes present in NLCD are shown in Table 1, and the descriptions of different land cover classes can be found from their source websites, the Multi-Resolution Land Characteristics Consortium (MRLC 2013).
Years represent the time period during which satellite images of land cover were captured for creating the dataset, including multiple images within a year. Resolution indicates the fineness of ground data as captured by a satellite image, shorter resolution meaning higher clarity; spatial scale indicates the scale for which interpretations are appropriate.
NLCD, National Land Cover Dataset.
Soil
Different soil types, and soil attribute data pertaining to flooding frequency, ponding frequency, and drainage class of soils surrounding cases and controls were obtained from the State Survey Geographic Database (USDA 2013). Percentage map areas within 2500 meters from case–control locations (total map unit area divided by area of buffer) occupied by different classes of soil types, flood frequency, ponding frequency, and drainage class were estimated in 4 separate steps in ArcGIS. There were 6 variables for soil type, 5 variables for flooding frequency, 4 variables for ponding frequency, and 6 soil drainage class variables. All variables were kept in their original form as categorical variables for soil types and as continuous variables for others measured in percentages.
Presence within newly urbanized, suburban areas
Newly urbanized areas in the major cities in the study region (Manhattan, Wichita, Topeka, Kansas City) were determined by extracting areas in these cities that were newly added in the 2000 census but were not present in 1990 census using ArcGIS. In addition, suburban areas in the major cities in the region were derived by querying subdivisions that were on the outer edges of the city boundary and those subdivisions that were located outside but within 10 km from the city boundaries. City boundary files for the major cities in the study region (Manhattan, Wichita, and Topeka) were obtained from the city governments when available or from the US Census Bureau. Shapefiles representing newly urbanized areas and suburban areas were merged with boundary files using the Merge tool in ArcGIS. Cases and controls that were present within and outside newly urbanized areas were recorded.
Socioeconomic and housing characteristics
US Census 2000 data on population and housing were obtained in the form of Summary File 3 (SF-3) tables from the US Census Bureau (US Census Bureau 2012). Identical census attribute information was gathered at 3 geographic levels or census units at which census data were aggregated by the US Census Bureau—block groups (containing between 600 and 3000 people within a county), census tracts (containing between 1500 and 8000 people intended to represent neighborhoods), and counties. GIS data files for block groups, tracts and counties were obtained from the ESRI Street Map data based on US Census Bureau 2000 census information. From the Summary File-3 (SF-3) tables, 33 housing and 37 population-related variables (Raghavan et al. 2012) were extracted for each census unit by spatial query and joined to the census shapefiles using the common Federal Information Processing Standards (FIPS) codes. Each census category included several independent variables, and they were evaluated separately in the study. The geocoded addresses of cases and controls were overlaid in ArcMap with block group, census tract, and county shapefiles in 3 separate operations, and the number of cases and controls that were within census units were recorded separately using a spatial join procedure in ArcMap.
Climate
Climate data used in this study were derived from Daymet, a collection of algorithms and computer software designed to interpolate and extrapolate daily meteorological observations at weather stations to produce gridded estimates of daily weather parameters (Thornton et al. 1997, Thornton et al. 1999, Thornton et al. 2000). Daymet raster layers were derived from the native NetCDF file format in ArcGIS and were clipped using 2500-meter buffers surrounding case–control locations using the Buffer and Intersect tools. Weekly mean estimates of maximum, minimum temperatures, precipitation, and vapor pressure were derived from independent raster layers representing these climate parameters for up to 4 months prior to the dates on which cases were received at the KSVDL. A representative value for each climatic parameter was derived by averaging weather parameter estimates represented by 1-km2 pixels within 2500 meters surrounding case–control locations.
Data organization and statistical analysis
All census data were originally stored in a Microsoft Access 2010 (Microsoft, Redmond, CA) database and later as ESRI shapefiles during spatial analysis. All numerical data were stored in Microsoft Excel 2010 (Microsoft, Redmond, CA) prior to all statistical analysis conducted in the R Statistical Package 2.11.1 (R Core Development Team 2011) or SAS (SAS Institute Inc., Cary, NC) when specified. During the exploratory spatial analysis of case–control locations in the study region, clustering among cases and controls was evaluated using Cuzick–Edwards Kth neighbor statistic (Cuzick and Edwards 1990) within 3 major cities in the study region, including Manhattan, Wichita, and Topeka from which most cases and controls were reported. Four neighbors were included in the analysis for cluster detection.
The effect of season of arrival at the diagnostic facility (winter season as reference category) and host factors, including age group (<1 year as reference category), sex (female as reference category), and breed (indoor cats as reference category) were analyzed individually by fitting bivariable logistic regressions.
Odds ratios (ORs) and 95% confidence intervals (CI) derived using logistic regressions were used to determine associations of feline tularemia status with independent variables. There were a total of 33 housing-related variables and 37 population-related variables each at block group, census tract, and county levels. Variable screening among all variables was done by fitting univariable logistic models and those variables with a p value≤0.1 were selected for further analysis; however, care was taken not to remove variables that were deemed clinically relevant (Hosmer and Lemeshow 2000). Multicollinearity was tested among screened variables by estimating the variance inflation factor (VIF) using the proc reg/tol vif option in SAS. All variables with a VIF value of 10 or above were considered to indicate multicollinearity (Allison 1999). Observations for all land cover, soil, climate, and census variables were kept in their original measurement units and were continuous. Observations for presence within urban versus rural areas and newly urbanized areas was in categorical format scored as 0 if absent and 1 if present. Interaction terms were not included in the models.
Multivariable logistic models were fit using the stepwise selection procedure (both directions) in which a significance level, p≤0.05 used for a variable to be retained and p≥0.1 to be removed from the model. Logistic models were ranked using Akaike information criterion (AIC), and the model with the lowest AIC value was deemed to be the best-fitting model. Any confounding effect of host factors, age (<1 year old as reference level), sex (female as reference level), and breed (unknown as reference level) was estimated by adding them 1 at a time to the final logistic model, and a 10% or more change in coefficient values of independent variables was considered to indicate confounding due to that particular factor, in which case adjusted ORs and their 95% CIs were recorded. Linearity assumption for logit in final models was assessed using the Box–Tidwell test (Box and Tidwell 1962). Model adequacy was tested using a chi-squared goodness-of-fit test (p<0.05 indicated poor fit), and predictive ability was measured by deriving the area under receiver operating characteristic (ROC) curve value.
Spatial autocorrelation and model assumptions
Spatial autocorrelation, if present in the case–control data, could lead to the violation of underlying logistic regression assumptions (that the samples are independent and identically distributed) and will yield incorrect parameter estimates and error term. If the parameters in the multivariable model did not account for autocorrelation, then the residuals of the model will reveal autocorrelation and need to be verified (Robinson 2000). A Monte Carlo test based on the empirical variogram of residuals and their spatial envelopes (generated by permutations of data values across spatial locations) was used to check for spatial autocorrelation using the geoR library of the R Statistical Package 2.11.1 (Ribeiro and Diggle 2001, Ribeiro et al. 2003).
Results
Descriptive epidemiology
The majority of tularemia cases and controls received at the KSVDL were from Kansas, although fewer of them were from the neighboring states. The case–control distribution within Kansas appeared to mostly occur where human density was high in the central and eastern portions of the state (Fig. 1). Case–control descriptive characteristics are present in Table 2. Cats received during the summer months (June–August) were at highest risk of tularemia than other seasons (OR=3.16, 95% CI 2.20, 4.54), but no host factors were found to be significantly associated with case status. The Cuzik–Edward cluster analysis test indicated no clustering in the 3 major cities in the study region for cases (Wichita, p=0.22; Manhattan, p=0.17; Topeka, p=1.22) and controls (Wichita, p=0.32; Manhattan, p=0.98, Topeka; p=1.74) from which most urban cases and controls were received.

Case–control distribution in the study region. Cross marks (x) and plus signs (+) indicate locations from where controls and cases were received, respectively.
Risk factors
Among all the variables screened with a liberal p value (0.1) in this study, the number of people living in a household (block group, p=0.08, and census tract, p=0.09) were the only 2 census variables significantly associated with case status. From the other categories, percentage area covered by grassland/pasture (henceforth referred to as grassland) (p=0.02), and developed medium density land cover type (p=0.06) surrounding case–control locations, location of residence in newly urbanized areas (p=0.03), and the mean vapor pressure recorded during the 8th week prior to case arrival (p=0.04) were significantly associated with case status. No soil-related variable was found to be associated with case status, and multicollinearity among these variables was not noted. The stepwise multivariable model fit with screened variables indicated percentage area covered by grassland land cover type surrounding case–control locations (OR=3.48, 95% CI=2.11, 5.73), and presence in newly urbanized areas (OR=2.69, 95% CI 2.62, 2.76) and mean weekly vapor pressure recorded during the 8th week prior to case arrival (OR=1.98, 95% CI 1.33, 2.94) as significant risk factors for feline tularemia (Table 3). The differences in statistical distribution of percent grassland coverage and vapor pressure (in percentage) surrounding case–control locations are provided in Figure 2. The inclusion of breed (indoor vs. outdoor cat) to the final model changed the parameter estimate of grassland land cover type by 8.3%, generally considered not sufficient enough to indicate a significant effect due to that factor. The model predictive ability measured by the area under the curve (AUC) value was noted as 7.83. Spatial autocorrelation among residuals was not noted (p=0.28), the chi-squared goodness-of-fit test did not indicate any model inadequacy (p=0.33), and nonlinearity of logit was not noted.
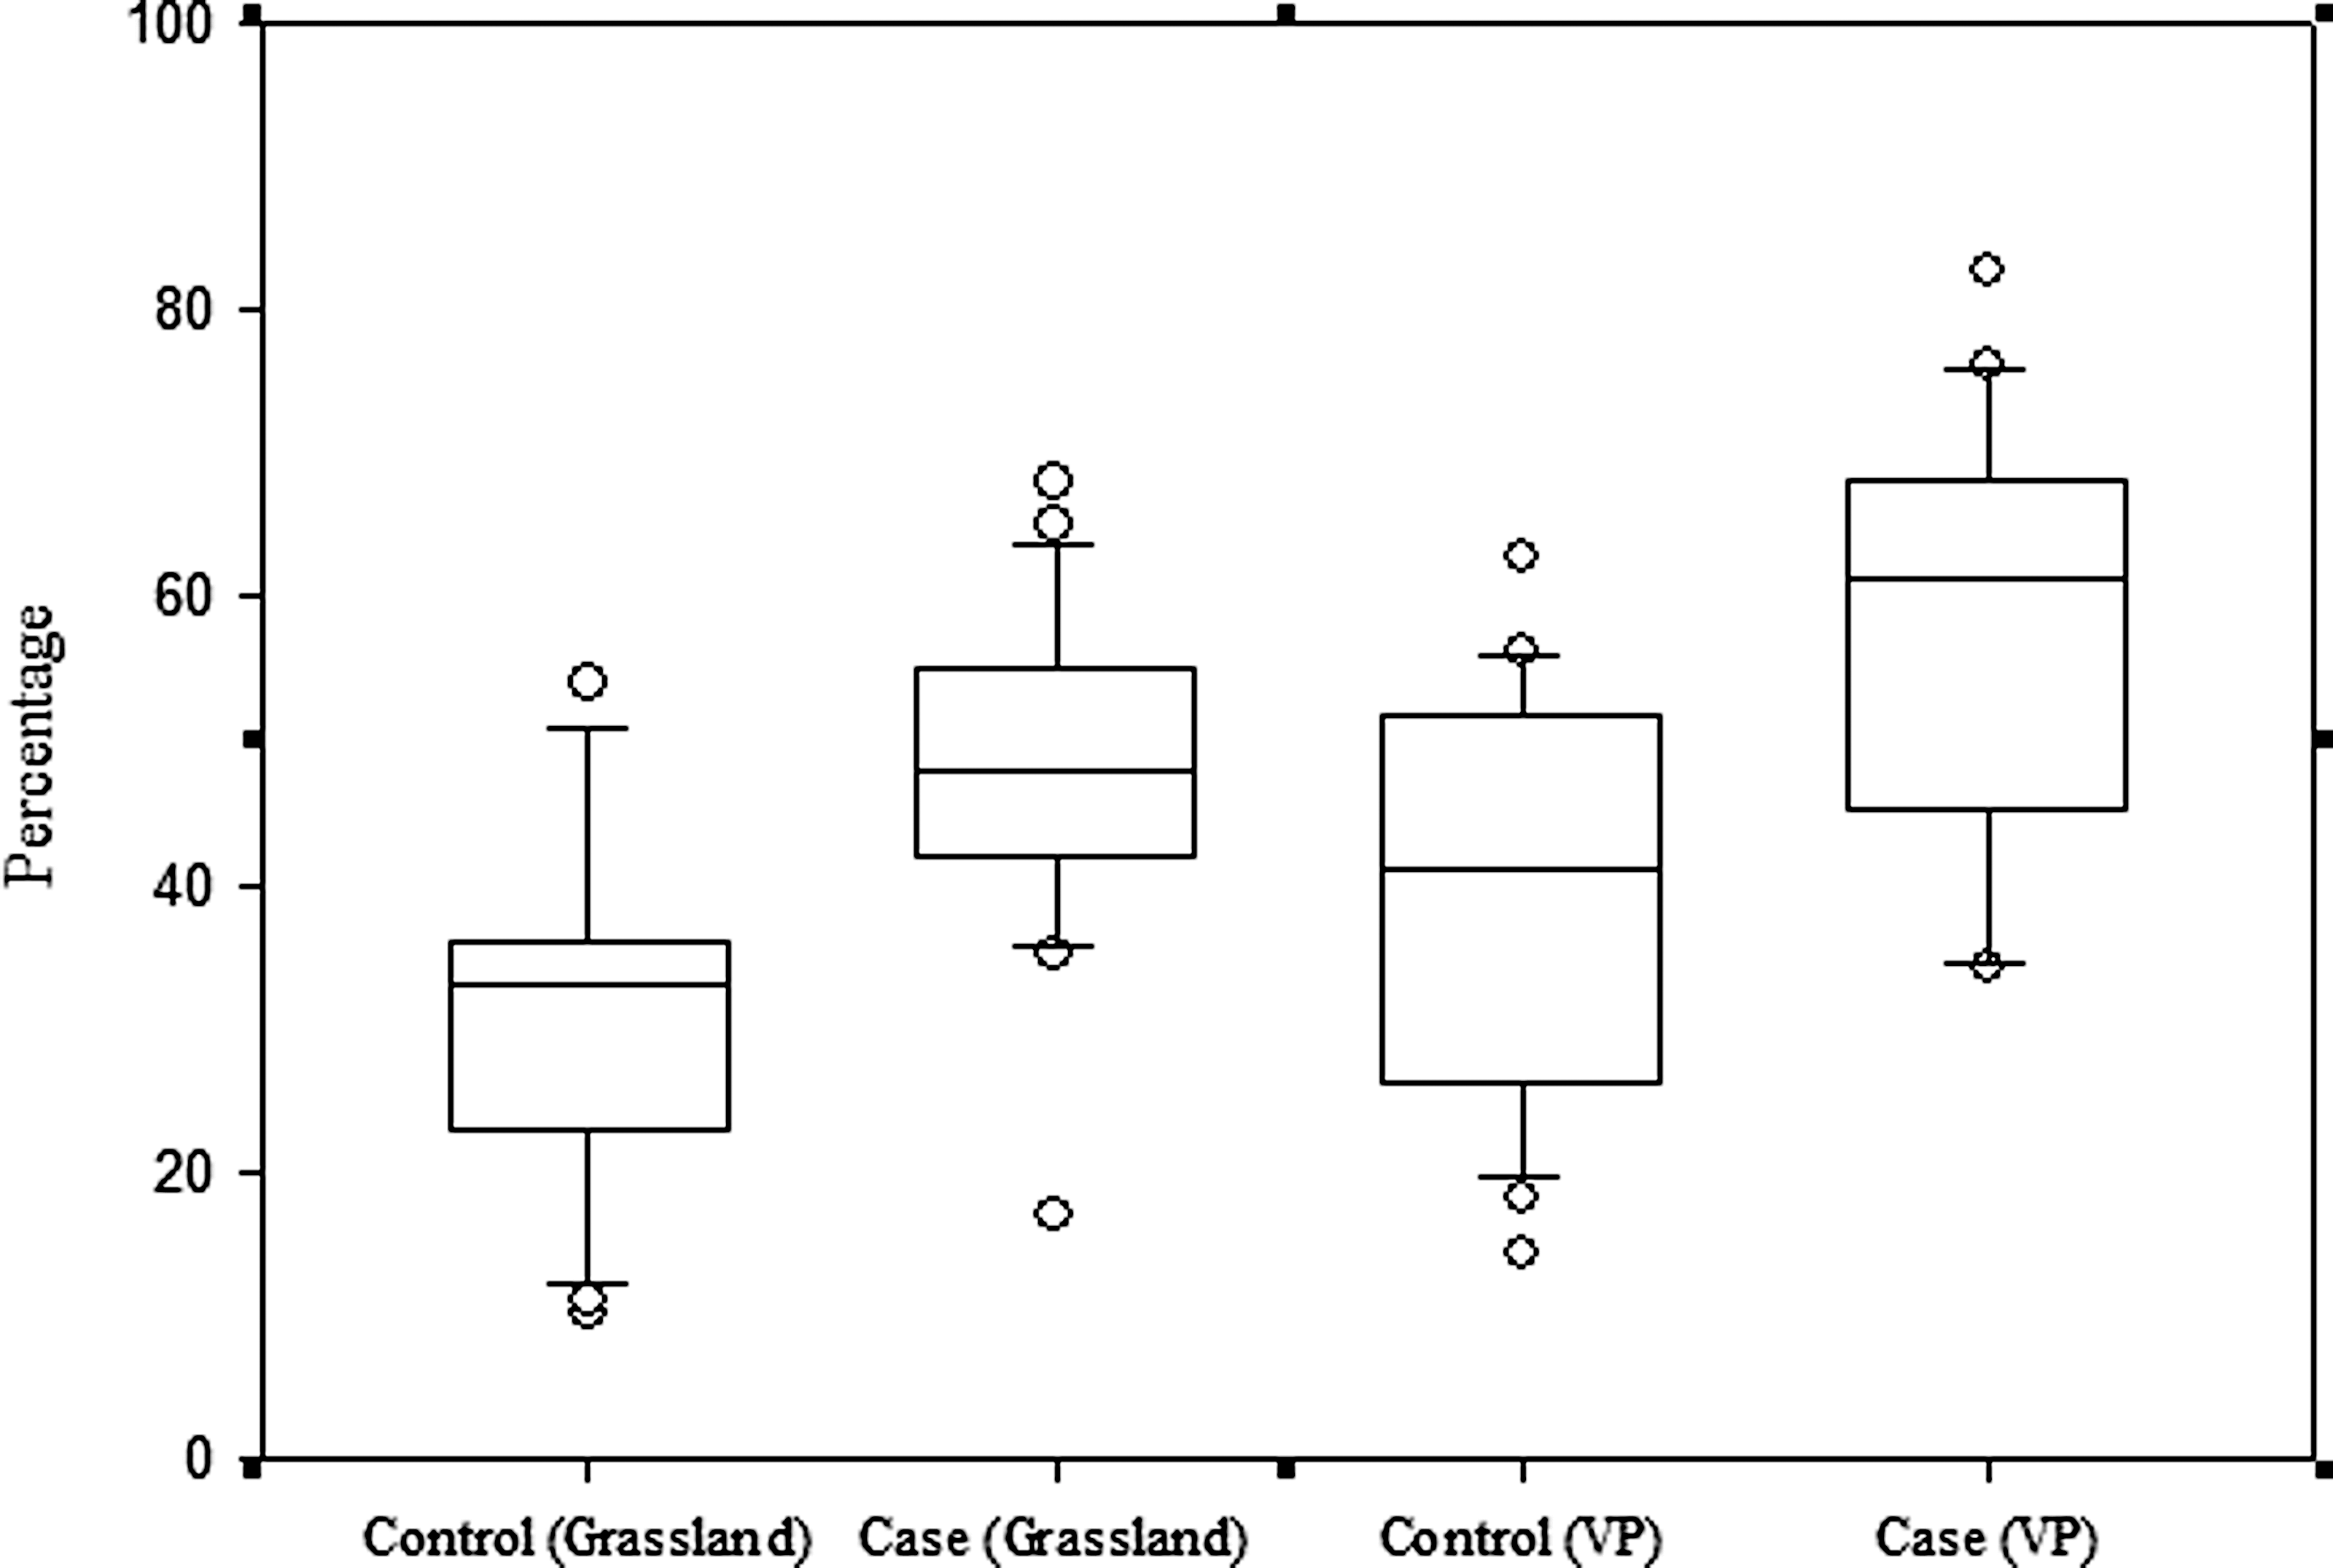
Percentage grassland land cover area, and weekly vapor pressure estimates surrounding case–control location in the study region. Mean values of vapor pressure estimated per 1-km2 area in Daymet were first averaged within the 2500-meter buffer areas per day followed by a second averaging per week using values obtained from individual days within a week. The raw vapor pressure values were converted to percentages for ease of comparison using a hypothetical maximum vapor pressure value of 2000 pa.
All variables were in a continuous form except for the presence location within/outside urbanized areas, which was categorical.
Significantly associated (p<0.05) with tularemia status in cats.
Discussion
The observed seasonality of feline tularemia during summer months in this study is similar to the summer prevalence noted for human tularemia cases in the region (Centers for Disease Control and Prevention 2009) and could be linked to the higher prevalence of infected ticks during spring and early summer months. In a study that observed the numbers and types of different tick species on various animal hosts in Kansas during 2000–2007, tick infestations on different hosts, including indoor and outdoor cats, were noted to peak during the April–July period roughly corresponding to the spring and summer months in the study region (Dryden et al., unpublished). Potential bias introduced in the study as a result of a given diagnostic facility receiving higher numbers of cases from neighboring cities due to proximity and familiarity and from certain neighborhoods with different levels of income was a concern. However, the lack of clustering among cases and controls in the dataset from any of the cities in the study region indicates that there was no such bias in case reporting. The lack of case association with any socioeconomic indicators evaluated in this study is further evidence that feline tularemia in the study region is not driven by any pet owner socioeconomic status or housing conditions.
This study considered potential drivers of feline tularemia from a variety of different spheres of influences and identified risk factors that are important for preventing this disease in cats, and to some extent their human pet owners also, given the zoonotic potential of this disease. The identification of grassland areas as a risk factor is a reflection of potential for tick habitats in this type of land cover areas, and the finding is similar to previous reports that have described similar types of land cover areas being a risk factor for other tick-borne diseases in cattle and deer; e.g., anaplasmosis (Swai et al. 2009) and Lyme disease (Guerra et al. 2002). The definition of grassland/herbaceous land cover class according to MRLC (2012) is those areas that are dominated by upland grasses and forbs, in which only rarely herbaceous cover is less than 25%, but exceeds the combined cover of the woody species present. Grassland/herbaceous areas are not subject to intensive management, but they are often used for grazing. Cats may be exposed to infected ticks while outdoors in grassland and/or due their owner's accidentally bringing home ticks attached to their clothes/shoes after having been outdoors. Model estimates indicating the risk of grassland coverage to cats did not change markedly when adjusted for indoor versus outdoor cat differences, indicating that the risk of grasslands to be the same for both types of cats.
In a different study, Eisen et al. (2008) identified dry forested areas as an important determinant in human tularemia prevalence in the midwestern United States. Dry forested areas in that study were estimated using normalized difference vegetation index estimates, and their finding was attributed to potential for higher tick prevalence in this type of land cover. Forested areas in general were more likely to be associated with Amblyoma americanum, a tick host for tularemia in an acarologic survey study conducted in the state of Missouri (Brown et al. 2011). Land cover types other than grassland vegetation were not significantly associated with case status in the present study. The differences noted between these studies could be due to differences in the kinds of geospatial datasets used their spatial resolution, and averaging effects over different spatial extents in these studies. Grouping NLCD land cover classes based on their suitability for tick habitats may help identifying additional land use/land cover risk factors of feline tularemia. Also, some land cover areas are difficult to discern in a global remotely sensed dataset such as NLCD but could be relevant to tick habitats such as the grassland edges of wooded areas because they have been shown to harbor ticks (Talleklint-Eisen and Eisen 1999).
This study has shown that cats living in homes located in newly urbanized areas are at increased risk for tularemia infection. This finding may be linked to the higher exposure potential for cats living in such residences to grassland areas in general, and also likely may be due to the higher presence of grassland and woodland edges around new developments that are suitable for tick habitats (Eisen et al. 2008). Newer subdivisions among cities in the study region are created typically by clearing wooded areas or farmlands, and the backyards of many newer homes in these subdivisions are in close proximity to areas suitable for tick habitats. In addition, it is not uncommon for many of the suburban homes to have relatively larger, unmanaged backyards that sometimes lack a fence, which could allow free cat and wildlife movement, exacerbating the risk for tularemia and other zoonotic diseases.
Among all the past climatic condition variables evaluated in this study, mean weekly vapor pressure conditions recorded during the 8th week prior to case arrival was a significant risk factor for feline tularemia. Vapor pressure is a measure of the amount of pressure exerted by water molecules in the atmosphere, with higher vapor pressure indicating more water molecules in the air and therefore wetter or humid conditions. Relative humidity, a commonly used humidity index, is the ratio of water vapor density (actual vapor pressure) to the saturation water vapor density (saturation vapor pressure) expressed in percentages. Humidity plays an important role in tick life cycle, with different levels of humidity required for the survival of different tick species and their different life stages (Yoder 2012a). Schwartz (1995) documents an increase in more humid air masses in the later part of the 20th century for eastern Kansas and Missouri; also areas that have been noted for its high tularemia prevalence among humans, wildlife, and ticks in the past decades. The finding of a significant association with humidity in the present study most likely indicates a critical humidity requirement for tick survival and/or their ability to harbor and transmit the pathogen. It is notable that other climate parameters, particularly temperature and precipitation, that are closely associated with humidity were not significantly associated with case status for the same time period in the present study. Although, it is possible that during preceding weeks, a combination of weather effects—for instance, precipitation through a week of higher daily maximum temperatures—resulted in appropriate humidity conditions favorable for tick-mediated tularemia infection (McCabe and Bunnell 2004). The precise reason for humidity association with case status in the present study cannot be fully determined, and further studies may be necessary to identify critical climate thresholds.
Different soil types and their hydrologic properties were expected to be associated with case status in this study because ticks spend a majority of their lives on the topsoil surface, which may influence their survival and reproductive success (Yoder et al. 2012b). However, any such association could not be detected in the present study nor could it be found in prior studies. The reasons for this could be a lack of adequate case–control samples enrolled in the study representing households located in different soil types, and also due to the natural fluctuations in soil hydrologic properties year to year, such as dry versus wet years, that affect the tick life cycle differently.
The prevalence rate of feline tularemia cannot be determined reliably using case submission data to a diagnostic facility. It is likely that many in the study region went unreported due to pet owner's lack of interest, economic constraints of pet owners, or other unknown reasons. In addition, unlike human cases of tularemia, feline tularemia is not designated as a reportable disease in Kansas or other neighboring states in the midwestern United States. It is likely, however, for the prevalence of this disease among cats and other reservoir hosts to be higher than the currently known levels, occasionally resulting in notable outbreaks. The widespread human tularemia outbreak in Sweden in the year 2000 was in part attributed to owning a cat in the household (Eliasson et al. 2002).
Given the zoonotic and life-endangering potential, designating feline tularemia to be a reportable disease may be important to help mitigate future major outbreaks in the study region. Prevalence studies among cats and common peridomestic reservoir hosts in suburban areas will help further understand the spatial epidemiology and ecology of this disease and help develop appropriate prevention strategies. All of the risk factors identified in this study point indirectly to the potential role ticks could be playing in incubating and transmitting tularemia. The 3 well-known tick hosts of Francisella are the dog tick (Dermacentor variabilis), wood tick (D. andersoni), and lone star tick (A. americanum). Studies on the effect of critical climate thresholds, soil conditions, and effects of anthropogenic activities on their habitats (habitat loss, habitat fragmentation) and their spatial, population dynamics in the region is warranted.
Conclusions
Cats living in newly urbanized and suburban areas and in residences surrounded by land cover areas dominated by grassland vegetation are under increased risk for tularemia. Mean weekly vapor pressure or humidity conditions recorded during the 8th week prior to case arrival at the diagnostic facility could be an important meteorological predictor in the study region for feline tularemia. Preventive strategies like acaricide applications in residential backyards during spring and early summer periods and behavior modifications suitable for preventing cats from contracting tularemia while being outdoors may be necessary to avoid any outbreaks.
Footnotes
Acknowledgments
This study was partially funded by the National Science Foundation (NSF Award No. EPS-0903806) Phase VI: Climate Change and Energy: Basic Science, Impacts, Mitigation Science Initiative, and Kansas State Veterinary Diagnostic Laboratory (KSVDL). The authors gratefully acknowledge Tanya Purvis, KSVDL Bacteriology Section, Kansas State University for providing excellent technical assistance.
Author Disclosure Statement
No competing financial interests exist.