
Abstract
The strategy adopted by a global program to interrupt transmission of lymphatic filariasis (LF) is mass drug administration (MDA) using chemotherapy. India also followed this strategy by introducing MDA in the historically known endemic areas. All other areas, which remained unsurveyed, were presumed to be nonendemic and left without any intervention. Therefore, identification of LF transmission risk areas in the entire country has become essential so that they can be targeted for intervention. A geo-environmental risk model (GERM) developed earlier was used to create a filariasis transmission risk map for India. In this model, a Standardized Filariasis Transmission Risk Index (SFTRI, based on geo-environmental risk variables) was used as a predictor of transmission risk. The relationship between SFTRI and endemicity (historically known) of an area was quantified by logistic regression analysis. The quantified relationship was validated by assessing the filarial antigenemia status of children living in the unsurveyed areas through a ground truth study. A significant positive relationship was observed between SFTRI and the endemicity of an area. Overall, the model prediction of filarial endemic status of districts was found to be correct in 92.8% of the total observations. Thus, among the 190 districts hitherto unsurveyed, as many as 113 districts were predicted to be at risk, and the remaining at no risk. The GERM developed on geographic information system (GIS) platform is useful for LF spatial delimitation on a macrogeographic/regional scale. Furthermore, the risk map developed will be useful for the national LF elimination program by identifying areas at risk for intervention and for undertaking surveillance in no-risk areas.
Introduction
The World Health Assembly passed a resolution in 1997 (World Health Assembly 50.29), calling for elimination of LF as a public health problem by the year 2020 (World Health Organization 2001). Following this, a global program for elimination of LF was launched in 1999 by the World Health Organization (WHO). This facilitated initiation of national programs in endemic countries, including India. The program in India was made a part of the National Vector Borne Disease Control Programme (NVBDCP) in 2003 under the National Health Policy of 2002, and it set a target for elimination of LF by 2015 (World Health Organization 2001). The current strategy for achieving this goal is by annual single-dose mass drug administration (MDA) of diethyl carbamazine citrate (DEC, 6 mg/kg body weight) plus albendazole (ALB, 400 μg/kg body weight) for at least 5 years to the entire population in the historically known endemic districts. The implementation unit for MDA is a district, which encompasses different geographical and ecological situations. The unsurveyed areas were presumed to be nonendemic and left without any intervention.
At the time of introduction of MDA, a district-level endemicity map was created for India (Sabesan et al. 2000). The map showed that of the 289 districts surveyed up to 1995 (62% of 466 districts) as many as 257 were found to be endemic. Subsequently, due to the bifurcation of many districts in different states, the total number of districts increased to 593 (in 2008), and, of these, the endemic status was known only for 403. The remaining 190 districts were unsurveyed at the point when this study was initiated. In the absence of data on human infection/disease status for many districts across the country, it was thought necessary to identify areas conducive for transmission.
A transmission risk map was originally created for a smaller region (Tamil Nadu State, India), based on the geo-environmental risk model (GERM) developed earlier (Sabesan et al. 2006). The GERM was initially validated by a ground truth study, using the data generated on filarial antigenemia (Ag) among school children. Briefly, the model was quantified by relating the endemicity status with a comprehensive risk index. The index was derived by including all well-known geo-environmental variables that influence filariasis transmission (Brooker and Michael 2000). By using the same principle in the present study, a filariasis transmission risk map was created for the whole country. The purpose of the study was to create a filariasis transmission risk map for India based on GERM and using certain risk variables and determining whether risk of transmission exists in areas hitherto not surveyed. The GERM predictions were validated through a ground truth study and indicated the need for intervention in areas predicted at risk of transmission.
Methods
Study area
India, with an area of 3, 287,782 km2, is one of the world's largest countries, and its population of 1.2 billion is second only to that of China.
Database
Geo-environmental data
The Survey of India (SOI) administrative boundary maps (scale 1:50,000) were used as base maps. The geo-environmental variables considered were soil texture, altitude, temperature, rainfall, and relative humidity. A database for these variables was created on GIS platform, using ArcGIS (ESRI 2010) and ERDAS software (LEICA-Geosystems; ERDAS Imagine Software 2011). For soil texture, the SOI topo-sheets pertaining to soil were scanned and brought into the geographic information system (GIS) platform and geo-referenced for digitization purpose. Through the digitization technique, a soil shape file was created. Altitude data were obtained from the Shuttle Radar Topographic Mission (SRTM) of the National Aeronautical and Space Administration (NASA) (Shuttle Radar Topographic Mission 2000). The geo-referenced SRTM data tiles in geo-tiff format have been made into a mosaic to obtain coverage of all of India. Furthermore, these data were differentiated into varying altitude categories. Meteorological data for the past 50 years were obtained from the Indian Meteorological Department (IMD). The data for climatic variables (temperature, rainfall, and relative humidity) were summarized by taking the mean values of the respective variable for each site. The data were converted into dbase format and geo-referenced in the GIS platform. The geo-referenced dataset for each variable was then transformed into seamless spatial coverage for the whole of India, using the “spline” spatial interpolation method.
Filariasis Transmission Risk Index (FTRI)
All of the geo-environmental factors that we used in our model are known to influence (either individually or in combination) the LF transmission in an area (Brooker and Michael 2000, Berquist 2001). A range of values for each variable was considered essential for a site to be classified as being at risk for LF transmission. The optimal range of values for temperature, relative humidity, rainfall, and altitude were 15°C to 32°C, >50%, above 300 meters and <900 meters, respectively. Soil texture with a water retention capacity as measured by clay (>30%) and silt (>50%) content of the soil in an area was considered important for vector breeding. Accordingly, each variable was given score ranging from 0 to 3, depending upon its degree of influence on transmission (vector proliferation, survival, and “extrinsic” incubation period). A score of 3 indicates that the risk of transmission is highest; a score of 0 indicates little or no transmission. The geo-environmental variables customized in the GIS domain were used for deriving FTRI following the procedure adopted earlier in developing the GERM (Sabesan et al. 2006).
The FTRI for a site was derived by summing up the scores assigned for different geo-environmental variables and is mathematically expressed as,
where X1j
, X2j
, X3j
, X4j
, and X5j
are scores for soil texture, altitude, temperature, rainfall, and relative humidity respectively for site j. In order that this FTRI for a site j is given as a standardized quantity, it was represented in terms of percentage as follows,
The SFTRI for a district was summarized by taking the weighted mean of the SFTRI with weight being the area of the polygons in a district.
Historical data on filariasis
The district-level endemicity (prevalence of microfilariae and or disease) map of lymphatic filariasis in India was created (Fig. 1) on a GIS platform. The data used for this purpose included the documents held by the erstwhile National Filaria Control Programme as well as published literature (Sabesan et al. 2000). The data generated on the prevalence of infection (microfilariae) was based on 20-μL samples of night blood from 5–7% of each study community, and disease (symptomatic, acute, chronic cases) from 403 districts was surveyed over a period of 50 years (1950–2000). Among the surveyed districts, 362 were endemic and the remaining 41 were nonendemic.
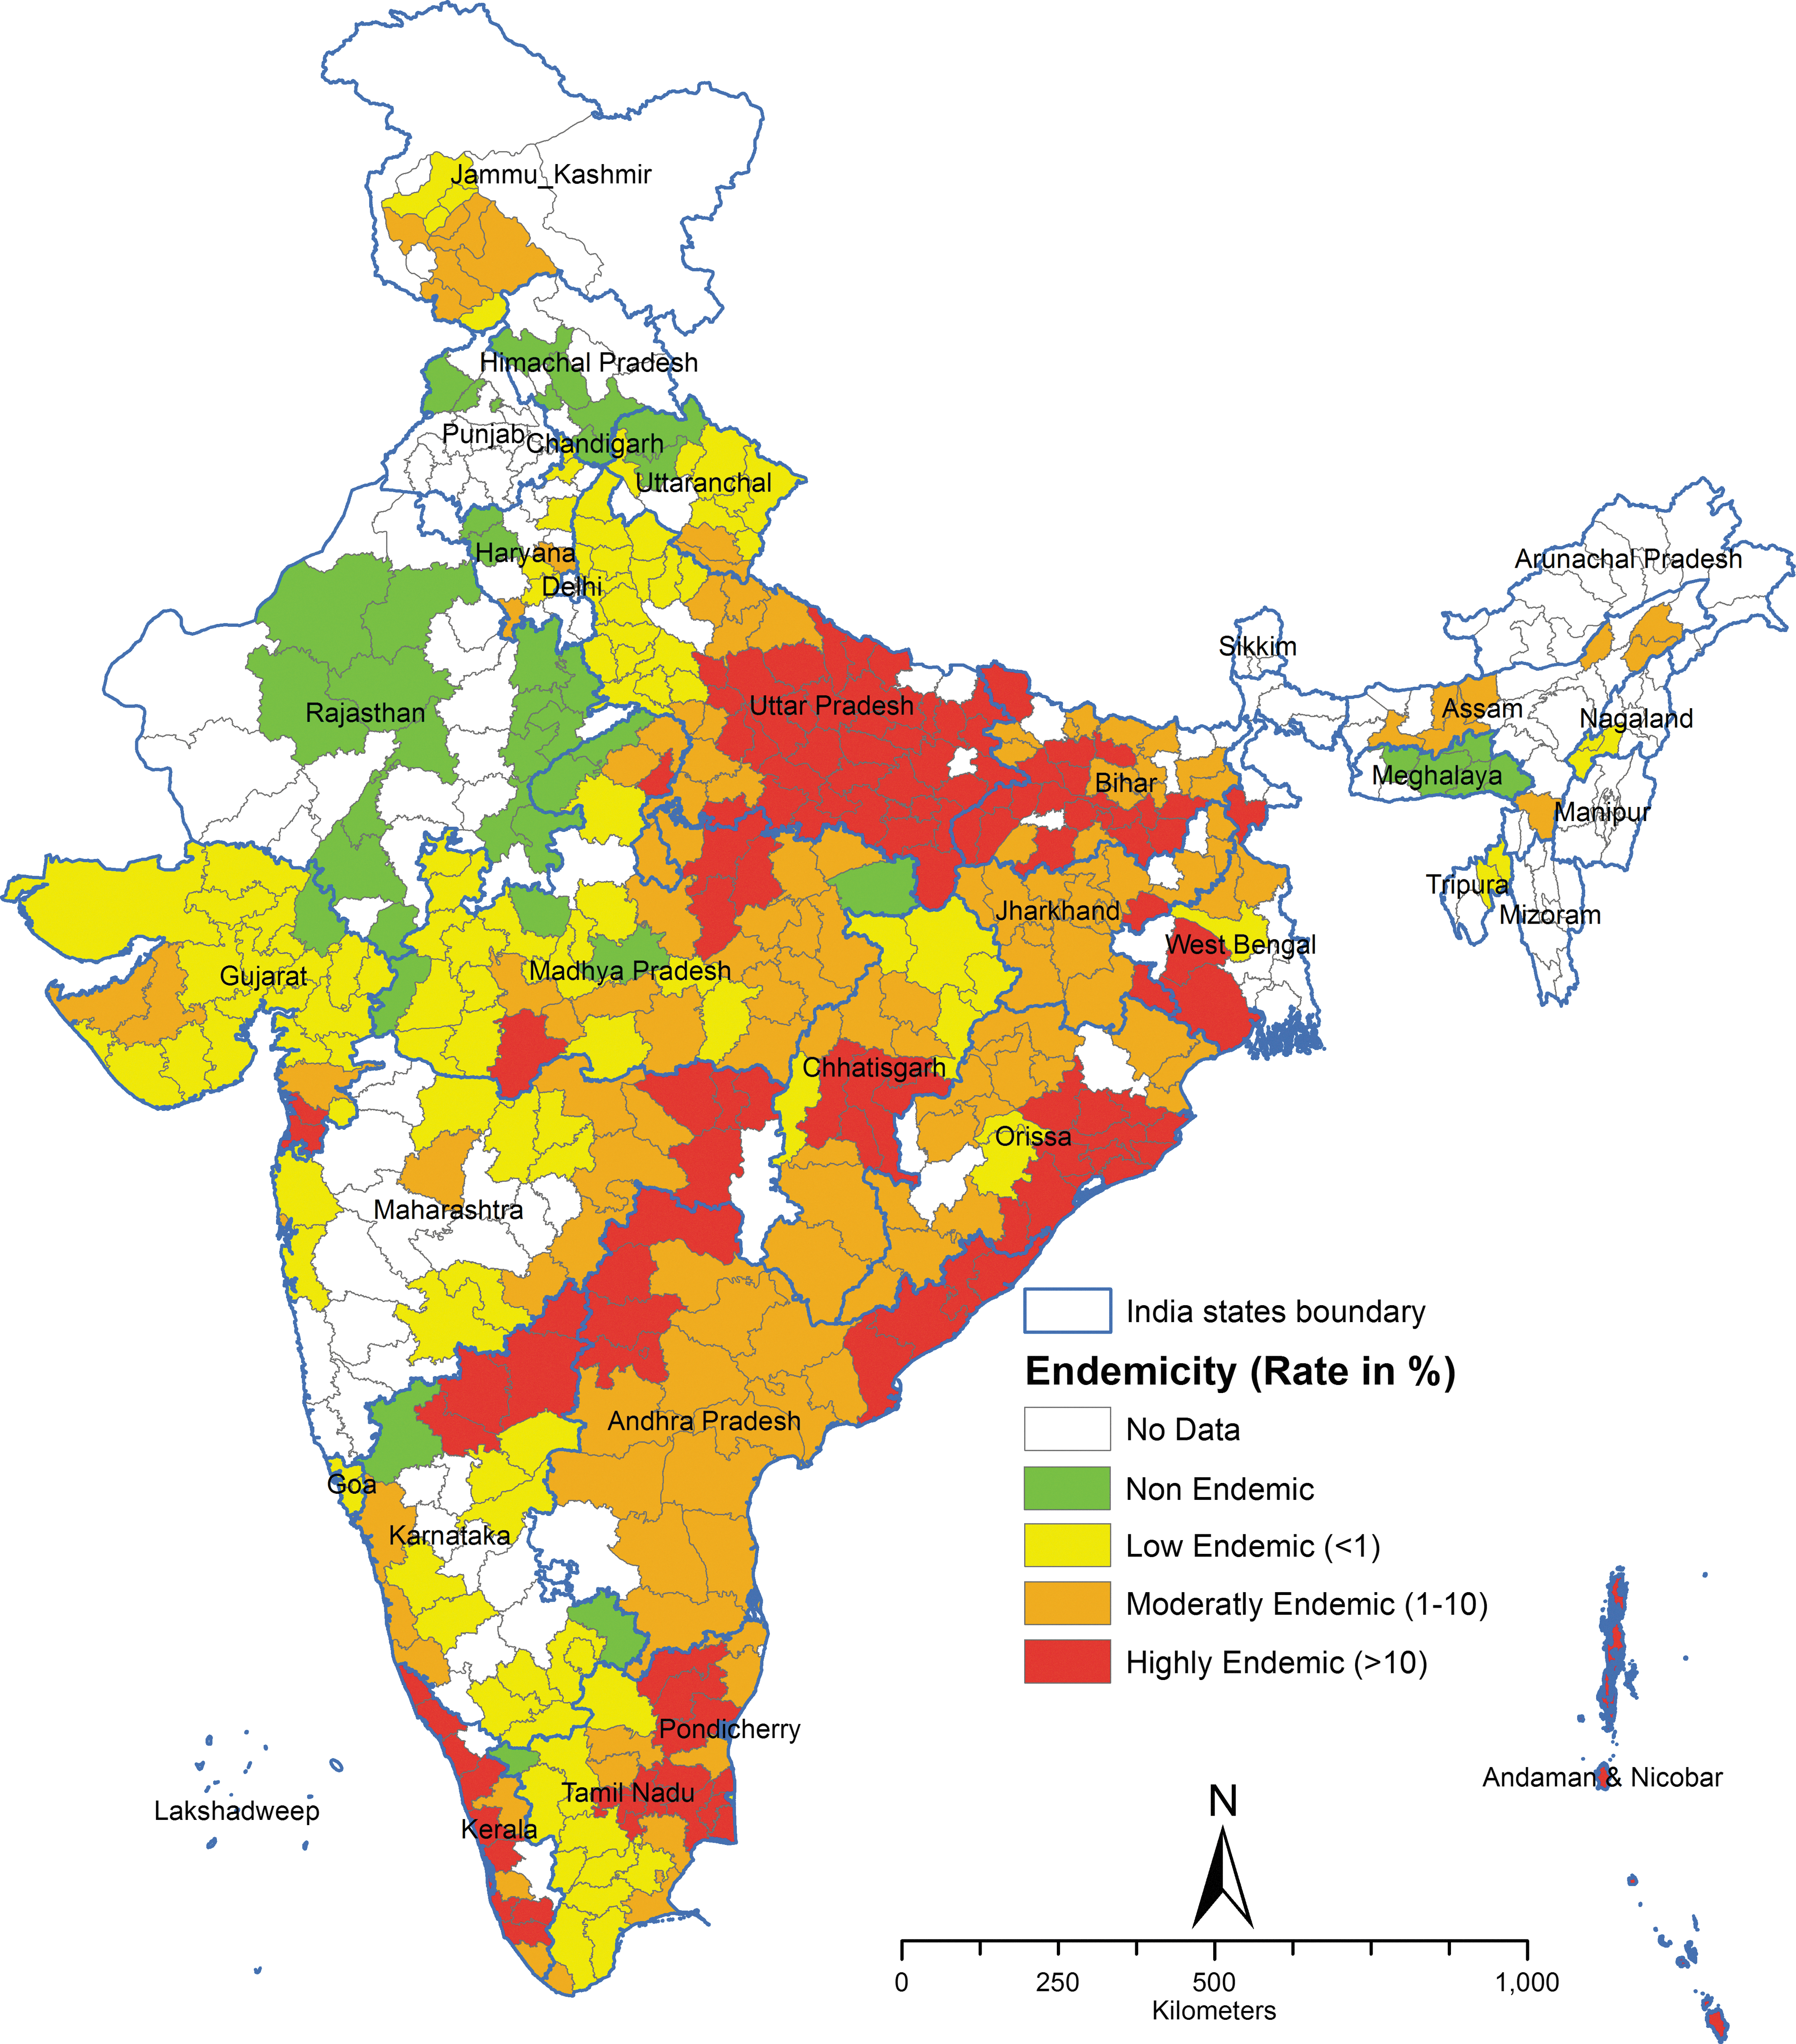
The district-level endemicity map of lymphatic filariasis in India based on historical data (Sabesan et al. 2000).
Ground truth study
Whether transmission of LF has indeed been taken place or not at a particular site was determined by a ground truth study, following a standard procedure (Sabesan et al. 2006). Sampling sites were selected using GIS tools. An immunochromotographic card test (ICT) was used for screening individuals for the presence of Ag. The ground truth study was restricted to the districts hitherto unsurveyed, to ensure that the sites were selected without bias, as the filarial infection status is unknown. The number of districts that hitherto had not been surveyed was 190. Of these, 65 districts from the states of Jammu and Kashmir and northeastern states could not be taken for this study for political reasons. The remaining 125 districts spread all over India were taken for validation.
Grid sampling
The areas under the unsurveyed districts were divided into 100-×100-km grids for sampling purposes, expecting the presence of at least one village (rural)/ward (urban) in each grid, and also its representation of the particular grid in terms of geo-environmental characteristics. Considering the enormity and other logistics, 61 grids were randomly selected that spread over the entire unsurveyed areas. In each selected grid, a village/ward (site) falling near the centroid of the grid was selected for the study. In the 61 selected sites, a filarial Ag survey was carried out under the supervision of experts from different health and medical institutions. In each selected site, 60 school children below 15 years of age were screened for filarial Ag, using ICT kits, because recent local transmission, if any, among the community will generally get reflected in children. The sample size of 60 for each site was determined by assuming an expected Ag prevalence of 1% with a precision of 2.5% (suggesting a prevalence range of 0.6–3.5%) in a population of 1500 children. The children in each site were examined by visiting either all or selected sections of the schools, located in these sites, following a systematic random procedure.
Statistical analysis
The relationship between the Standardized Filariasis Transmission Risk Index (SFTRI) and endemic status of an area was quantified by logistic regression analysis. In the regression analysis, the endemic status of an area was considered as the dependent variable and the SFTRI as the independent variable. An area was considered as endemic if its endemicity was >0; otherwise, it was considered as nonendemic. The dependent variable is binary in nature, indicating the presence or absence of filariasis in an area. For quantifying the relationship, the data (SFTRI and endemicity) corresponding to the areas where filarial status was known from the historical survey were used, because these data were expected to be free of any intervention during the pre-MDA period (before 2000). The goodness of fit of the relationship was assessed by the Hosmer–Lemeshow statistics, which is useful when some of the predictor variables are continuous.
The empirical semivariogram of the residuals from the logistic regression model was used to examine whether there was any spatial correlation that could explain the remaining unexplained variation in our data. Furthermore, to test the statistical significance of any remaining spatial variation in our data, we constructed empirical semivariogram envelopes by performing simulations (n=99). The simulations were done under the null hypothesis of spatial independence, which means that any observation could be assigned to any of the observed locations. The semivariogram envelopes were constructed by taking the minimum and maximum semivariances at each lag distance. If all points from the empirical semivariogram fell within the simulated envelopes, then the null hypothesis of spatial independence was not rejected (Ribeiro et al. 2003). The empirical semivariogram and its envelopes were estimated using the geoR package in R (Diggle and Ribeiro 2007).
Receiver operating characteristic (ROC) curve analysis was performed to determine the threshold value of the predicted probability of risk that can discriminate a district as endemic or nonendemic. The ROC curve plots the truly endemic status (proportion of endemic districts correctly predicted by the model as endemic, sensitivity) against the false endemic status (proportion of nonendemic districts falsely classified by the model as endemic, 1-specificity) for each threshold. The area under a ROC curve (AUC, a measure of average sensitivity for all possible values of specificity) was used as a measure of the overall performance of the model. The closer the AUC is to 1, the better the overall performance of the model (Seong et al. 2004). The threshold value of the predicted probability of risk, which provides a sensitivity and specificity of >90%, was used as the cutoff value (d) for classifying a district as endemic or nonendemic. A district with a predicted probability of ≥d was classified as endemic; otherwise it was nonendemic. The probability d was then used to assess the sensitivity and specificity of the model predictions for all the surveyed and unsurveyed districts.
The quantified relationship was validated by assessing the sensitivity and specificity of the model predictions for the areas where filarial Ag survey was carried out. Further, a k-means cluster analysis was done to categorize the endemic districts into three groups—low, moderate, and high based on the SFTRI values for the endemic districts. All of the analyses were carried out with STATA version 9.0 and SPSS version 19.0.
Ethical clearance
For conducting filarial Ag survey among the school children, ethical clearance was obtained from the Institutional (VCRC) Ethics Committee. For individual students, informed written consent was obtained from his/her parents or a guardian, as well as their school teacher and headmaster or headmistress. Also, it was ensured that the children who were detected positive for Ag were receiving selective chemotherapy (DEC, 6 mg/kg body weight for 12 days) under authorized medical supervision.
Results
The results of the analysis are presented in three steps: (1) Creating a filariasis transmission risk map using SFTRI, (2) model quantification and validation using data from historical observations and filarial Ag survey, respectively; and (3) model predictions for unsurveyed districts.
Filariasis transmission risk map using SFTRI
The SFTRI ranged from 10.2% to 91.4% for different districts with a mean [standard deviation (SD)] of 59.9% (13.0). Using the SFTRI values, a filariasis transmission risk map for India was produced on a GIS platform (Fig. 2). The risk of transmission was shown by the intensity of color, varying from little or no risk (green) to the maximum, i.e., high risk (red). It was observed that the risk was higher in the coastal and river basins, lower in semiarid and arid zones, and nil at high altitudes.
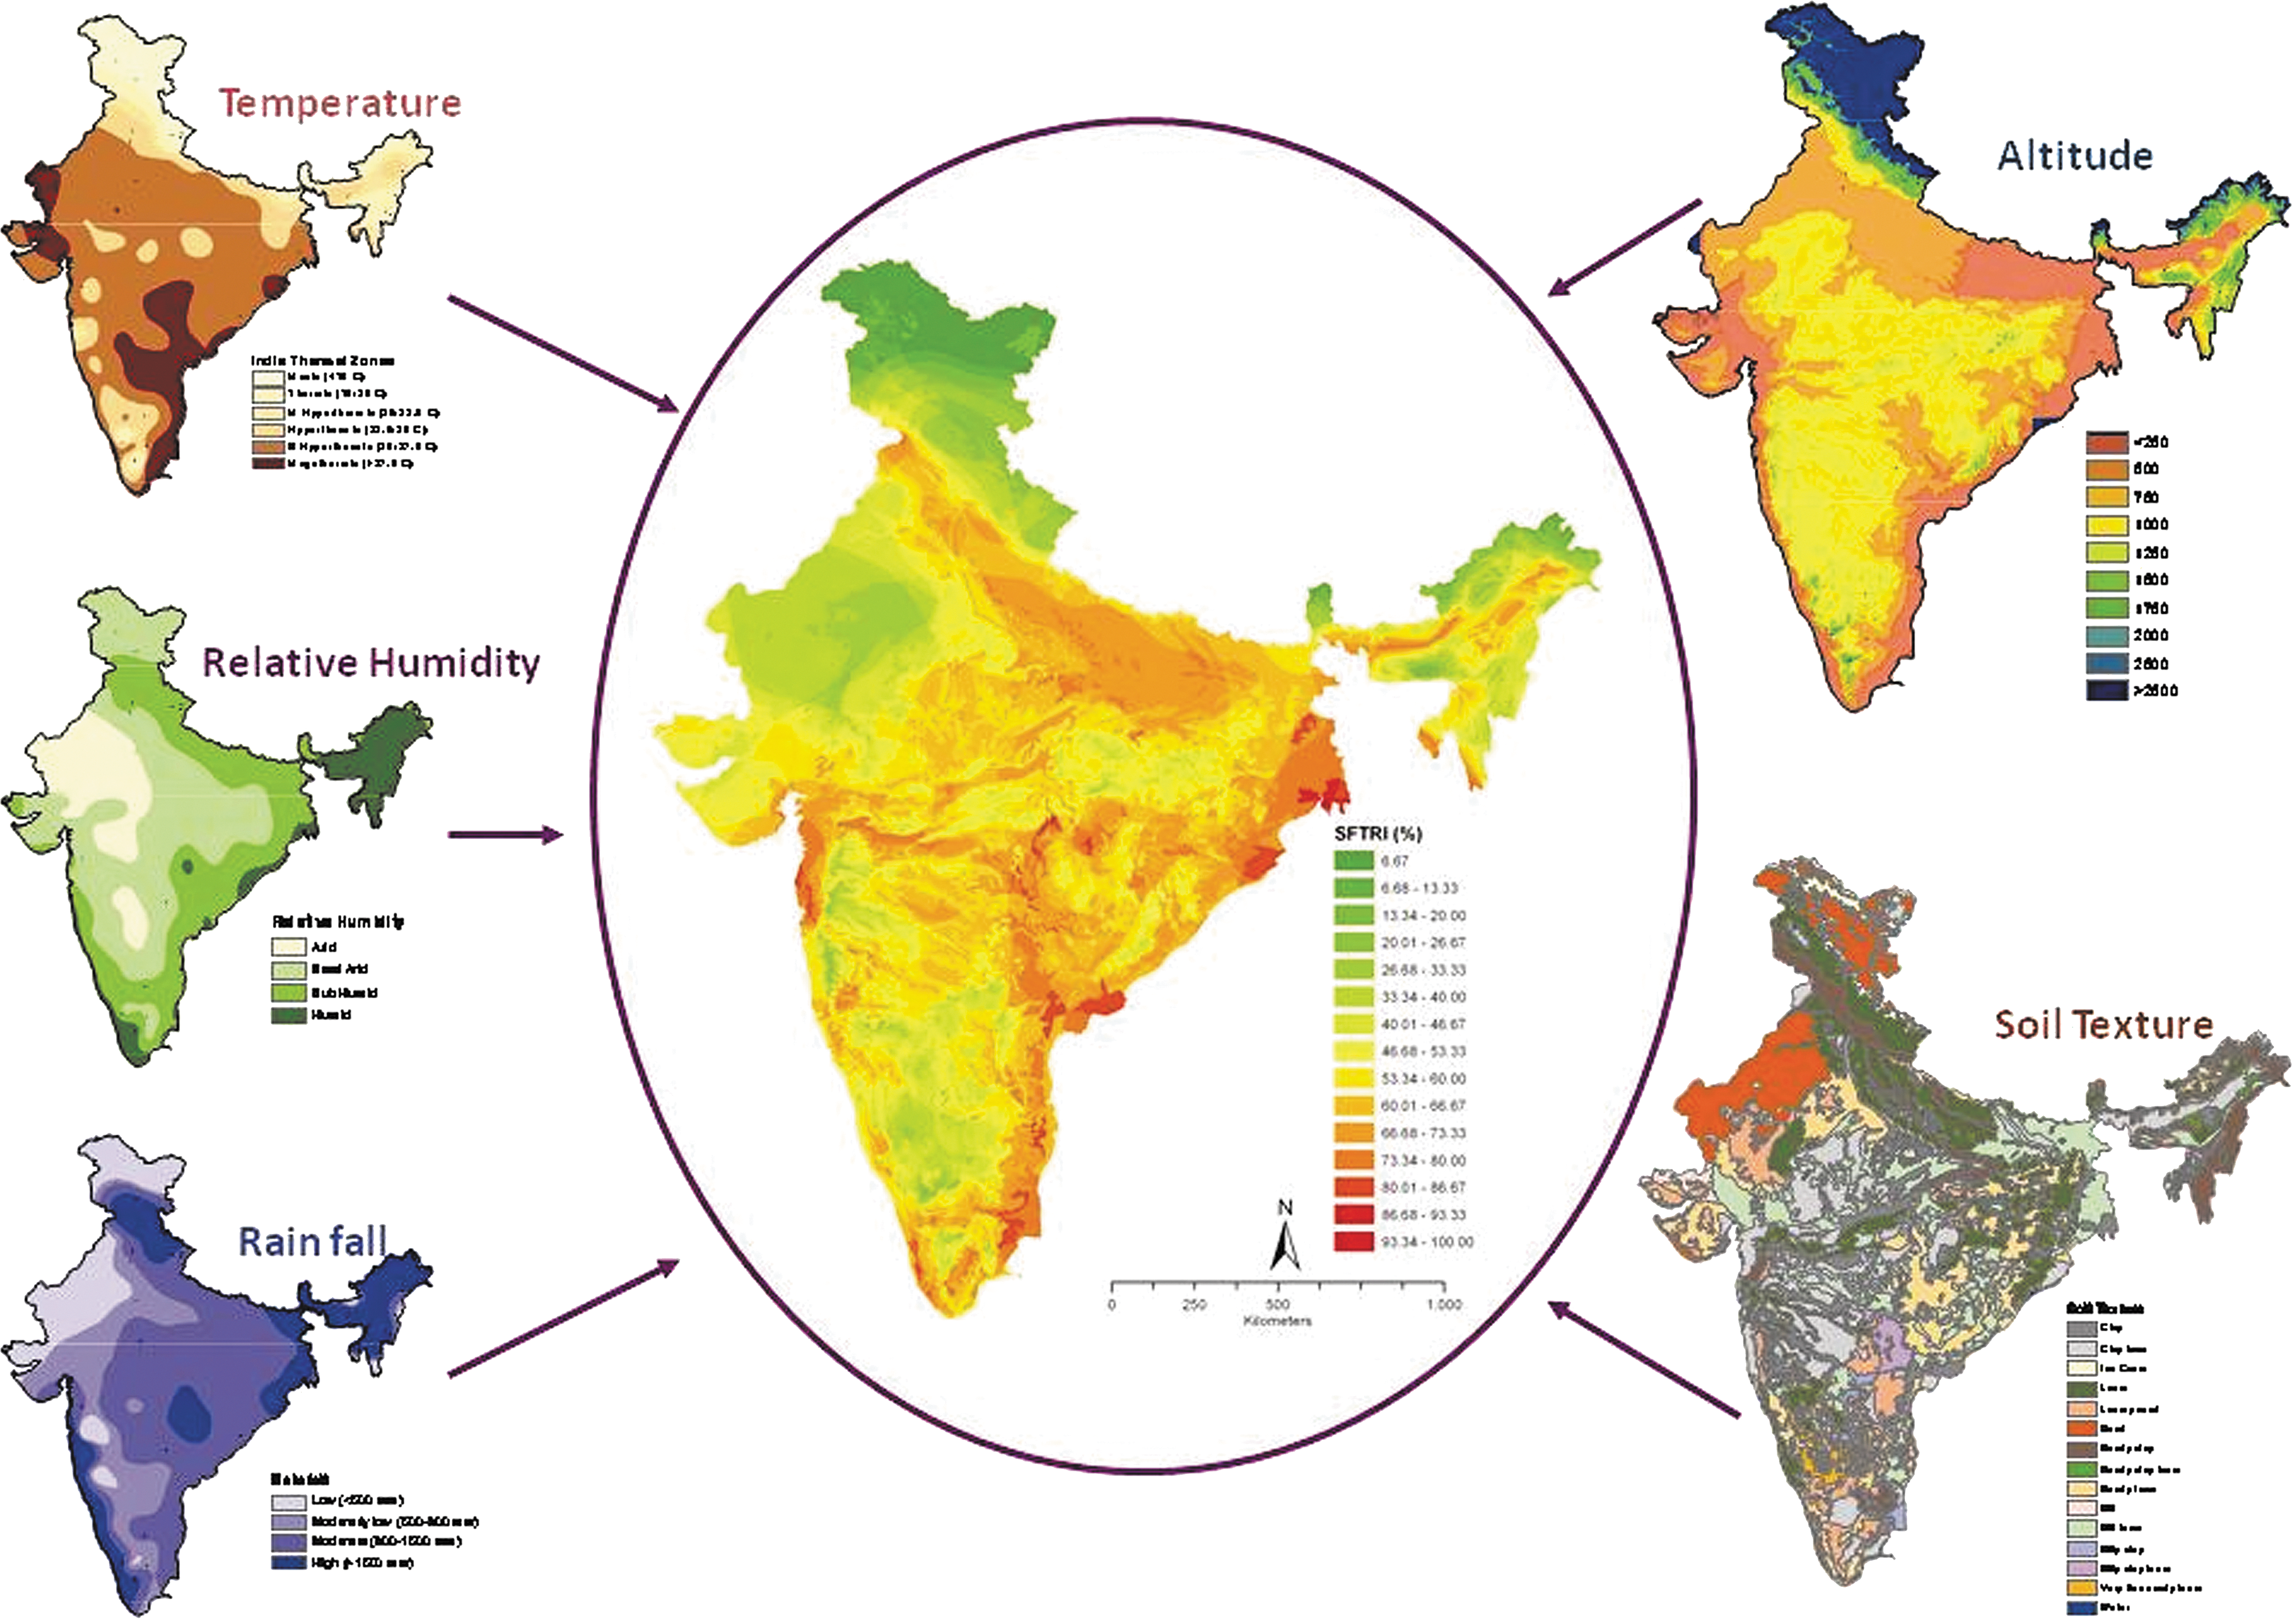
Lymphatic filariasis transmission risk map based on the standardized filariasis transmission risk index (SFTRI) along with geo-environmental variables.
Model quantification and validation
Historical observations and filariasis transmission risk
Logistic regression analysis showed that SFTRI [slope, 0.24; 95% confidence interval (CI) (0.17, 0.29); intercept, −10.6; 95% CI (−13.57, −7.62)] is a significant predictor of the filarial endemic status of an area (p<0.005). The model predictions were in good agreement with the historical observations (Hosmer–Lemeshow goodness fit test, χ2=11.8, p=0.16).
Figure 3 shows the empirical semivariogram and envelopes of residuals from the logistic regression model that relates endemic status with SFTRI. Furthermore, it could be observed that almost all the empirical semivariograms fall within the semivariogram envelopes, indicating that the null hypothesis of spatial independence was not rejected. Thus, our logistic regression model appeared to be adequate, and a model with spatial component was not considered to be necessary.
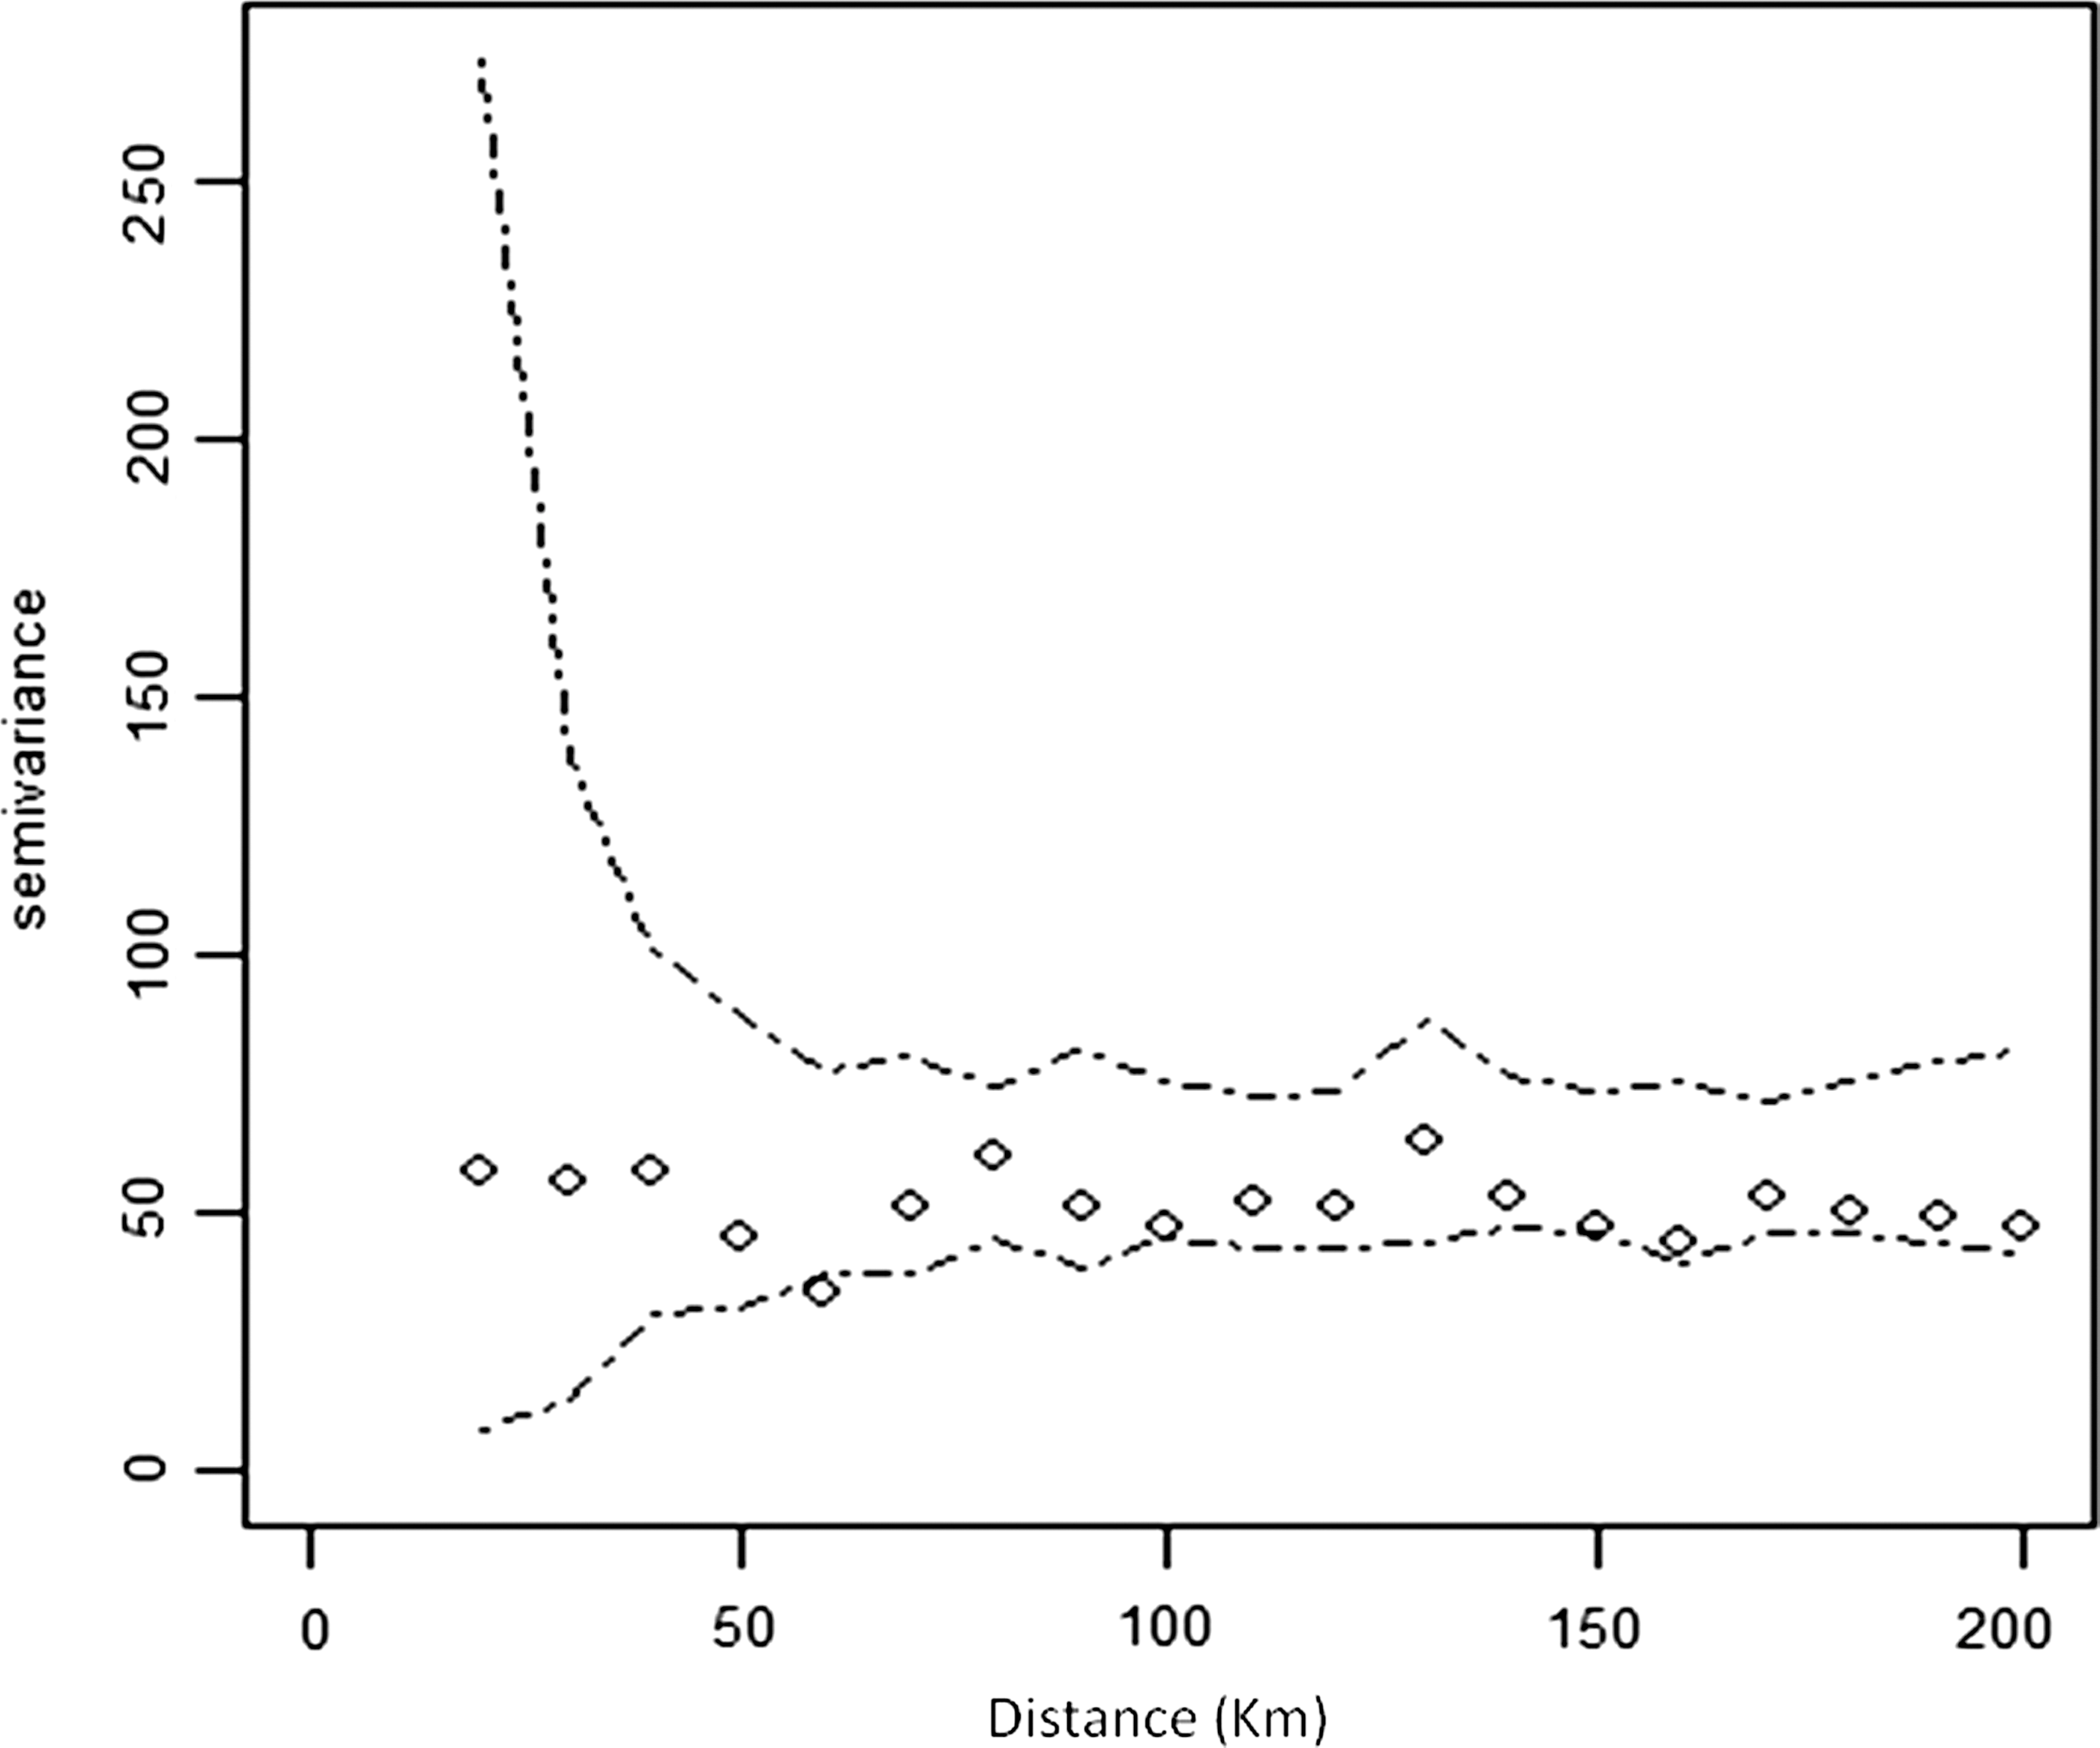
Empirical semivariogram (diamonds) and envelopes (dashed lines) of residuals from the logistic regression model that relates endemic status with SFTRI.
Figure 4 shows the ROC curve relating sensitivity and specificity of the model for different threshold values of predicted probability of risk. The area under the ROC curve was 0.969 (95% CI 0.953–0.989). The lower limit of the 95% CI is greater than 0.5 (the area under the reference line; the truly endemic and false endemic rates will be equal at any selected point on this line), indicating that on an average the sensitivity of the model was good at all possible values of false endemic rate. Both sensitivity and specificity were >90% at a predicted probability of d=0.843 (cutoff value). For all other values of the predicted probabilities, while the sensitivity remains constant, the false-positive rate increases (i.e., specificity decreases; Fig. 4). Therefore, d=0.843 was used as the probability of risk at or above which a district is classified as endemic or as nonendemic.
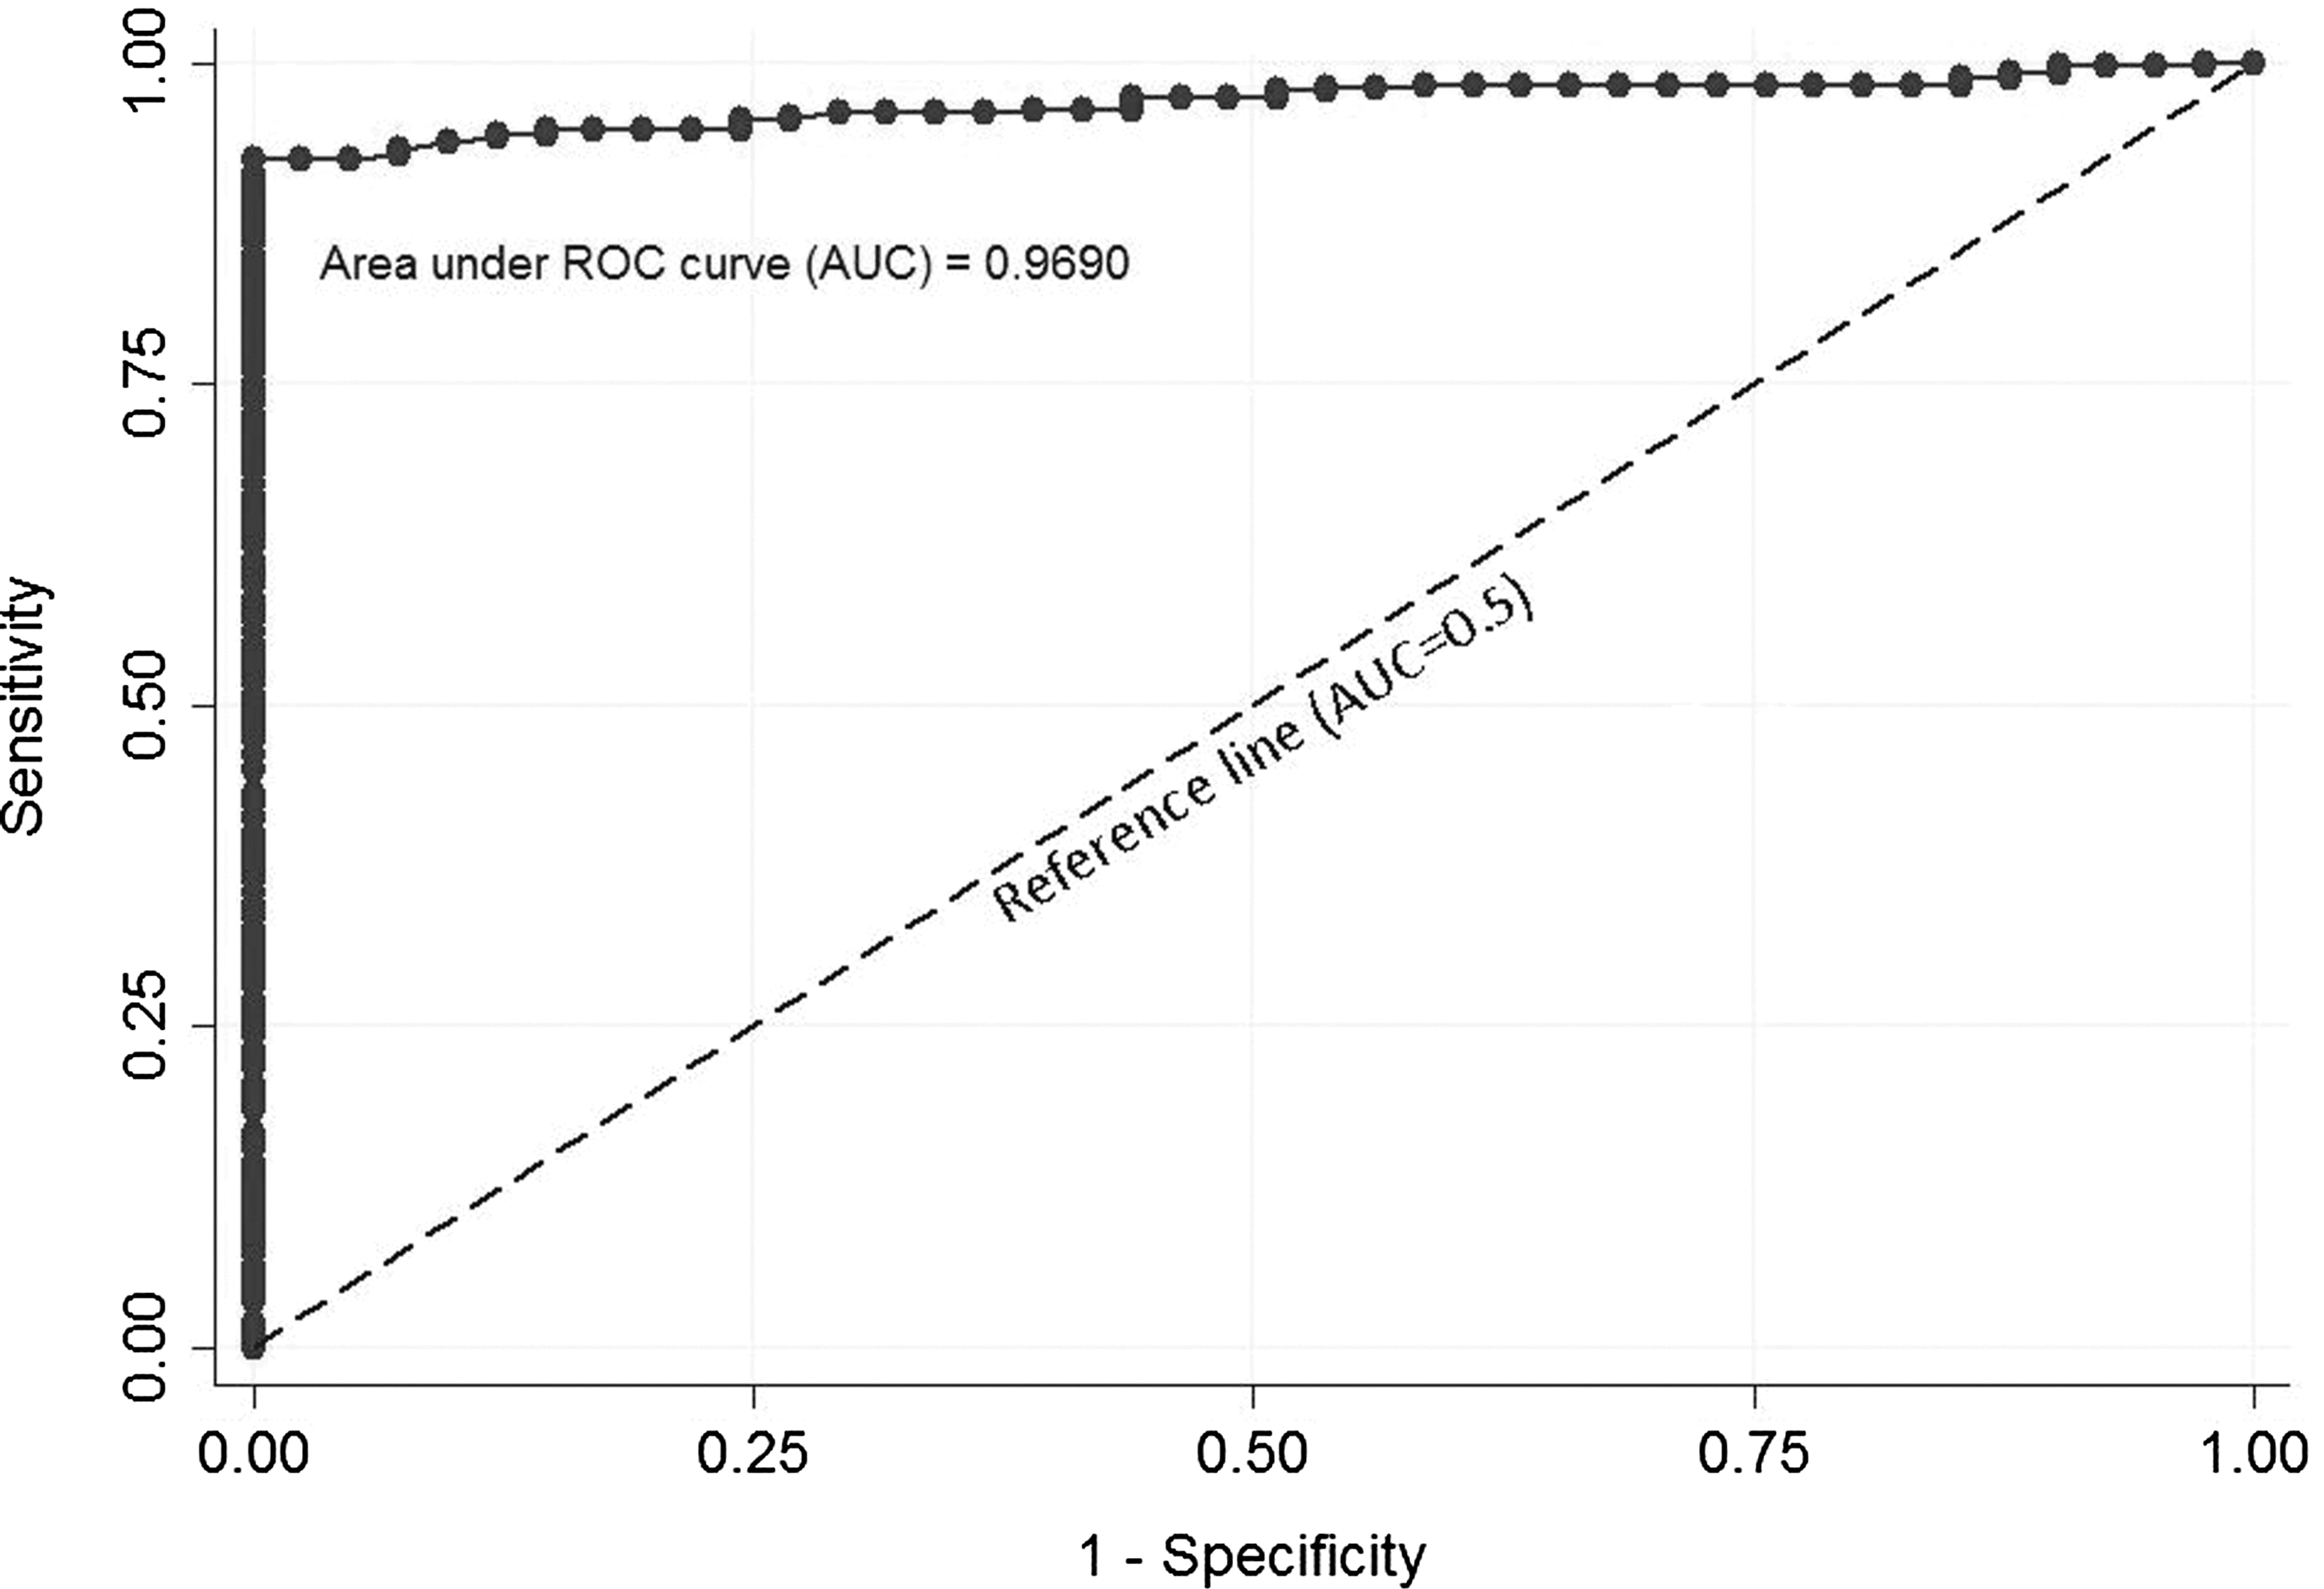
Receiver operating characteristic (ROC) curve depicting the relationship of truly endemic (sensitivity) and false endemic status (1-specificity). The area under the empirical ROC curve (AUC) and its 95% confidence interval are 0.969 and 0.953–0.984, respectively. The dotted line is the reference line (the truly endemic and false endemic rates will be equal at any selected point on this line) for which AUC=0.5.
The SFTRI value corresponds to this cutoff value (d) was estimated to be 52.1%. Based on this, a district was considered as endemic (SFTRI≥52.1) or nonendemic (SFTRI<52.1). Accordingly, of the 403 surveyed districts 336 (83.4%) and 67 (16.6%) districts were predicted to be endemic and nonendemic, respectively. The sensitivity and specificity of the model were found to be 92.8% (95% CI 88.3–95.7%) and 92.7% (95% CI 73.8–98.6%), respectively. Overall, the model prediction of filarial endemic status of districts was found to be correct in 92.8% of the total observations (n=403).
The endemic districts were further classified into different categories of risk based on SFTRI by cluster analysis. The cluster analysis identified three clusters with SFTRI values of 52.1–62.4, 62.4–70.8, and >70.8 as low, moderate, and high risk, respectively. The results indicated that among the 362 districts that were historically endemic, 26 are predicted to be nonendemic and 336 endemic. Of those predicted as endemic 95, 145, and 96 districts are under low, moderate, and high risk, respectively. Among the 41 districts historically nonendemic, 38 are predicted to be nonendemic and the remaining three are predicted as low endemic.
Filarial Ag status and transmission risk
A total of 3667 children aged <15 years were tested for filarial Ag. These children were studying in 61 schools from 61 sites spread over 56 unsurveyed districts in different states (Andhra Pradesh, Bihar, Haryana, Himachal Pradesh, Karnataka, Kerala, Madhya Pradesh, Maharashtra, Odisha, Punjab, Rajasthan, Uttar Pradesh, Uttarakhand, and West Bengal) across the country. A total of 119 children were found positive for Ag, giving a prevalence of 3.25%. The Ag-positive children were detected from 25 of the 61 sites (40.98%), and the prevalence in the positive sites ranged from 1.7% to 30.0%, with a mean value of 7.9%.
The fit of the logistic regression model describing the relationship between filarial endemicity and SFTRI was tested for its robustness by comparing its predicted values with the observed filarial Ag status for the 61 sites. The results showed that the sensitivity, specificity, and positive and negative predictive values of the model were 80% (95% CI 52.3–94.1%), 63.9% (41.4–81.8%), 60.6% (95% CI 37.4–80.0%), and 82.1% (56.2–94.8%), respectively. The spatial distribution of the sites indicating their Ag status is overlaid on the model predicted risk map (Fig. 5). The positive sites were distributed in the states of Bihar (number of sites Ag positive/number of sites tested; 2/2), Haryana (2/2), Karnataka (1/5), Maharashtra (8/10), Odisha (3/3), Punjab (1/3), Uttar Pradesh (5/6), Uttarakhand (1/1), and West Bengal (2/5).

Filarial antigenemia status in the historically unsurveyed areas, overlaid on risk map.
Predicted filariasis transmission risk for unsurveyed areas
The 190 districts hitherto unsurveyed for filariasis were classified into risk or no-risk districts based on the cutoff value of 52.1% for SFTRI (Fig. 5). Accordingly, 113 districts fall under the risk zone and the remaining 77 districts were under a no-risk zone. Of the districts under the risk zone, 22, 64, and 27 were in low, moderate, and high endemic categories.
Discussion
The GERM-based filariasis transmission risk map developed here on the GIS platform could be used for spatial delimitation of filariasis at any desired level. There are about 30 primary health centers (PHC) in each district in India. Although it was possible to make a distinction in the map at the PHC level (area, ∼150 km2; population, ∼30,000), our analysis and interpretations were made at the district level (area, ∼5340 km2; population, ∼1.7 million), since the districts have been considered as implementation units for the LF elimination program.
It has been observed that filariasis transmission risk was high in the coastal and river basins and was low in semiarid and arid zones and nil at high altitudes (Fig. 2). Furthermore, it was found that most of the historically high endemic districts fell in high-risk (high SFTRI) zones and nonendemic districts in no- or low-risk (low SFTRI) zones. Model prediction for 190 districts hitherto unsurveyed showed that 77 districts fell under no-risk zones and the remaining 113 districts were under risk zones, distributed in the states of Bihar, Haryana, Karnataka, Maharashtra, Orissa, Punjab, Uttar Pradesh, Uttarakhand, and West Bengal. These districts are to be brought under the MDA program, after making an epidemiological survey to ascertain whether they merit consideration (i.e., ≥1% human infection prevalence) for intervention as prescribed by the WHO (2001).
The variogram analysis in the present study showed that almost all of the empirical semivariance fell within their envelopes and thereby accepted the null hypothesis of spatial independence. Kleinschmidt et al. employed geostatistical modeling techniques that take into account the spatial correlation between locations for developing risk map for malaria in Mali (Kleinschmidt 2000). Boyd et al. (2005) have observed spatial dependence in filarial infections by applying Bayesian hierarchical models that accounted for spatial correlation in their data. They observed that the semivariogram increased up to a distance of 2.5 km (effective range) and thereafter it stabilized, suggesting spatial dependence in the prevalence of filarial infections. However, our logistic regression model appeared to be adequate to describe the observed endemicity and therefore the necessity for a model with spatial component did not arise. The lack of spatial correlation could be due to the large distance (∼50 km) between different locations in our study.
A multifactorial approach, considering all of the essential geo-environmental variables for LF predictive modeling (Brooker and Michael 2000, Berquist 2001, Sabesan et al. 2006, de Souza et al. 2010) has been emphasized. However, Hassan et al. (1998), by using the Normalized Difference Vegetation Index (NDVI) and land cover data as predictors, classified 77% of the sites (villages) as high or low prevalence, whereas Lindsay and Thomas (2000), by using climate variables, predicted 76% of the sites with or without microfilaraemic patients. In the present study, the sensitivity and specificity of the model was found to be 92.8% (95% CI 88.3–95.7%) and 92.7% (95% CI 73.8–98.6%), respectively. Overall, the filarial endemic status (historical data) was found to be correct in 92.8% of the total observations. The higher sensitivity and specificity observed in our study could be due to the inclusion of all the explanatory variables in the model for filariasis transmission.
In the present study, we have used the outcome variable (endemic status) as an indicator in the logistic regression. This is because the available historical data were only the summarized measures of the prevalence without denominator. In this context, we only aimed to identify the areas of risk for LF transmission and not to estimate the prevalence of cases. The data used for model quantification are based on historical surveys carried out over a period of time. In this situation, one may expect that the survey data are most likely correlated in space and time. However, the variogram analysis in the present study and the results of one of our earlier studies based on historical data (Sabesan et al. 2000) have shown that the filarial endemicity at district level are independent of both space and time. For model validation, we do not have any ideal tool to test the status of an area, i.e., in terms of “risk” at macro level. The only option available was to determine the outcome indicator of the transmission, i.e., the filarial infection (Ag) in humans at the micro level, and this could also be admitted as a limitation of the tool.
Conclusions
The LF transmission risk shows that most of the unsurveyed districts, hitherto assumed to be “nonendemic,” are falling in “risk zones” of varying degrees. The risk map could be used to identify the target populations for epidemiological survey and implementing intervention measures. Similarly, the “nonrisk” areas may be excluded from the ongoing MDA program in the country. However, surveillance is essential to detect introduction or reintroduction of LF to these areas. The GERM could be used for filariasis delimitation elsewhere in the world.
Footnotes
Acknowledgments
This study was supported by the Indian Council of Medical Research, New Delhi, India (Grant: ICMR File Ref.N0.5/8-7 (1)/2006-ECD-II). The cooperation extended by the Officials of NVBDCP, State Public Health Departments, and educational institutions in all the areas of survey in carrying out the ground truth validation is gratefully acknowledged. Dr. C. Nagaraj (Regional Office, DH & FW, Bengaluru) and Prof. C.P. Mishra (BHU, Varanasi) coordinated the survey as external experts. Dr. S. Adiga (Former Director, Regional Remote Sensing Service Centre, Bengaluru) and Prof. R. C. Mahajan (Emeritus Professor, PGIMER, Chandigarh) offered advice and suggestions at different points of time of the study. Dr. Ravi Rengachari (Former Scientist, VCRC) reviewed the manuscript critically. The technical staff of VCRC helped to conduct the field survey.
Author Disclosure Statement
No competing financial interests exist.