




Abstract
Background:
Feline cytauxzoonosis is a highly fatal tick-borne disease caused by a hemoparasitic protozoan, Cytauxzoon felis. This disease is a leading cause of mortality for cats in the Midwestern United States, and no vaccine or effective treatment options exist. Prevention based on knowledge of risk factors is therefore vital. Associations of different environmental factors, including recent climate were evaluated as potential risk factors for cytauxzoonosis using Geographic Information Systems (GIS).
Methods:
There were 69 cases determined to be positive for cytauxzoonosis based upon positive identification of C. felis within blood film examinations, tissue impression smears, or histopathologic examination of tissues. Negative controls totaling 123 were selected from feline cases that had a history of fever, malaise, icterus, and anorexia but lack of C. felis within blood films, impression smears, or histopathologic examination of tissues. Additional criteria to rule out C. felis among controls were the presence of regenerative anemia, cytologic examination of blood marrow or lymph node aspirate, other causative agent diagnosed, or survival of 25 days or greater after testing. Potential environmental determinants were derived from publicly available sources, viz., US Department of Agriculture (soil attributes), US Geological Survey (land-cover/landscape, landscape metrics), and NASA (climate). Candidate variables were screened using univariate logistic models with a liberal p value (0.2), and associations with cytauxzoonosis were modeled using a global multivariate logistic model (p<0.05). Spatial heterogeneity among significant variables in the study region was modeled using a geographically weighted regression (GWR) approach.
Results:
Total Edge Contrast Index (TECI), grassland-coverage, humidity conditions recorded during the 9th week prior to case arrival, and an interaction variable, “diurnal temperature range×percent mixed forest area” were significant risk factors for cytauxzoonosis in the study region. TECI and grassland areas exhibited significant regional differences in their effects on cytauxzoonosis outcome, whereas others were uniform.
Conclusions:
Land-cover areas favorable for tick habitats and climatic conditions that favor the tick life cycle are strong risk factors for feline cytauxzoonosis. Spatial heterogeneity and interaction effects between land-cover and climatic variables may reveal new information when evaluating risk factors for vector-borne diseases.
Introduction
C
Amblyomma americanum (lone star tick) is a known tick vector for cytauxzoonosis (Reichard et al. 2009), and Dermacentor variabilis (American dog tick) has been shown capable of transmitting the protozoa under experimental conditions (Blouin et al.1984). Cytauxzoonosis has a rapid disease course with high morbidity and high mortality, and most infections result in a disease state. Clinical symptoms can be noticed within 2–3 weeks. Currently, there is no vaccine available for this disease, and treatment options are very limited, which usually leads to fatal results in most infections. Prevention mainly relies on understanding and avoiding different risk factors, many of which could be found in a cat's living environment.
Cytauxzoonosis has been reported primarily from the south-central and southeastern parts of the United States and it is particularly a concern in the quad-state region covering Kansas, Missouri, Oklahoma, and Arkansas where relatively high numbers of infections are diagnosed each year. Using ecological niche models, Mueller et al. (2013) reported that the potential distribution of C. felis is likely to expand in the region; however, this study did not include areas in Kansas. Reichard et al. (2009) identified several environmental risk factors for cytauxzoonosis in a study that enrolled infected cats from Oklahoma. The risk factors identified in that study primarily included having residences in areas that are suitable for ticks, for instance, wooded areas and living in proximity to natural, unmanaged landscapes. Environmental risk factors for vector-borne diseases are subject to changes with geographic areas due to the natural differences in the landscape and climatic conditions.
Occurrences of tick-borne and other diseases among domestic companion animals are very often correlated with certain land-cover areas (Reichard et al. 2009, Raghavan et al. 2011), as well as prior climatic and pet owner socioeconomic conditions (Colwell et al. 2011; Raghavan et al. 2013a). However, the kinds of landscape features and climatic parameters associated with different diseases could vary based on their tick vectors. Other influential factors that have often shown to be associated with tick-borne and wildlife diseases are the different landscape metrics, such as habitat fragmentation and patch density surrounding a pet owner's residence (Uuema et al. 2009, Halos et al. 2010).
Climatic conditions play an important role in a tick's life cycle, which indirectly affects the prevalence and spatial distribution of the diseases they help transmit. While the individual effects (or main effects) of different environmental factors have been documented, knowledge of climate–land-cover interactive effects on disease occurrences is generally lacking. In addition, influential factors affecting different disease occurrences over large spatial extents have been shown to change, with some risk factors being more important in some areas than others, a phenomenon referred to as spatial heterogeneity. Accounting for interaction effects among influential factors and spatial heterogeneity therefore are important when evaluating environmental risk factors for diseases. Increasing availability of high-resolution, remotely sensed land-cover datasets and climatic data coupled with spatial analytical methods facilitated by Geographic Information Systems (GIS) allows us to closely examine such relationships between disease status and environmental factors.
The objective of this study was to retrospectively verify the individual and interactive associations of different environmental and climatic factors with cytauxzoonosis cases received at Kansas State Veterinary Diagnostic Laboratory (KSVDL) between the years 2005–2012. Candidate environmental and climatic variables were derived from publicly available, high resolution US Geological Survey (USGS) and National Aeronautics and Space Administration (NASA) sources.
Materials and Methods
Case selection
The laboratory information management system of KSVDL was searched for any samples that were submitted as suspect for cytauxzoonosis or had a confirmed diagnosis from 2005 to 2012. A sample included whole blood samples or smears for microscopic parasite screening or cats submitted for necropsy. A case was defined by positive detection of C. felis on a microscopic blood film examination, presence of schizonts within macrophages on impression smears from fresh tissue (lung, spleen, or lymph node) obtained at necropsy, or presence of schizonts within multiple organs on histopathology. Cats with a history of fever, malaise, icterus, and anorexia but no C. felis on blood film examination or schizonts within macrophages from fresh tissue or within multiple organs were considered as controls. Animals with only a blood film examination were included as controls only if they had additional findings to rule out C. felis, which included presence of regenerative anemia, cytologic examination of blood marrow or lymph node aspirate, other causative agent diagnosed, or survival of 25 days or greater post testing.
Host factors and time of case arrival
Cats were grouped based on their age (<1 year, 1–3 years, 3–5 years, >5 years), sex (male, female, unknown), and home environment (indoor, outdoor, unknown) categories. Cases/controls received at KSVDL were grouped based on the season they arrived at the diagnostic facility into four categories; fall (September to November), winter (December to February), spring (March to May), and summer (June to August).
Geocoding
Client-provided street level addresses at the time of case submissions were retrospectively verified for their accuracy using Google Maps (Google Inc., Mountain View, CA), and geographic coordinates were derived using a geocoding tool in ArcMap 10.1 software. The geographic coordinates for unmatched addresses were obtained using Google Earth software (v. 6.2.2.6613) (Google Inc., Mountain View, CA). In all, there were 69 cases (out of 77) and 123 controls (out of 164) for which precise point locations of households could be obtained. All geospatial datasets used in this study were projected (or reprojected from the original coordinate systems) in to the USA Contiguous Equal Area Conic Projection to preserve area measurements in the data. This coordinate system is based on the Geographic Coordinate System North American 1983 Geographic Datum. All original, intermediate, and processed geospatial data were stored in a SQL Server/ArcSDE 10 Geodatabase.
Landscape metrics
The publicly available 2006 National Land Cover Dataset (NLCD) (Homer et al. 2007, Multi-Resolution Land Characteristics Consortium 2013) for the study region was obtained from the USGS in a raster grid format. Land-cover grids surrounding individual case–control locations were extracted from the raster dataset using 2500-meter polygon buffers, and converted to polygon area features in ArcMap. The choice of the 2500-meter distance was made based on our assumption that the most influential environmental factors for cytauxzoonosis operated within this distance considering the host and vector home ranges. The risk of Modifiable Areal Unit Problem (MAUP) when making such choices is discussed in Raghavan et al. (2013b). The area of different land-cover types within an individual buffer was divided by the total area to generate percent land-cover values. Different land-cover classes present in NLCD are shown in Table 1, and descriptions of different land-cover classes can be found from their source website (Multi-Resolution Land Characteristics Consortium 2013). In addition to deriving percent land-cover areas, the following landscape metrics were derived from the NLCD dataset surrounding case–control locations. Total Edge Contrast Index (TECI), calculated by
Years represent the time period during which satellite images of land cover were captured for creating the dataset, including multiple images within a year. Resolution indicates the fineness of ground data as captured by a satellite image, shorter resolution meaning higher clarity; and, spatial scale indicates the scale for which interpretations are appropriate.
where eik
is the total length of edge between patch types i and k, E* is the total length of edge in landscape, dik
is the dissimilarity (edge contrast weight) between patches i and k. Patch richness (the number of patch types present in a landscape) and the largest patch index (LPI) were calculated by
where aij is the area of patch ij and A is the total landscape area, were estimated using Fragstats 4.0 (McGarigal et al. 2012). TECI captures the percentage of all edge-lengths between land-cover types in NLCD, which essentially represents the adjacency between forested areas, mixed forest, grassland, built-up areas, and other land-cover types in this study. The choice of these pattern metrics was made based on our interest in identifying case associations with habitat fragmentation or any predilection for the presence of a particular patch in the surrounding landscape where cats had lived.
Climate
The Prediction of Worldwide Renewable Energy (POWER) web portal at the NASA Langley Research Center (Eckman and Stackhouse 2012) makes data available that includes daily estimates for various biologically relevant climate parameters (daily maximum, minimum and average daily temperatures, dew point, relative humidity, and precipitation) from the year 1983 to present day. NASA satellite and meteorological data products redistributed through POWER web tools are validated with surface-based solar and meteorological measurements to quantify uncertainties (White et al. 2008, 2011). POWER data were converted to raster layers covering the study region in ArcGIS, and the weekly mean estimates of maximum, minimum and average temperatures (°C), weekly mean diurnal temperature range (DTR) (difference between daily maximum and minimum temperature averaged over a 7-day period), precipitation (mm), and relative humidity (%) were derived from independent raster layers representing these climate parameters for up to 4 months prior to the dates on which cases were received at KSVDL. A representative value for each climatic parameter was derived by averaging weather parameter estimates to case–control locations.
Statistical analyses
Strengths of variable associations with cytauxzoonosis status in cats and geographical variability in risk factor influences were evaluated in three steps. First, the relevance of candidate variables to be used in modeling procedures was verified using univariate logistic regressions, and those with p≤0.2 were selected for further analysis. Care was taken not to remove candidate variables that were deemed clinically relevant (Hosmer and Lemeshow 1990). Multicollinearity among screened variables was tested by estimating the variance inflation factor (VIF) using the PROC REG/TOL VIF option in SAS (SAS Cary, NC) in which all variables with a VIF≥10 were considered to indicate multicollinearity (Allison 1999). Observations for all land-cover, soil, and climate variables were kept in their original measurement units and were continuous. In addition to testing individual variable effects, significance of various second-level interaction effects on the response was also verified. In the second step, screened variables were selected as parameters for a global multivariate logistic model in a stepwise (both directions) procedure which takes the form,
where
where tr (S) is the trace of the hat matrix. The model performance was measured using deviance chi-squared goodness-of-fit test (p<0.05 indicates poor fit). The predictive ability of the model was evaluated using the area under receiver operating characteristic (AUC) curve values. Odds ratios (OR) and 95% confidence intervals (CI) in the final model were used for interpreting risk factor associations with cytauxzoonosis status in cats. Potential confounding effects of host factors, age group of cats (<1 year old as reference category), sex (female as reference category), and home environment (outdoor as reference category) on predictor variables were estimated by including them one at a time in the final logistic model. If such inclusion changed the coefficients of explanatory variables by at least 10% or more, then the adjusted ORs were recorded from those models.
Variables retained in the final logistic model (global) were entered in a geographically weighted regression (GWR) model, which is a spatially explicit regression modeling approach for examining spatial nonstationarity of responses (disease outcomes in this study) by allowing model coefficients to vary continuously over space to represent local relationships. Because case status in this study was recorded in a binary format (0=negative diagnosis for cytauxzoonosis and 1=positive diagnosis), a logistic form of GWR was used, which incorporates a set of geographical locations to the models, taking the form
where c is a constant, pi
is the probability (expectation) of a positive diagnosis, i, ai
is the determinant variable surrounding case–control location, fx
is a function enabling the regression parameter associated with a to vary smoothly over the study region, and ɛi
is random error. GWR estimates the parameters for each observation at location i using all observations with assigned weights through a weighting scheme according to spatial proximity, which is represented by Euclidean distances in this study. Nearer locations gain higher weights and vice versa. Two types of weighting functions are generally used—fixed and adaptive kernels. The latter ensures a certain number of nearest neighbors as local samples and better represents the degree of spatial heterogeneity (Fotheringham et al. 2002, Páez et al. 2002) and was the choice in this study. The adaptive kernel method is based on a bi-square distance decay function as follows (Fotheringham et al. 2002),
where, dmax is the maximum distance from the mth farthest case–control location (m is the selected optimal number of neighboring points). The number of nearest neighbor points was chosen by AIC minimization method, which is preferable because it considers the possible variation in degrees of freedom among models centered on various observations (Fotheringham et al. 2002).
The logistic GWR generates a set of parameter estimates for the determinant variables at each case–control point location, which can be used to visually analyze spatial variations in the risk posed by determinant variables to cytauxzoonosis infection in cats. In addition, a pseudo t-statistic is also calculated to indicate the significance of the parameters, which is obtained by dividing the parameter estimates by their standard errors (Fotheringham and Brunsdon 2001). Parameter estimates and t-statistics were mapped in ArcGIS to reveal the spatial variations of risk by different determinant variables. Although these t-values cannot be interpreted in a formal statistical sense (Waller et al. 2007), they are often used as exploratory tools to highlight local areas where interesting relationships appear to be occurring. An interpolation method, the inverse distance weighted (IDW) algorithm, was employed to generate parameter estimate surfaces. IDW assumes that the predictive spatial surface is driven by local variations that are captured through the neighborhood (Watson and Philip 1985), and therefore was considered to be appropriate in the context of this study.
Results
Locations of cases enrolled in the study were found predominantly in the eastern half of Kansas and adjacent states (Fig. 1). This region receives relatively higher rainfall than the western portion of Kansas, roughly totaling 35–45 inches per annum compared with 15–20 inches in the west (Goodin et al. 2004). This region is also relatively more densely populated than western Kansas. Descriptive statistics for case–control host factor characteristics are provided in Table 2. Inclusion of indoor versus outdoor cats in the study did not alter model performance, indicating that cats are equally at risk from all risk factors identified in the study regardless of their home environment.
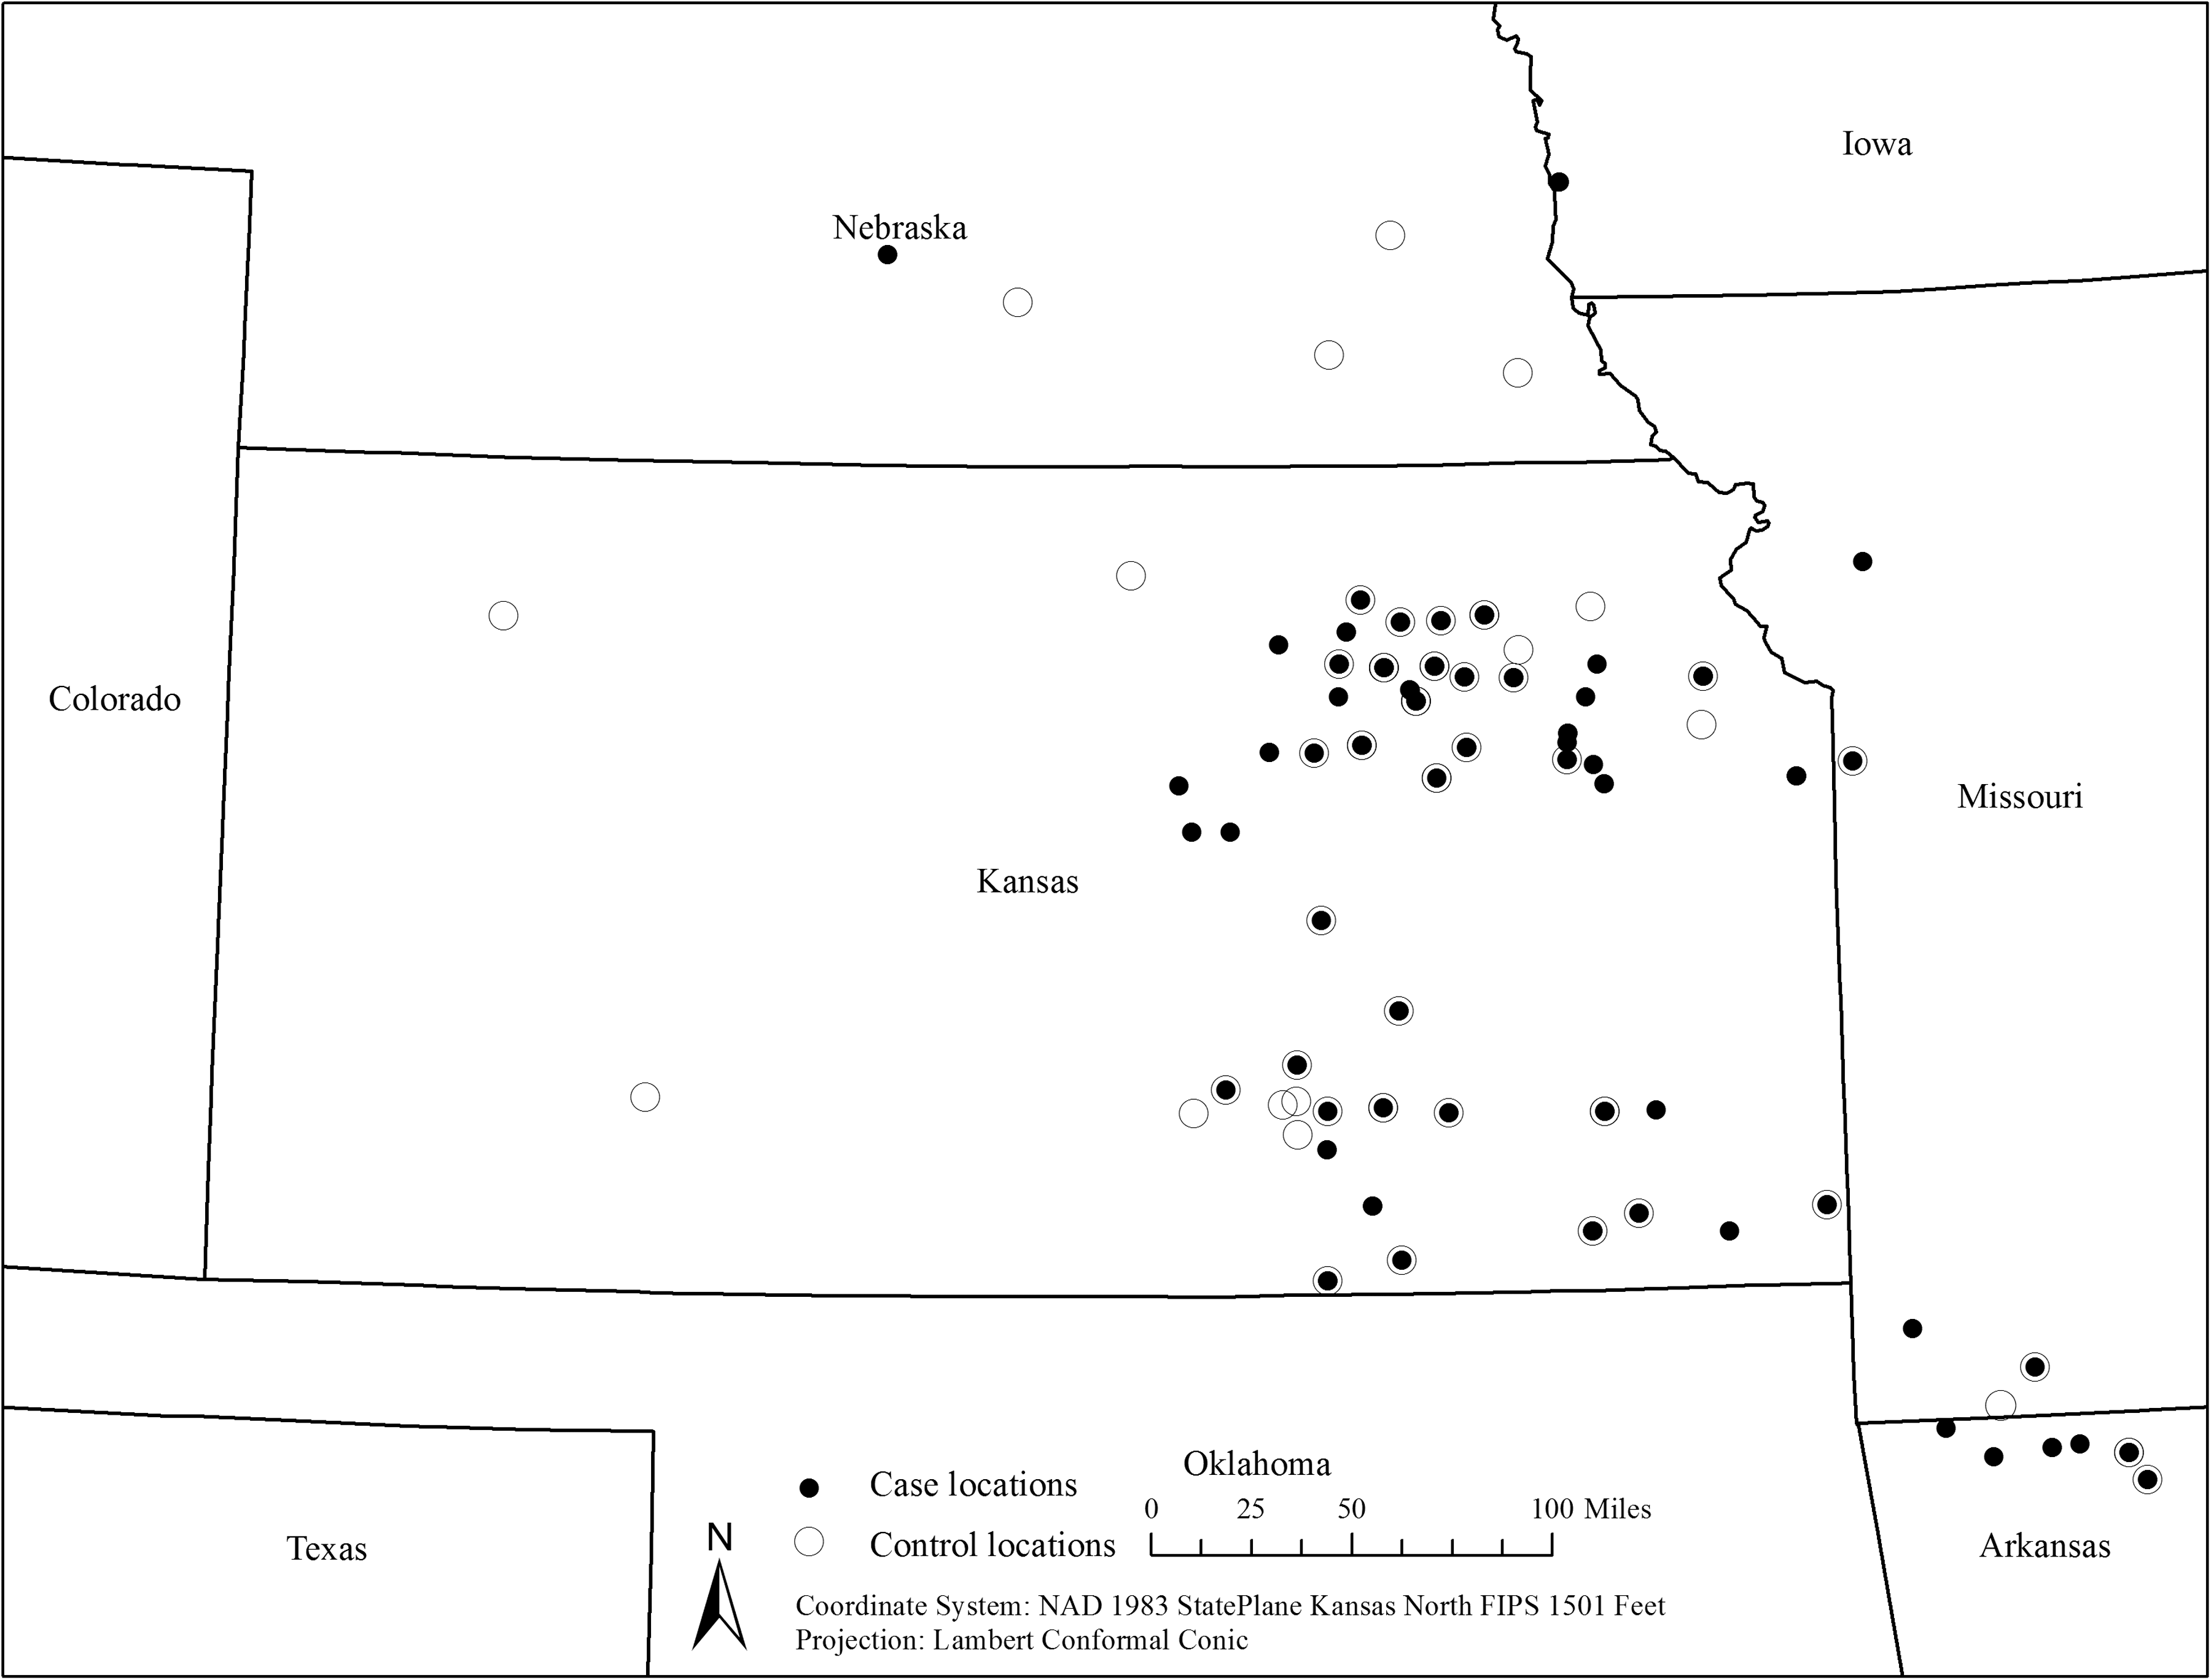
Case–control locations in the study region.
Among all the environmental and climatic variables screened with a liberal p value (0.2), eight were found to be significantly associated with the case status (Table 3), and were selected as candidate variables for multivariate logistic model (global). However, TECI, % grassland area within 2500 meters surrounding case–control locations (henceforth “grassland area”), relative humidity recorded during the 9th week prior to case arrival at the hospital (henceforth “9th week humidity”), and a first-level interaction term, “weekly mean DTR recorded 4 weeks prior to case arrival×% mixed forest area” (henceforth “DTR×mixed forest”) were retained as significant variables at the final multivariate logistic model (global) (Table 4). The differences in statistical distribution of TECI, grassland area, and humidity conditions surrounding case–control locations are provided in Figure 2. The inclusion of host factors, age, sex, home environment, and time of arrival at hospital did not change the model parameter estimates by 10% or more. The chi-squared deviance goodness-of-fit test did not indicate model inadequacy (p>0.05), and nonlinearity in logit was not noted. The AIC value of the final model was noted as 354, and the predictive ability of the model measured by AUC value was noted as 0.72.

Distribution of percentage Total Edge Contrast Index, grassland vegetation, and relative humidity surrounding case–control locations in the study region.
Mixed forest is defined by the Multi-Resolution Land Characteristics Consortium (MRLC) (2013) as areas dominated by trees generally greater than 5 meters tall and greater than 20% of total vegetation cover. Neither deciduous nor evergreen species are greater than 75% of total tree cover.
Grassland is defined by MRLC (2013) as areas dominated by grammanoid or herbaceous vegetation, generally greater than 80% of total vegetation. These areas are not subject to intensive management such as tilling, but can be used for grazing.
Candidate variables were derived from different geospatial thematic groups using Geographic Information Systems and Remote Sensing methods.
OR, odds ratio; CI, confidence interval; DTR, diurnal temperature range.
Not significant at p<0.05.
SE, standard error; OR, odds report; CI, confidence interval; DTR, diurnal temperature range.
All variables retained in the multivariate logistic model (global) were entered as parameters in a multivariate logistic GWR model (local), which resulted in a substantial reduction in AIC value (ΔAIC=44) compared to the global model. The difference between the local and global model AIC values was significant (p<0.05) in an analysis of variance (ANOVA) F-test. The AUC value for local model was noted as 0.88, a substantial improvement in model sensitivity/specificity, indicating spatial heterogeneity in the effect of different explanatory variables on case–control occurrences in the region. No notable geographical variation in the influences of climate variables (humidity and “DTR×mixed forest”) on case–control distribution could be seen; however, a strong positive relationship between TECI and case–control distribution was evident toward the southeastern region in a northwest to southeastern gradient (Fig. 3), and a positive relationship in the opposite direction between grassland areas and case–control distribution was present in a southeast to northwestern gradient (Fig. 4). A summary of GWR model parameters and their directions of association is presented in Table 5.
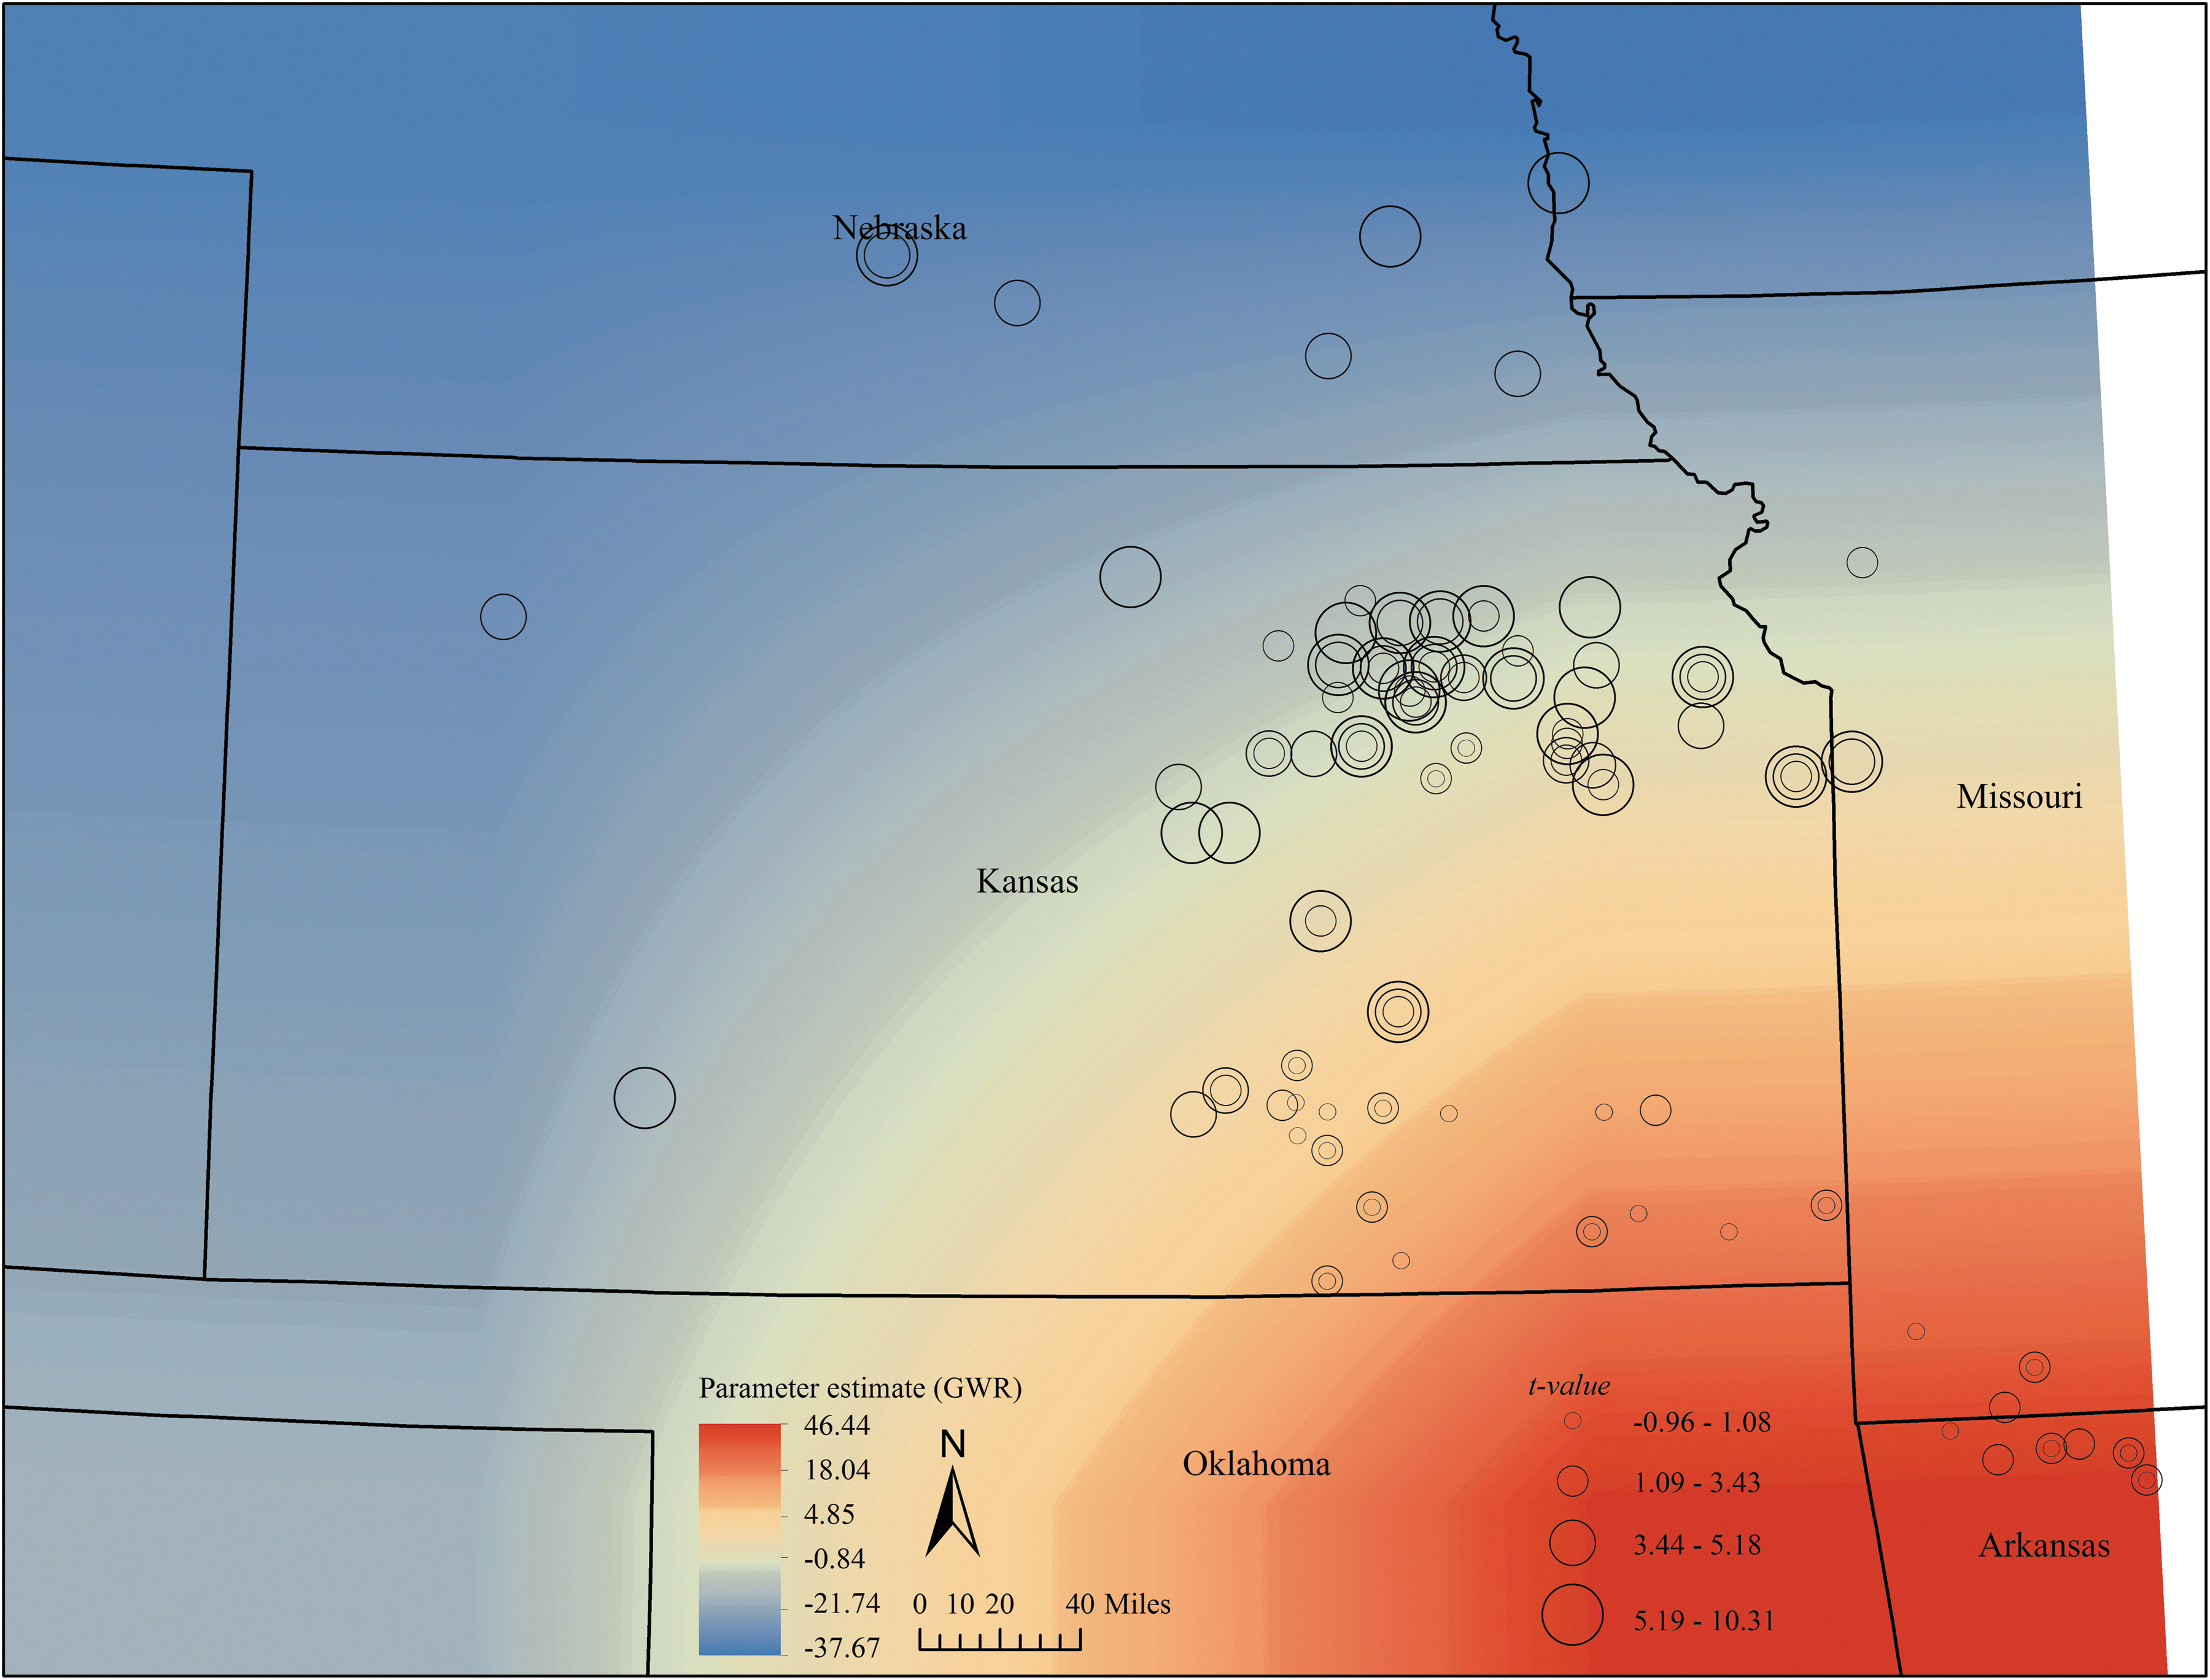
Interpolated (inverse distance weights) parameter estimate surface and t-values of Total Edge Contrast Index association with case–control location in the study region (n=case 69, control=123). Color images available online at
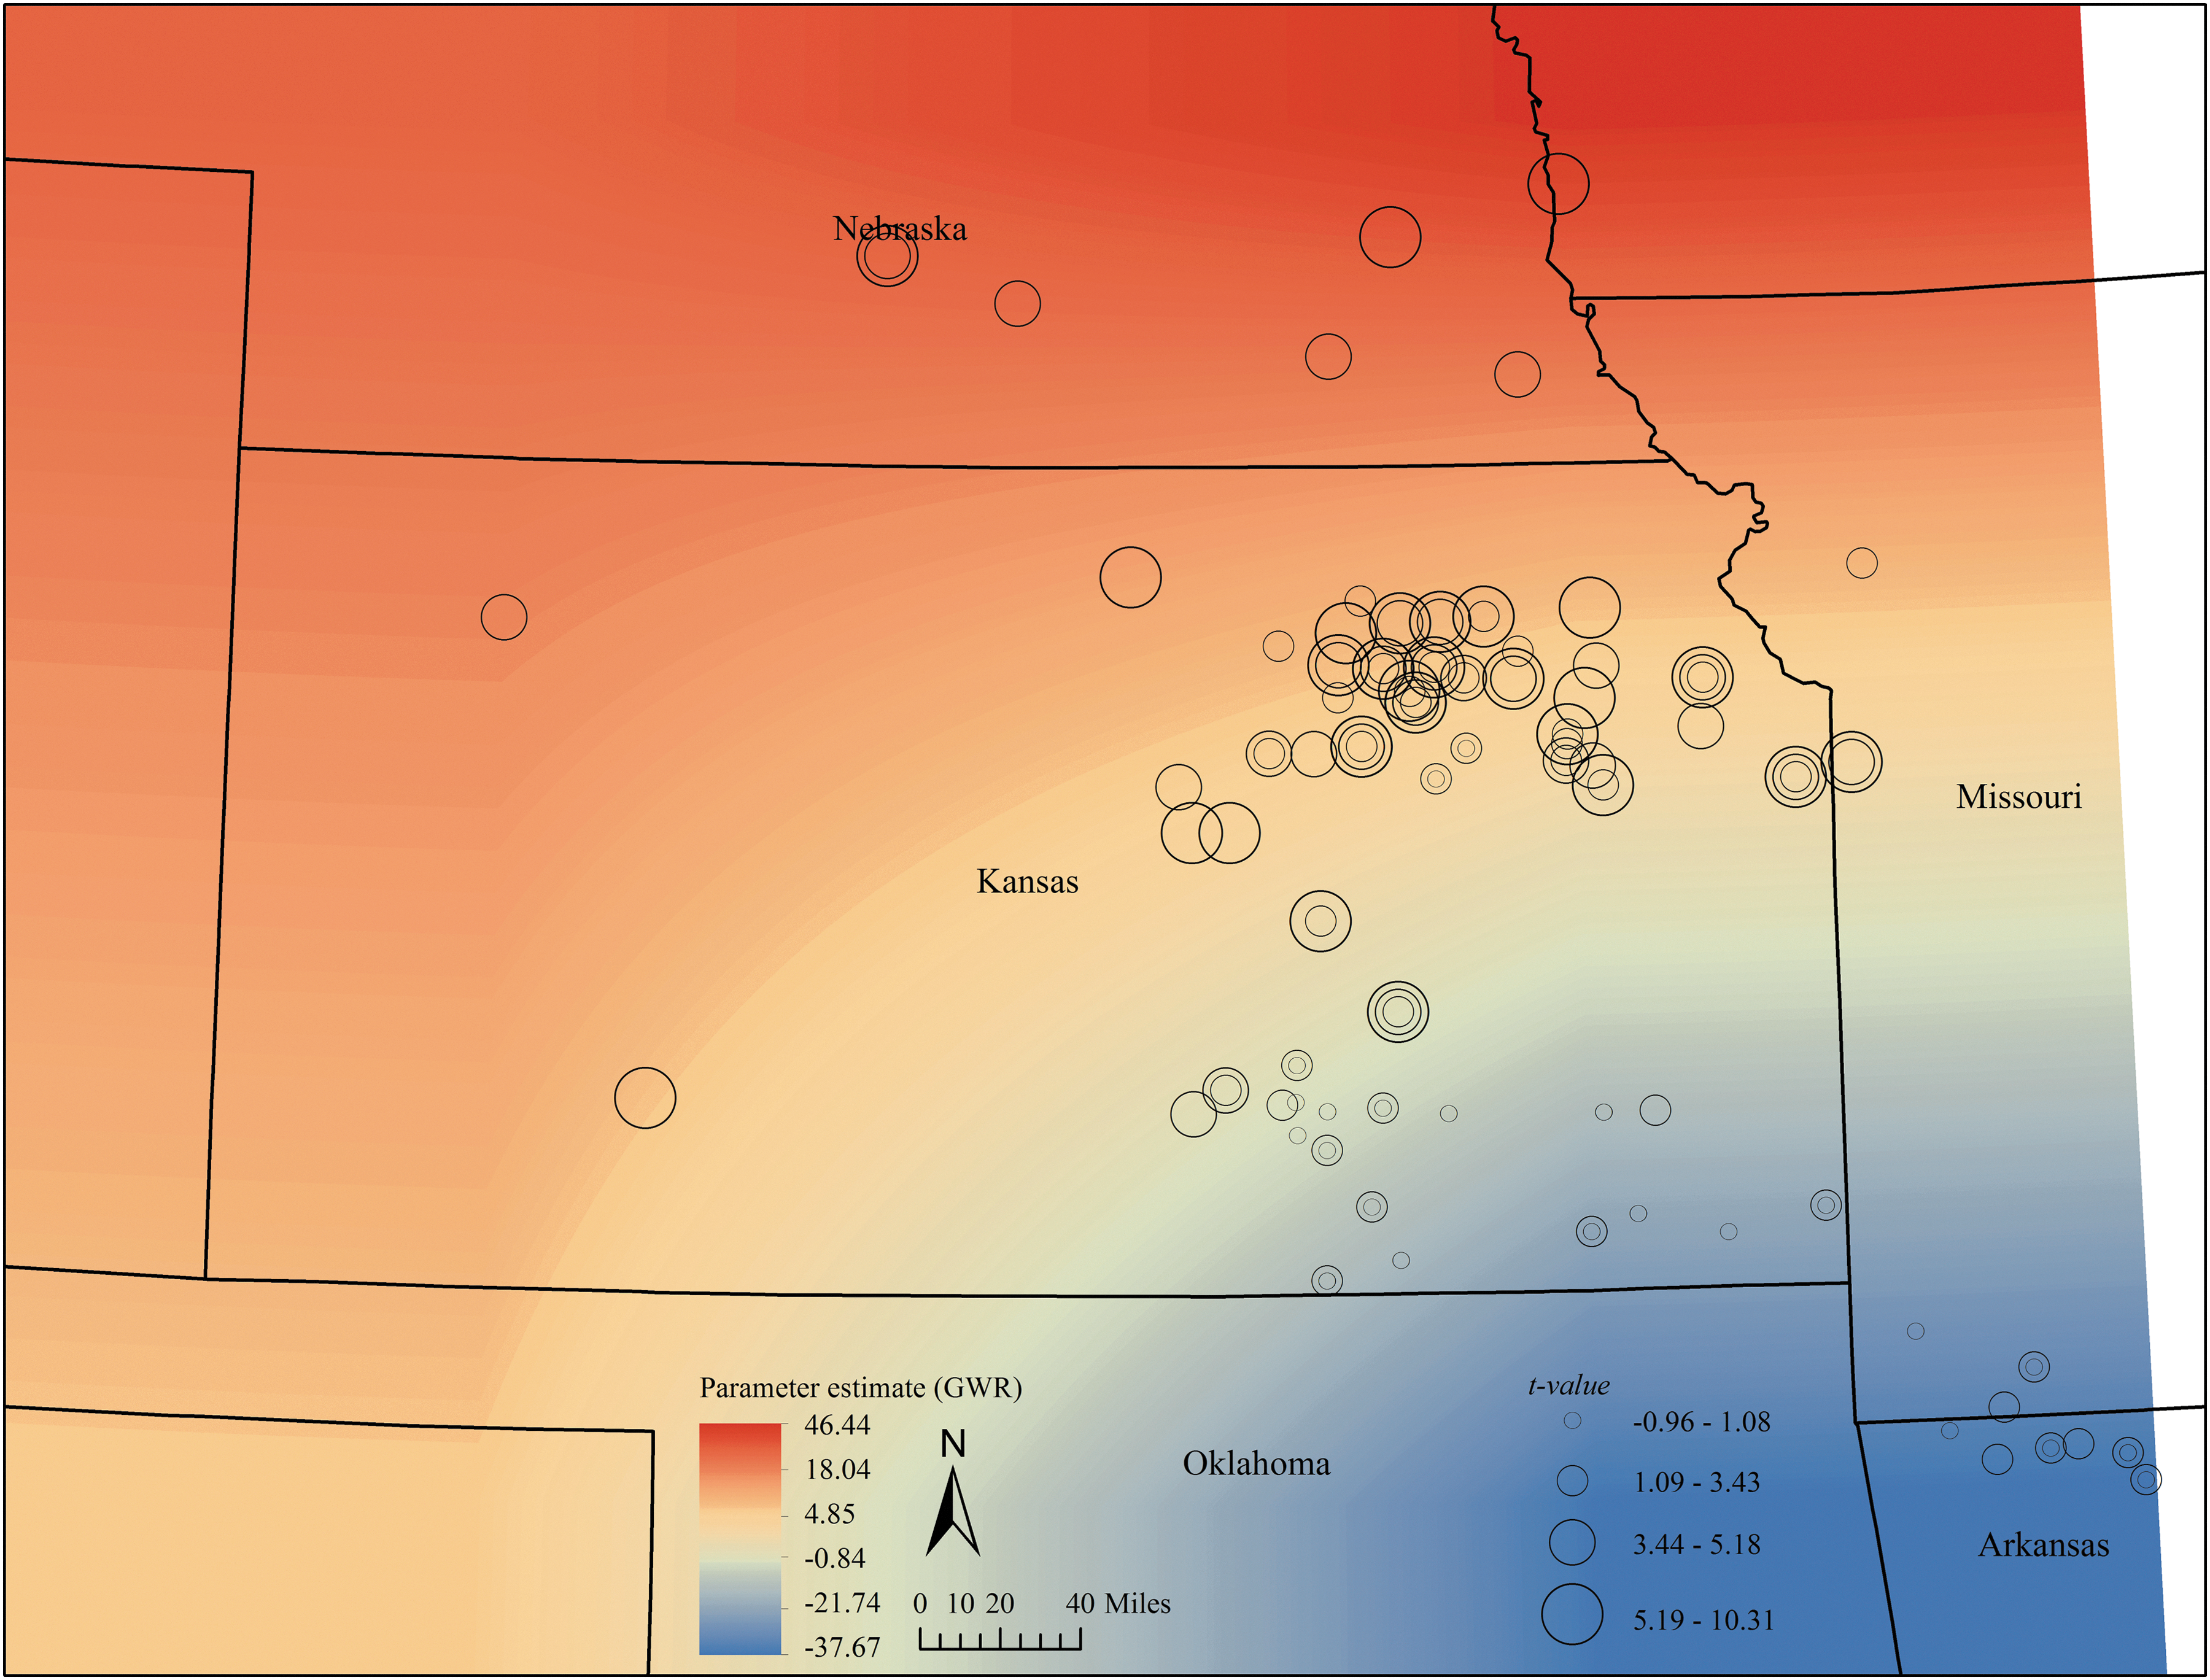
Interpolated (inverse distance weights) parameter estimate surface and t-values of percentage grassland area association with case–control location in the study region (n=case 69, control 123). Color images available online at
The magnitude of co-variate association with cytauxzoonosis status among cats in the study region varied to different degrees at different locations. % positive and % negative measures indicate the directions of a variable relationship with cytauxzoonosis status in cats. Positive being influential and negative noninfluential toward the disease status.
DTR, diurnal temperature range.
Discussion
This study used cases received at a diagnostic laboratory, geospatial analytical methods, and publicly available data sources for identifying novel environmental and climatic risk factors for cytauxzoonosis, enhancing the current eco-epidemiological understanding of this disease. All of the identified risk factors can be related to the role of A. americanum ticks in the region, whose control is essential for managing not only cytauxzoonosis but also other zoonotic diseases, including tularemia (Raghavan et al. 2013b) and human monocytic ehrlichiosis.
TECI, a measure of landscape fragmentation, is a risk factor for feline cytauxzoonosis in the south-central and southeastern portions of the study region bordering Oklahoma, Missouri, and Arkansas. Landscape fragmentation leads to more and smaller habitat patches, increased isolation among habitat patches, decreased complexity of patch shape, and higher proportions of edge habitats (Saunders et al. 2002), and studies have shown the risks associated with fragmented landscape for tick-borne diseases (e.g., Halos et al. 2010, Li et al. 2012). Fragmented landscapes can support habitats for wildlife carriers of C. felis and influence the abundance of small mammals, many of which are potential hosts for young and adult ticks. Suburban developments at the edges of forest/woodland areas also increase human and pet exposures to infected ticks.
In contrast to the geographic pattern of TECI risk to cats, grassland vegetation surrounding pet owner residences was a significant risk to cats in the north-central and northwestern areas in the study region. The spatial differences in the influences of these risk factors can have prevention/management implications and were identifiable thanks to the GWR modeling approach, which also improved the overall model predictive ability by applying local weights to the parameter estimates. The risk of higher grassland acreage surrounding homes has been identified as a significant risk for feline tularemia in Kansas (Raghavan et al. 2013b), one other tick-borne disease that is also transmitted by A. americanum among other ticks. Habitats for A. americanum include grassland areas, although the wooded edges along fence lines in pastures and home backyards may also support their life cycle. Grasslands in the study region are less intensively maintained and are generally used only for grazing. Infection may be obtained from pathogen-carrying ticks while cats are outdoors, from pet owners, or from other pets in the household that return home after outdoor activities with infected ticks attached.
Humidity conditions recorded 9 weeks prior to case arrival is a significant risk factor for cytauxzoonosis in the study region. The 2500-meter areas surrounding case locations recorded relatively higher humidity conditions during the 9th week prior to case arrival compared to areas surrounding their control counterparts (Fig. 2), and significant differences could not be seen for other weeks. This finding is similar to Raghavan et al. (2013b), wherein higher humidity conditions surrounding case locations were recorded during the 8th week prior to feline tularemia case arrivals from the same region. Brown et al. (2011) noticed elevated humidity (30-year average) to be associated with higher numbers of human tularemia cases in Missouri, and studies from other regions have shown similar associations as well (Estrada-Peña 2002, Diuk-Wasser et al. 2010). Although humidity has been adequately shown to play an important role in a tick's life cycle, any biophysical mechanisms that favor cytauxzoonosis incidences following higher humidity conditions in the landscape are not clear. The mechanistic basis for a humidity–cytauxzoonosis connection is likely to involve multiple pathways and needs further investigations. Higher humidity conditions recorded during late spring and summer months also coincide with higher human outdoor activities, which may indirectly increase their pet exposure to ticks.
When evaluating the effects of influential environmental factors, studies have typically treated past climate (or future climate-change scenarios) and land-cover effects on disease outcomes separately (Lindgren and Gustafson 2001, Jackson et al. 2006, Randolph 2010, Raghavan et al. 2011). However, microclimatic conditions that affect a tick's life cycle and perhaps its ability to sustain and later transmit different pathogens to hosts could be regulated by habitat type and other physical factors such as soil moisture and elevation (Randolph and Storey 1999). Studies that address climate–land-cover interactions on disease outcomes can be rarely found. The significant interaction effect noted between DTR and mixed forest in the present study indicates a combined effect of climate–land-cover on cytauxzoonosis outcome. Another interaction term, “humidity×grassland” was significant at the p=0.2 level, but this variable was not retained in the final multivariate logistic (global) model. In simple terms, the interaction between these two factors indicate that the effect of DTR on the odds of diagnosing positive cytauxzoonosis cases varies with different values of percent of mixed forest area surrounding case locations, and vice versa.
The spatio-temporal changes in temperature, precipitation, and humidity that are expected to occur under different climate-change scenarios will affect the biology and ecology of vectors and intermediate hosts and consequently the risk of disease transmission (Githeko et al. 2000). Diurnal temperature range has been suggested as an index of climate change (Karl et al. 1991, Braganza et al. 2004), and DTR has been decreasing since the 1950s due to increasing daily minimum temperature (Tmin ) at a faster rate than the daily maximum temperature (Tmax ), and also due to Tmin decreasing at a slower rate than Tmax . For most parts of the United States, trends show that Tmax have remained constant or have increased only slightly, but Tmin values have increased at a faster rate (Karl et al. 1991, 1993). Host-seeking behavior of ticks (Randolph and Storey 1999) and the survival of parasites they carry are strongly influenced by DTR (Ochanda 2006). Any such effect on the vector A. americanum, or the parasites they carry, such as C. felis, has not been reported before and new investigations will help us understand the mechanical basis of such association.
Humidity and DTR are correlated because higher humidity conditions reduce the sun's ability to heat the boundary layer (roughly 2 km of the lowest atmosphere), which narrows temperature differences in a given day. We kept both of these variables in the multivariate model because the interpretation for interaction terms are made differently from main-effect interpretations. Unlike the direct effect of humidity, “DTR×mixed forest” points to a more complex problem; i.e., how do climate and the physical environment interact in influencing the outcome of a disease? One plausible scenario could be that ticks in areas with a certain percentage of mixed forest are more likely to transmit C. felis when DTR conditions are within a certain range but not others.
Identifying associations between climatic factors and disease outcomes is often challenging due to other confounding factors (Patz et al. 2003), but such knowledge is vital for quantifying any role that climate change may be playing toward the amplification and/or spatial expansion of disease incidences. Tick-borne diseases may share similar climate constraints due to the broad role climate plays in the thermoregulation of vector growth, as well as in tick reproduction and survival. Therefore, the identification of humidity and for the first time the combined “DTR×mixed forest” effects on cytauxzoonosis potentially has implication in our broader efforts to understand the linkage between climate change and tick-borne disease. Whether there is consistency in such effects across diverse vector populations and geographic region needs to be studied.
Conclusions
TECI, a measure of habitat fragmentation, and higher grassland acreage surrounding pet owner residences are risk factors, with some regional variability, for feline cytauxzoonosis. Humidity conditions recorded 9 weeks prior to case arrival and the combined effect of diurnal temperature range recorded during the 4th week prior to case arrival and higher mixed forest acreage surrounding residences are strong predictors for cytauxzoonosis throughout the region. The identification of climate variable associations with cytauxzoonosis in this study is significant in the context of climate change impacts on tick-borne diseases. A. americanum is a growing concern in the study region due its potential to transmit many zoonotic and animal diseases. Studies on the biology, distribution, and ecology of important tick species in the region are generally lacking and are warranted.
Footnotes
Acknowledgments
This study was supported by the Kansas State Veterinary Diagnostic Laboratory (KSVDL). We thank James M. Hoell, SSAI at the NASA Langley Research Center, for his excellent help in providing methods to more easily access the POWER data used in the analyses. The NASA Langley Research Center POWER Project is funded through the NASA Earth Science Directorate Applied Science Program.
Author Disclosure Statement
No competing financial interests exist.