
Abstract
A multiplex fluorescence microsphere immunoassay (FMIA) was used to detect bovine and ovine IgM and IgG antibodies to several Rift Valley fever virus (RVFV) proteins, including the major surface glycoprotein, Gn; the nonstructural proteins, NSs and NSm; and the nucleoprotein, N. Target antigens were assembled into a multiplex and tested in serum samples from infected wild-type RVFV or MP12, a modified live virus vaccine. As expected, the N protein was immunodominant and the best target for early detection of infection. Antibody activity against the other targets was also detected. The experimental results demonstrate the capabilities of FMIA for the detection of antibodies to RVFV structural and nonstructural proteins, which can be applied to future development and validation of diagnostic tests that can be used to differentiate vaccinated from infected animals.
Introduction
R
More than 30 species of mosquitoes belonging to six different genera can function as vectors for RVFV (Moutailler et al. 2008, Tantely et al. 2015). Outbreaks of the epizootic RVF are preceded by the mass hatching of RVFV-infected eggs after a heavy rainfall (Davies et al. 1985, Logan et al. 1991). Aedes mosquitoes can transmit the virus to humans and domestic animals (Rostal et al. 2010, Bird and Nichol 2012). During interepizootic periods, the mortality rates in adult sheep and cattle are 20–30% and abortion rates approach 70% (Bird and Nichol 2012). One impact of climate change is the movement of virus-carrying mosquitoes into more temperate regions (Martin et al. 2008, Chevalier et al. 2011).
RVFV is an enveloped virus in the family, Bunyaviridae, genus, Phlebovirus (Bishop et al. 1980, Elliott 1997) and possesses a single-stranded tripartite RNA genome of negative and ambisense polarities (Lara et al. 2011). The genome consists of large (L), medium (M), and small (S) segments. The L segment encodes the RNA-dependent RNA polymerase (Muller et al. 1991). The M segment encodes the surface envelope glycoproteins Gn and Gc, which bind to the target host cell during infection and are targets for neutralizing antibody. The M segment also encodes the nonstructural protein, NSm, which exists as 78 and 14 KDa isoforms. The NSm protein blocks apoptosis during virus replication (Won et al. 2007). The S segment encodes two proteins: the nucleoprotein (N), which surrounds the viral genome inside the virion, and the nonstructural protein, NSs, which inhibits innate host responses by blocking interferon production (Billecocq et al. 2004, Blakqori et al. 2007). Since NSm and NSs are nonessential for virus replication in culture, viruses that possess deletions in NSs and/or NSm are being developed for use as modified live virus (MLV) vaccines (Bird et al. 2008, 2011, Von Teichman et al. 2011, Weingartl et al. 2014).
Several ELISA-based tests have been developed to detect antibodies against various structural and nonstructural components of RVFV (Jansen Van Vuren et al. 2007, McElroy et al. 2009, Jäckel et al. 2013). These assays have proved to be safe alternatives to gold standard techniques, such as the virus neutralization test and virus isolation. The detection of antibodies to the nonstructural proteins, NSs and NSm represents possible differentiate infected from vaccinated animals (DIVA) targets for use with NS gene-deleted MLV vaccines. A recent study described the development of a fluorescent microsphere-based immunoassay (FMIA) or Luminex® for the simultaneous detection of IgG antibodies against recombinant N and Gn proteins in ovine sera (van der Wal et al. 2012). The utility of the test as a DIVA marker was demonstrated by following the antibody reactivity of sheep vaccinated with a recombinant Gn protein. Previous works describing serological responses to recombinant viral proteins, N, Gn, Gc, NSs, and NSm are summarized in a recent publication (Faburay et al. 2013). In this study, we combined four recombinant RVFV proteins into a single FMIA that was used to measure RVFV IgG and IgM in ovine and bovine samples from experimentally infected animals.
Materials and Methods
Reagents and antibodies
Gelatin from cold-water fish skin and Tween-20 were purchased from Sigma-Aldrich. 1-Ethyl-3-(3-dimethylaminopropyl) carbodiimide hydrochloride (EDC), N-hydroxysulfosuccinimide (sulfo-NHS) were supplied by Pierce. Streptavidin-conjugated phycoerythrin (SA-PE) was purchased from Moss, Inc. Carboxylated MagPlex® microspheres were obtained from Luminex Corporation. Antibody reagents included biotin-conjugated rabbit anti-sheep IgG (H+L) and goat anti-bovine IgG (Thermo Scientific Pierce Antibodies), rabbit anti-sheep IgM (Fc specific) (MyBioSource, Inc.), sheep anti-bovine IgM (Bio-Rad AbD Serotec), rabbit anti-mouse IgG (H &L) (Rockland), anti-sheep and anti-bovine whole serum (Sigma-Aldrich), and mouse anti penta-His monoclonal IgG (Qiagen GmbH).
Production and purification of recombinant proteins
The baculovirus-produced Gn protein was kindly provided by Bonto Faburay and prepared as described in Faburay et al. (2013). A plasmid containing the RVFV ZH-548 small gene was generously provided by Friedemann Weber, University of Marburg. The N and NSs coding regions were subcloned into pcET30EK/LIC plasmid for protein production. NSm was produced in bacteria using a pHUE expression vector system (Catanzariti et al. 2004). Briefly, the 501 bp NSm gene sequence was obtained from GenBank (acc. no. AFD98306.1). Restriction sites for SacII and HindIII were added to the 5′ and 3′ ends, respectively. After codon optimization, the gene construct was synthesized (GenScript), ligated into the pHUE expression vector (Catanzariti et al. 2004), and transformed into BL-21 (DE3) Escherichia coli (Invitrogen).
For the production of recombinant proteins, bacteria were cultured in LB medium with ampicillin at 37°C until the OD600 reached at 0.4–0.6. Gene expression was induced by adding isopropyl β-D-1-thiogalacto-pyranoside (IPTG) to a final concentration of 1.0 μg/mL, and incubation continued for an additional 4 h with shaking. Bacteria were pelleted by centrifugation at 4000 × g for 10 min at 4°C, subjected to three freeze-thaw cycles, and re-suspended in 5 mL of 1 × LEW buffer (50 mM sodium phosphate monobasic, 300 mM sodium chloride, pH 7.0). Bacteria were lysed by the addition of 50 μL of EDTA-free protease inhibitor cocktail (Thermo Scientific) and lysozyme to a final concentration of 1 mg/mL. The mixture was incubated on ice for 30 min with shaking followed by sonication for 30 s on ice and then centrifugation for 30 min at 20,000 × g. The supernatant was recovered and filtered through a 0.45 μm PVDF filter (Fisher Scientific). The 6xHis-tagged protein was affinity purified using a PrepEase His-Tagged Protein Purification High-Yield Kit (Affymetrix, USB). The protein concentration was measured using Protein Assay (Bio-Rad) on a precision microplate reader (Molecular Devices) using bovine serum albumin (Sigma-Aldrich) as the protein standard. Purified protein was analyzed by sodium dodecyl sulfate (SDS)-polyacrylamide gel (10%) electrophoresis (PAGE) as described by Laemmli (1970), and gels were stained with Coomassie Blue.
Conjugation of protein antigens to microsphere Luminex beads
Recombinant proteins were covalently coupled to Luminex MagPlex® polystyrene, carboxylated magnetic microsphere beads using the method described in the microsphere bead kit. Briefly, 500 μL of beads at a concentration of 1.25 × 10⁷ beads/mL were placed into a low protein-binding microfuge tube (USA Scientific, Inc.). For all subsequent procedures, the beads were protected from prolonged exposure to light. The beads were removed from suspension by attachment to a magnetic separator and washed in 100 μL of sterile water followed by gentle vortexing and sonication for 20 s to disperse any aggregated beads. The beads were magnetically separated and re-suspended in 80 μL of activation buffer (0.1 M sodium dihydrogen phosphate pH 6.2). After vortexing and sonication, 10 μL of 50 mg/mL Sulfo-NHS (Thermo Scientific) and 10 μL of 50 mg/mL EDC (Thermo Scientific) were added. Beads were incubated for 20 min at room temperature. The activated beads were magnetically separated, washed twice with 250 μL of PBS, and re-suspended in 100 μL coupling buffer followed by the addition of 25 μg of recombinant protein. The final volume was brought up to 500 μL in PBS, and the reaction mixture was gently rotated for 2 h at room temperature. The coupled beads were washed three times in PBS with 0.05% Tween-20 and 0.05% w/v sodium azide (PBST), re-suspended in 1 mL of PBST with 1% fish gelatin, and stored at 4°C in the dark until use.
Since all of the recombinant proteins possessed a His tag, a penta-His monoclonal antibody was used to estimate the relative amount of recombinant protein attached to each bead set. Approximately 1250 beads were placed in 50 μL of PBST with 1% fish gelatin (PBST-FG) and different dilutions of penta-His antibody on a Corning™Costar™ polystyrene white round-bottom 96-well plate (Corning, Inc.) followed by a 30 min incubation at room temperature with gentle agitation. Beads were washed three times with 190 μL of PBS-FG and re-suspended in 50 μL of biotin-conjugated secondary antibody (rabbit anti-mouse IgG) that was diluted to a concentration of 2 μg/mL in PBS-FG. After a 30 min incubation, wells were washed and 50 μL of SA-PE (Moss, Inc.), diluted 1:500 in PBST-FG, was added and incubated for 30 min at room temperature with shaking. The beads were washed three times, re-suspended in 100 μL of PBST-FG, and plate read on the MAGPIX instrument. Data were analyzed using xPONENT 4.2 software (Luminex), and the results were reported as mean fluorescence intensity (MFI) obtained from the median value for at least 100 beads (Van der Wal et al. 2012).
Source of serum samples and FMIA procedure
Studies were performed using sera from a previous RVF MP-12 infection trial (Wilson et al. 2014). Other samples were from animals that were experimentally infected with the wild-type virus, ZH501, and were kindly provided by Dr. Hana Weingartl, National Centre for Foreign Animal Disease, Canadian Food Inspection Authority (CFIA; Winnipeg, Canada). Before use, sera were heat inactivated at 56°C for 30 min in the presence of 0.5% Tween-20 and then safety tested to ensure the absence of infectious virus. Dr. John Morrill, University of Texas Medical Branch through Dr. Doug Watts, University of Texas-El Paso, provided additional heat-inactivated sera.
The four recombinant antigen bead sets were combined with an unconjugated bead set as a background control. Before making the bead mixture, the number of beads were counted under a microscope. A 50 μL volume containing 1250 beads from each bead set was added to each well of a CorningCostar polystyrene white round-bottom 96-well plate (Corning, Inc.). Serum samples were diluted in PBST-FG and processed as described earlier for penta-His tag detection with the following modifications. The secondary antibody was biotin-labeled rabbit anti-sheep IgG, goat anti-bovine IgG, rabbit anti-sheep IgM, or sheep anti bovine IgM, all of which were diluted to a concentration of 2 μg/mL in PBS-FG. Results were reported as MFI of the test sample minus MFI of the background bead set. The presence or absence of antibodies in each negative serum was evaluated by calculating the signal/positive (S/P) ratio. MFI values were converted to S/P ratio using the following equation:
S/P = (mean MFI of test sample − mean MFI of negative control)/(mean MFI of positive control − mean MFI of negative control). S/P ratio threshold was fixed at 0.4, for positive and negative controls that were provided by the commercial kit.
Results
RVFV recombinant proteins
As shown in Figure 1, Coomassie Blue staining of recombinant proteins resolved by SDS-PAGE identified a major band for each protein. All proteins possessed the predicted size, including molecular masses of 50 kDa for Gn, 32 kDa for N, 30 kDa for Nsm, and 34 kDa for NSs. The NSs preparation revealed a minor band at about 70 KDa, which could represent NSs protein dimers. In addition to protein purity, penta-His mAb staining was used to evaluate the relative amount of protein attached to each bead set. As shown in Figure 2, all bead sets were positive for binding. Even though each conjugation reaction included a similar quantity of protein, the penta-His mAb revealed different binding activities. For example, recombinant Gn showed the lowest reactivity with the mAb followed by beads conjugated with N, NSs, and NSm. The differences in mAb binding may represent several possibilities. For example, the chemistry required for linking proteins to the activated bead surface includes the reaction of N-hydroxy-succinimide (NHS) on the activated bead surface with free amino groups. Contamination of polypeptides with free amino groups may compete with the 6xHis-labeled protein. Another possibility is that the binding of protein to the bead surface may interfere with antibody recognition of the 6xHis. Overall, the results show that the use of the anti-His mAb provides a convenient means for assessing antigen binding to the beads.
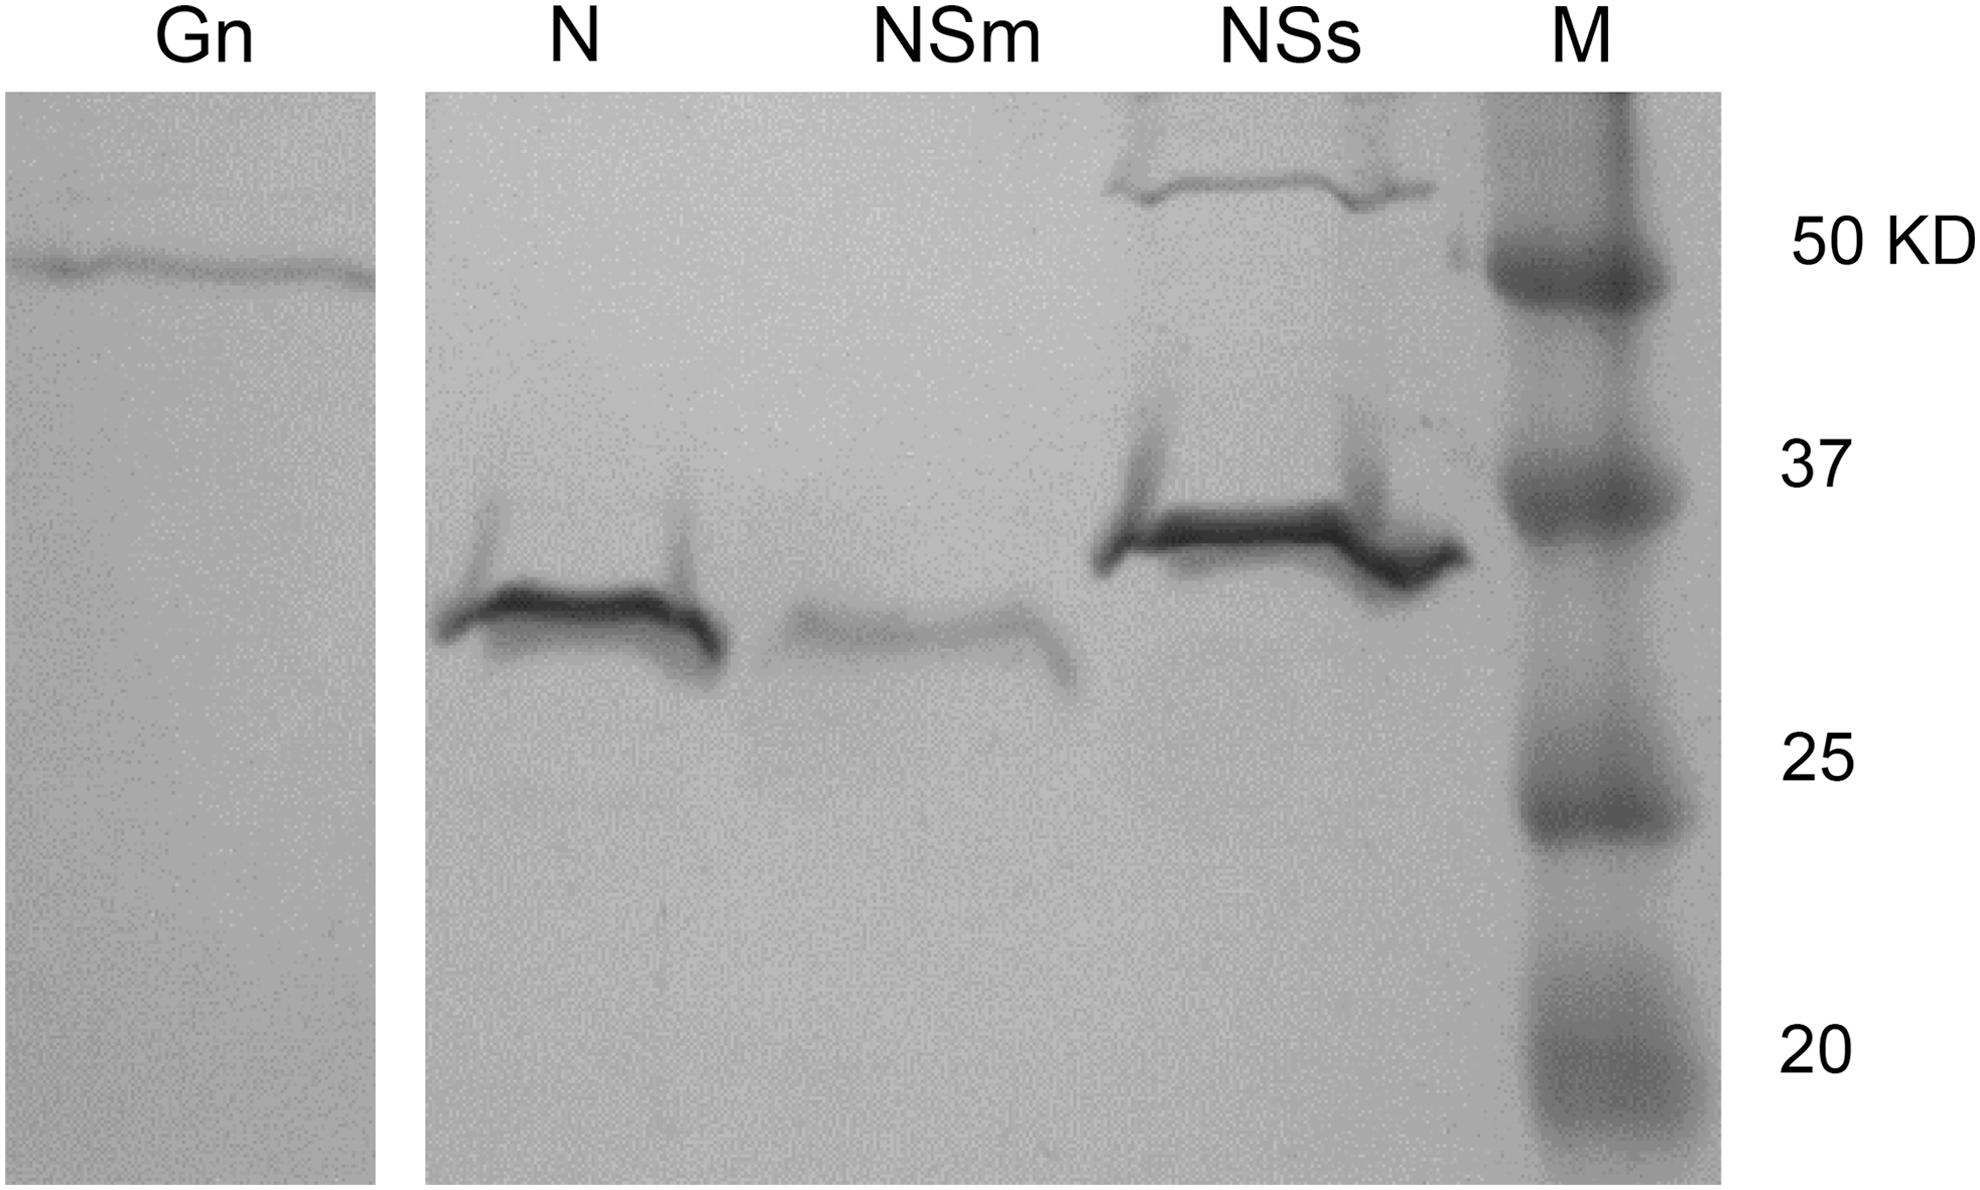
SDS-PAGE of recombinant RVFV proteins incorporated into the fluorescence microsphere immunoassay. Lane M contains the protein markers. RVFV, Rift Valley fever virus.
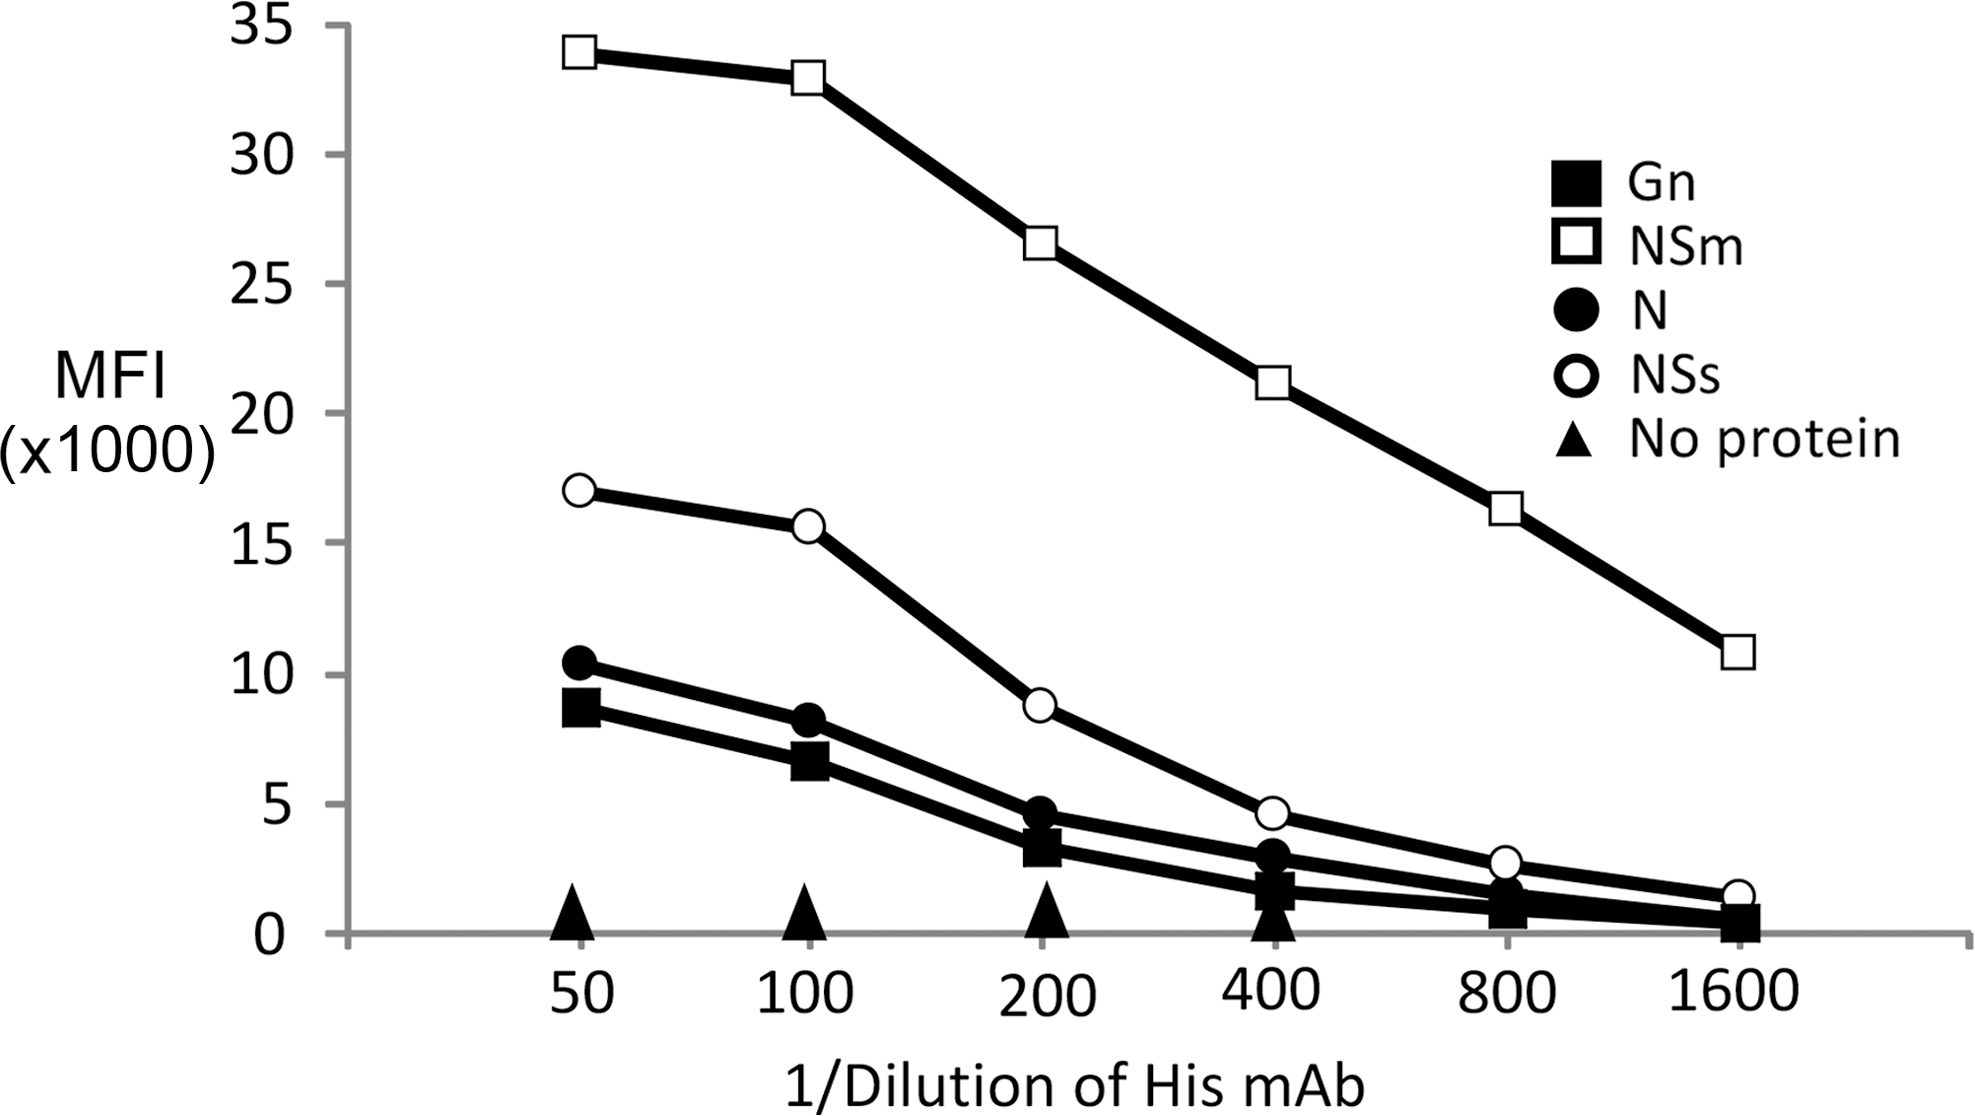
Binding activity of anti-5xhistidine antibody against recombinant RVFV proteins.
IgG and IgM responses
Serological responses were measured in animals experimentally infected with the pathogenic virus, ZH501. Examples of results for IgM and IgG from representative animals, including results for negative sera, are shown in Figure 3. For bovine IgG, the target with the highest antibody activity was the N protein, with maximum values approaching 30,000 MFI. This was followed by NSs, Gn, and NSm. The immunodominance of N is consistent with previous reports describing the immunogenicity of N during infection and supports the use of N as an important serological target for the detection of infected animals (Jansen van Vuren et al. 2007, 2010, Boshra et al. 2011, Faburay et al. 2013). Similar results for N were obtained for bovine IgM, except that MFI values were reduced (Fig. 3). The N protein was also immunodominant in infected sheep. As illustrated in Figure 3, MFI values for ovine IgG against the N protein approached 50,000, considerably higher than the MFI for bovine IgG. The relatively increased binding activity of ovine sera was a consistent observation. The MFI values for ovine antibodies against Gn, NSs, and NSm were much lower compared with N, but they were still easily detected. As shown in the left hand panels of Figure 3, the background antibody activity for each antigen target in negative samples was below the results observed for the positive sera. Based on all of these data, a dilution of 1:100 was selected for use in the FMIA.
IgG and IgM activity against RVFV structural and nonstructural proteins. The right panels show results for a positive bovine serum sample obtained at 38 days after infection with ZH501and an ovine sample taken at 14 days after infection with MP12. The left panels show results using sera from negative animals.
Using the 1:100 dilution, antigen-specific IgM and IgG were measured in a number of animals at different times after infection. Positive bovine and ovine sera from experimentally infected animals were tested for antibody activity against recombinant N, Gn, Nsm, and NSs. Even though this set of samples is limited in number, the results, presented in Figure 4, show some interesting trends. As expected, anti-N activity was predominant in both bovine and ovine samples, with ovine samples possessing a higher MFI. For N, MFI values for IgG and IgM were similar for both species. After N, Gn showed the next highest activity with similar MFI values for both species. Antibodies against NSs were also detected, although the MFI values were a much lower low compared with N and Gn. As described in Faburay et al. (2013), the least amount of antibody activity was found for NSm. For Ovine IgM, the anti-NSs values were near background. In all samples, IgG was the predominant immunoglobulin detected. The exception was NSm, where bovine IgM appeared to be higher compared with IgG. In total, these results demonstrate that antibodies to structural and nonstructural proteins can be detected in infected animals; however, antibody binding activities for the nonstructural proteins were lower even though the NSs- and NSm-coated beads showed the greatest reactivity when reacted with the anti-pentaHis antibody (Fig. 2). The presence or absence of antibody to bovine and ovine was determined by calculating the S/P ratio. If the S/P ratio is greater than or equal to 0.40, then the sample is classified as positive for RVFV antibodies; otherwise, this sample is classified as negative (Fig. 6).

IgG (black bars) and IgM (gray bars) responses from different animals at different days after infection. A total of 14 samples were used in the preparation of this figure. Serum samples were assayed at a 1:100 dilution.
Time course changes in anti-N IgG and IgM
We took advantage of a set of samples from a vaccine immunization trial to follow changes in RVFV-specific IgG and IgM responses over time (Wilson et al. 2014). Animals were immunized with the RVFV-modified live virus, MP12, and anti-N reactivity was followed over time. Results for two animals from each species are presented in Figure 5. N-specific IgG activity in the ovine samples was first detected in the day 7 sample, followed by detectable levels of N-specific IgG in bovine samples at 14 days. For IgM, N-specific activity for both species was apparent at 7 days after infection, compared with bovine IgG, was first detected by 14 days after immunization, and remained elevated throughout the remainder of the 28 day study period. As described earlier in Figure 3, MFI values for ovine IgG were elevated compared with bovine IgG. IgM activity in bovine reached a peak at 14 days after immunization and remained elevated for the remainder of the study. In contrast, ovine IgM peaked at 7 days and by 28 days followed by a decay in activity, reaching near-background activity by 28 days.

Time course changes in N-specific IgG and IgM in bovine and ovine serum samples after immunization with MP-12. Data represent the mean MFI for two animals per species. Samples were assayed at a dilution of 1:100. MFI, mean fluorescence intensity.
Discussion
The overall goal in the application of FMIA to RVF is to develop a single multiplex serological assay that can (1) accurately detect infected animals, (2) provide DIVA targets for use with NS-deleted MLV vaccines, (3) interrogate the level of immune protection, and (4) rule out other infections that mimic RVFV clinical signs. Of the four proteins evaluated in this study, the highest MFI values were obtained for N. In representative positive samples, anti-N activity was easily detected as early as 3 days after infection in RVFV-positive ovine samples and by 7 days in bovine sera. Based on these results, N protein was identified as a superior target for the diagnosis of infection. This conclusion is supported by previous work by others using ELISA-based approaches (Fafetine et al. 2007, Williams et al. 2011, Fukushi et al. 2012, Ellis et al. 2014).
The FMIA also detected antibodies to Gn, a protein involved in the interaction of virus with the cell receptor and a target for neutralizing antibodies. Jäckel et al. (2013) reported the use of recombinant Gn in an indirect ELISA format and was able to identify a strong correlation between Gn recognition and virus neutralization activity in samples taken from sheep and goats. The incorporation of NSs and/or NSm proteins into the Luminex assay was designed to function as a companion DIVA test for gene-deleted MLV. The MP-12 MLV vaccine was prepared by serial passage in the presence of the mutagen, 5-fluorouracil (Caplen et al. 1985) and attenuation achieved without the deletions of antibody epitopes; therefore, there are currently no DIVA tests that can distinguish vaccinated from naturally infected animals. However, a recombinantly derived MP-12 vaccine that contains a deletion in NSm was constructed (Morrill et al. 2013a, 2013b). The decreased immunogenicity of the nonstructural proteins relative to Gn and N brings into question their use as a DIVA target. For example, antibodies against NSs can be detected in naturally infected and vaccinated cattle and sheep; however, a blocking ELISA showed that only about 50% of animals possessed a detectable NSs response (Fernandez et al. 2012).
In a previous study evaluating serological responses against baculovirus-produced proteins, NSm was the least reactive in an ELISA format (Faburay et al. 2013). In this study, NSm yielded the lowest MFI values for serum samples and MFI values were comparable for both species. The principle difference between NSs and NSm was in the IgM response. For this set of samples, the anti-NSm IgM response in the bovine samples was greater than the IgG response (Fig. 4). The incorporation of NSs and NSm proteins into a diagnostic format will likely require the analysis of multiple serum samples within a population.
The FMIA identified distinct differences in the RVFV antibody responses between sheep and cattle. First, anti-IgG activities in the ovine samples were elevated compared with bovine sera. This difference translated into the earlier detection of infection in sheep. A second difference was the prolonged presence of IgM antibodies in bovine sera. In this study, anti-N IgM remained elevated for the entire 28 day study period. In contrast, the IgM response in sheep followed the expected pattern for a primary antibody response, reaching an early peak and returning to background levels (Fig. 5). This study demonstrates the proof of concept and the utility of FMIA for the evaluation of several aspects of humoral immunity during RVFV infection, in a single sample. The presence and absence of IgG to RVFV nucleoprotein (N), nonstructural proteins (NSm and NSs), and glycoprotein (Gn) in ovine and bovine was evaluated by calculating S/P ratio (Fig. 6). These results suggest the capacity of FMIA to provide information in distinguishing between positive and negative samples. Future work will focus on adding additional targets and on validating their platform for use in the field.
Detection of IgG in sera from 110 bovine (squares) and 117 ovine (circles). Signal/positive ratio was calculated from MFI as described in “Materials and Methods” section. The infected bovine and ovine that possessed an S/P ratio greater than 0.4 are positive (closed symbols); whereas the samples that possessed a ratio less than 0.4 are negative (open symbols).
Footnotes
Acknowledgments
This work was supported by the Science and Technology Directorate of the U.S. Department of Homeland Security, Foreign Animal Disease Centers (Institute for Infectious Animal Diseases [IIAD] [HSHQDC-10-A-BOA33], Center of Excellence for Emerging and Zoonotic Animal Diseases [CEEZAD] [2010-ST061-AG0001]), Kansas State NBAF Transition Funds, and the USDA Agricultural Research project number 5430-32000-005-00D. The authors are grateful to Dr. H. Weingartl, Canadian Food Inspection Agency (CFIA), Dr. J. Morrill, University of Texas Medical Branch, and Dr. D. Watts, University of Texas-El Paso for providing serum samples from experimentally infected animals. The contents of this publication are solely the responsibility of the authors and do not necessarily represent the official views of the USDA.
Author Disclosure Statement
No competing financial interests exist.