




Abstract
Spatially and temporally accurate information about infectious mosquito distribution allows for pre-emptive public health interventions that can reduce the burden of mosquito-borne infections on human populations. However, the labile nature of arboviruses, the low prevalence of infection in mosquitoes, the expensive labor costs for mosquito identification and sorting, and the specialized equipment required for arbovirus testing can obstruct arbovirus surveillance efforts. The recently developed techniques of testing mosquito expectorate using honey-baited nucleic acid preservation cards or sugar bait stations allows a sensitive method of testing for infectious, rather than infected, mosquito vectors. Here we report the results from the first large-scale incorporation of honey-baited cards into an existing mosquito surveillance program. During 4 months of the peak virus season (January–April, 2014) for a total of 577 trap nights, we set CO2-baited encephalitis vector survey (EVS) light traps at 88 locations in South Australia. The collection container for the EVS trap was modified to allow for the placement of a honey-baited nucleic acid preservation card (FTA™ card) inside. After collection, mosquitoes were maintained in a humid environment and allowed access to the cards for 1 week. Cards were then analyzed for common endemic Australian arboviruses using a nested RT-PCR. Eighteen virus detections, including 11 Ross River virus, four Barmah Forest virus, and three Stratford virus (not previously reported from South Australia) were obtained. Our findings suggest that adding FTA cards to an existing mosquito surveillance program is a rapid and efficient way of detecting infectious mosquitoes with high spatial resolution.
Introduction
A
Recently, two field techniques have emerged to collect mosquito saliva—honey-coated FTA™ cards (Whatman–GE Healthcare, Rydalmere, Australia) (Hall-Mendelin et al. 2010, Ritchie et al. 2013, van den Hurk et al. 2014) and sugar-water bait stations (Lothrop et al. 2012). Field trials of honey-coated FTA cards in passive box traps in northern Australia yielded multiple detections of West Nile virus Kunjin strain (WNVKUN), Ross River virus (RRV), and Barmah Forest virus (BFV) (van den Hurk et al. 2014). WNV was also detected in cotton dental wicks on toxic sugar bait stations in California 4–7 weeks before mosquito pools or sentinel chickens tested positive in that same region (Lothrop et al. 2012). Both the sugar bait stations and the honey-coated FTA cards are very effective at detecting infectious mosquitoes. However, as developed, neither method is suitable for broad-scale deployment in urban areas. Here, we have built on previous methods to develop a honey-baited FTA card system that can easily be incorporated into traditional mosquito surveillance programs.
There are approximately 250 cases of human arbovirus infection reported in South Australia each year, predominantly RRV and BFV (Department of Health and Ageing 2014). Previous studies analyzing human cases of RRV in South Australia have suggested it is mainly a problem of endemic regions bordering the Murray River where the virus circulates annually at low rates (Mudge et al. 1980, Mudge 1977, Weinstein et al. 1994, Horwood and Bi 2005, Bi et al. 2009). Models have been developed to help predict when arbovirus infection risk will be highest along the River Murray (Bi et al. 2009, Williams et al. 2009a), but we do not know how infectious mosquito prevalence and human risk vary outside the Murray River basin.
Furthermore, little research has been conducted on the ecology and prevalence of RRV in urban South Australia (and cities generally), despite recent evidence suggesting urban infections may be more common than previously believed (Boyd and Kay 2001, Boyd and Kay 2002, Hill et al. 2009). Therefore, we sought to perform a trial of our enhanced surveillance system in a variety of populated landscapes across South Australia. Our eventual goal was to obtain a fine-scale spatial view of where and when infectious mosquitoes existed in three of the major populated regions of South Australia. We used the infrastructure of an existing mosquito surveillance program which trapped regularly (every 2–4 weeks) using CO2-baited encephalitis vector survey (EVS) miniature light traps (Rohe and Fall 1979, Williams et al. 2009a). Here we describe our methods and resulting virus detections.
Materials and Methods
Mosquito surveillance is regularly conducted in South Australia as an indicator for arbovirus risk along the River Murray (Williams et al. 2009a) and coastal suburbs of Adelaide (Williams et al. 2009b). In the current study, additional traps were deployed in metropolitan Adelaide and the Adelaide Hills to improve our spatial resolution. Eighty-eight traps were set overnight once every 2–4 weeks in three main regions—the Murray River Valley (Murray), the Adelaide Hills (Hills), and Metropolitan Adelaide (Metro; Fig. 1).

Trapping locations (black dots) and virus detections. The virus detections from each site are as labeled. Not all traps are visible here; if traps were within 500 meters of one another, they were represented here as one dot. Color images available online at
New collection containers for the EVS miniature light traps were designed to allow for the insertion of FTA cards and to house mosquitoes. A 2-liter milk container with the bottom cut off was sanitized and placed upside-down in a knee-high stocking. The elastic top of the stocking was secured around the housing of a mechanized fan, hung below a container of dry ice (Fig. 2). A square (∼25×25 mm) cut from an FTA card was fastened inside the trap and saturated with Manuka honey and blue food coloring (Hall-Mendelin et al. 2010). Upon collection, a second, similarly treated FTA square was placed on a damp cotton ball in the cap of the milk carton that was then screwed on to the spout. The FTA card was kept moist by the cotton ball, and the mosquitoes were able to feed through the stocking. Traps were maintained in the lab under a damp towel at 25°C for up to 7 days, allowing mosquitoes time to feed and expectorate virus. Mosquitoes were then frozen at −20°C while awaiting identification (Russell 1993), and FTA cards were frozen in plastic snap-lock bags at −80°C until analysis.

(
FTA cards were sent by post to the Department of Medical Entomology, Centre for Infectious Disease and Microbiology Laboratory Services, Pathology West, Westmead Hospital, NSW (to authors C.T. and S.L.D.). The panel of viruses screened for were: RRV, BFV, Sindbis virus (SINV), Murray Valley encephalitis virus (MVE), Kunjin virus (KUNV), Stratford virus (STRV), Edge Hill virus (EHV), and Kokobera virus (KOKV). Nucleic acids were eluted from the FTA cards following methods by Hall-Mendelin et al. (2010) with minor modification. Up to two FTA card squares from the same trap during the trapping period were combined. Viral RNA was extracted from 400 μL of the eluate using the EZ1 Virus Mini Kit v2.0 (Qiagen, Victoria, Australia) protocol with a final elution volume of 60 μL. A two-step real-time RT-PCR was performed as follows: 10 μL volumes of RNA were reverse transcribed using random hexamers (200 ng/mL) according to the manufacturer's instructions (Tetro Reverse Transcriptase, Bioline, Alexandria, Australia). Four microliters of cDNA were amplified by real-time PCR using MyTaq HS DNA Polymerase (Bioline, Alexandria, Australia) on the Rotor-Gene 6000 (Qiagen, Victoria, Australia) using the high-saturating fluorescent dye EvaGreen (Biotium, Hayward, CA). Laboratory reference control viruses and nontemplate negative controls were included as comparators in all assays, all of which remained negative and positive throughout all assays.
The thermal cycling conditions consisted of an initial denaturation (2 min at 94°C) followed by 45 cycles of denaturation (18 s at 94°C), annealing with touchdown (60°C for 25 s for the first cycle and decreasing by 1°C for the next 13 cycles and continuing at 47°C for the remaining 32 cycles), followed by elongation (30 sec at 72°C). A prehold cycle was set at 50°C for 30 s followed by melt curve analysis with ramping temperatures positioned between 76°C and 88°C. Dissociation curves were used to tentatively identify amplified products (Fig. 3). Samples with dissociation curves similar to the virus reference controls were visualized on agarose (1.5%) gels to confirm amplicon length and to identify nonspecific products. Any amplicons that were not similar to reference standards were considered negative.
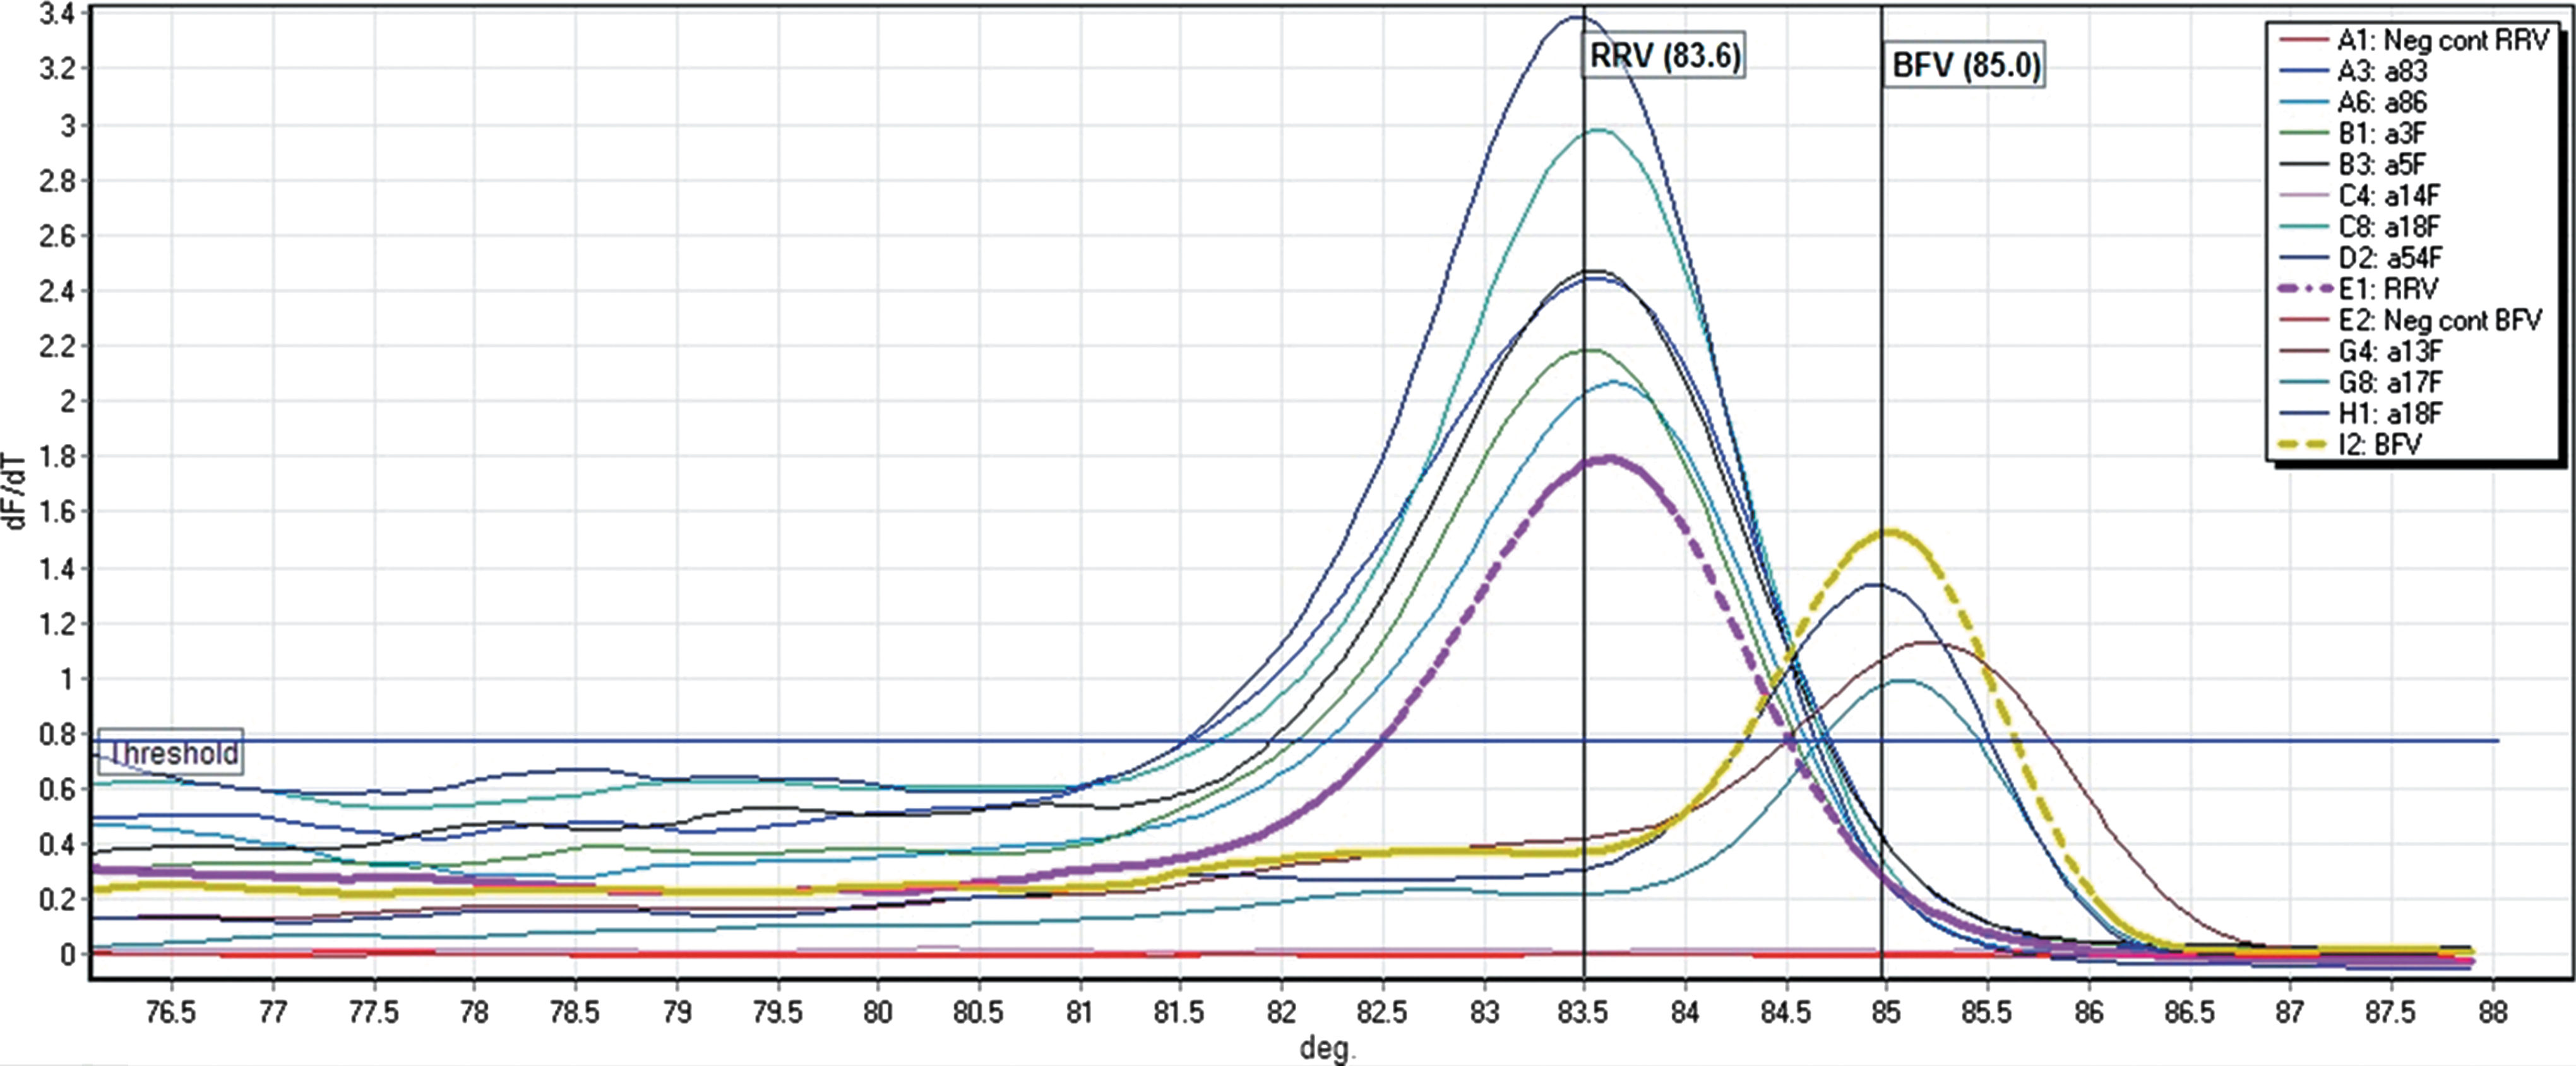
Derivative curve (dF/dT) generated for Ross River virus (RRV) and Barmah Forest virus (BFV). The purple and yellow dotted lines are dissociation temperatures for RRV (Tm 83.6°C) and BFV (Tm 85°C) laboratory reference strains, respectively. Positive test samples dissociating at a similar temperature to the reference strains were tentatively identified as that virus species. Along with the positive and negative samples, the figure's key also lists the coded sample name corresponding to each of the different colored dissociation curves. Color images available online at
A subset of positive amplicon samples (n=12) was sent to the Australian Genome Reference Research Facility and confirmed by Sanger sequencing using BigDye® Terminator chemistry Version 3.2. DNA sequences were compared against the National Center for Biotechnology Information (NCBI) database using BLAST against each other and the reference strains used in the assay.
For the January collections, test samples were screened for both alphaviruses and flaviviruses using universal alphavirus and flavivirus primers (Table 1). Positive samples were reamplified by means of a nested PCR with gene-specific primers. During the February–April collections, once the common circulating viruses were identified, alphaviruses were detected using gene-specific primers. The use of universal primers was continued for flavivirus amplification (Moureau et al. 2007).
Oligonucleotide primers used to detect alphaviruses and flaviviruses using RT-PCR and the virus strains and accession numbers upon which the primers were based.
Moureau et al. 2007.
Maher-Sturgess et al. 2008.
Results
From 577 trap nights, 22,111 mosquitoes were captured and were offered FTA cards to feed upon. Overall, 18 virus detections were made (Fig. 1) with cycle threshold (Ct) values ranging between 32.6 and 38.5 and amplification efficiencies of 70–95%. Three different viruses were identified, RRV (n=11), BFV (n=4), and STRV (n=3; Table 2). The majority of the detections occurred in February (n=9), followed by January (n=6), and April (n=3). Stratford virus was evident in January, BFV in February, and RRV in January, February, and April. No virus activity was detected in March. None of the virus sequences (n=12) were identical to the reference strains used in the assay. One BFV sequence was determined to be a human DNA contamination that amplified due to competitive binding; this sample was considered negative and not included in this analysis. Five of the RRV sequences were identical to one another over ∼130 base pairs, but none of these was next to each other on the plates and they were separated by a month of no detections (March); thus, we kept all detections as positives. Two other RRV sequences were identical to each other but not to other sequences or the reference strains. The rest of the RRV sequences were unique to each other and reference strains.
RRV, Ross River virus; STRV, Stratford virus; BFV, Barmah Forest virus.
The greatest number of identifications was made in the Metro region (n=9), followed by the Murray (n=7) and the Hills (n=2). However, sampling efforts were not equal across these areas, so per trap night and per mosquito comparisons are presented in Table 3. RRV was present in all regions, but was most common per night in the Metro region, whereas BFV was most common along the Murray (Table 3).
RRV, Ross River virus; BFV, Barmah Forest virus; STRV, Stratford virus.
The number of virus identifications by suburb and mosquito species is shown in Table 2. Viruses were detected in traps containing between 1 and 533 mosquitoes. In general, detections were made in traps containing a mixture of several species. There were, however, some exceptions. RRV was detected in traps with only Culex (Cx.) quinquefasciatus, or Cx. molestus. BFV was detected in traps that contained only Cx. globocoxitus, Cx. molestus, or Aedes (Ae.) notoscriptus. Stratford virus was detected in a trap that only contained Ae. notoscriptus.
Discussion
The honey-baited nucleic-acid preservation card surveillance system and the sugar bait station method (Hall-Mendelin et al. 2010, Lothrop et al. 2012, van den Hurk et al. 2014) were originally developed once studies showed that arboviruses could be expectorated during sugar feeding (Doggett et al. 2001, van den Hurk et al. 2007). The study herein reaffirms the efficacy of the above-mentioned arbovirus surveillance methods and extends their use to dry ice-baited mosquito traps for surveillance in urban settings. Other studies suggest that testing mosquito expectorate may be able to alert us to virus activity earlier than traditional methods, which would allow us to implement protective action before an outbreak of human cases occurs (Lothrop et al. 2012, van den Hurk et al. 2014).
Interpretation of arbovirus detections
The prevalence of infectious mosquitoes seen here suggests that they may be more abundant in urban areas than previously believed. Perhaps this should not be surprising for RRV, given that 70–90% of RRV infections are believed to be subclinical or with mild symptoms and are unlikely to be reported (Bi et al. 2009). However, the sensitivity and specificity of this FTA card method has yet to be tested and may vary with the prevalence of virus in that area (Selvey et al. 2014). Therefore, a single virus detection may not indicate a great infection risk to individuals living in these suburbs. However, sites that had repeated virus detections likely do have elevated arbovirus activity compared to other areas. For example, testing sites in Gillman and Goolwa each had three virus detections, suggesting that these areas have higher virus activity and could potentially be a source of infected mosquitoes for other suburbs. Such “hotspots” may warrant increased arbovirus surveillance and vector control efforts.
Mosquitoes associated with virus
Single species detections (when a virus was detected in a trap that contained only one species) occurred seven times in this study, allowing us to investigate virus–vector associations. RRV was detected from Cx. quinquefasciatus and Cx. molestus; BFV was detected from Cx. globocoxitus, Ae. notoscriptus, and Cx. molestus; and STRV was detected from Ae. notoscriptus. Some of these species are generally not considered to be important vectors, raising the possibility of false positives. Despite the numerous checks in place in this study to confirm the validity of our positives, we acknowledge the possibility that samples were cross-contaminated at some point. However, given the rigorous methods and molecular confirmations, we are confident that if any contamination happened, its role was minimal and would not change the conclusions or public health implications of this study. Furthermore, the method of molecular virus detection used here was a blinded test and eliminated bias toward expectations of specific virus recovery associated with a particular location or mosquito species.
The main vectors for RRV are believed to be Ae. camptorhynchus and Ae. vigilax in saltmarsh regions and Cx. annulirostris inland that transmit at rates of up to 100% (Ballard and Marshall 1986), 57% (Kay 1982), and 46% (Ryan et al. 2000), respectively. These three species are also believed to be the main vectors for BFV. Ae. vigilax and Cx. annulirostris transmit BFV at rates of 100% (Boyd and Kay 1999) and 10% (Boyd and Kay 2000); we could not find any laboratory assessments of the vector competence of Ae. camptorhynchus. To our knowledge, no studies have tested the vector competence of Cx. molestus or Cx. globocoxitus for RRV or BFV. These two species, along with Cx. quinquefasciatus and Cx. australicus, are in the closely related Cx. pipiens group. Both Cx. globocoxitus and Cx. australicus have been implicated in RRV outbreaks, but neither has been tested for vector competence in a laboratory (Dhileepan et al. 1996, Williams et al. 2009a). Cx. quinquefasciatus can become infected with RRV at rates from 0% to 25% (Kay et al. 1982, Kay and Aaskov 1989) and BFV at very low rates up to 2% (Boyd and Kay 2000, 2001). However, the ability of this species to transmit these two viruses to a host has not yet been tested. Here, we caught a total of 5850 Cx. pipiens complex mosquitoes; 434 of them were in traps that tested positive for an alpha virus. This equates to an infectious rate between 0.3% and 7.4%, which is within the infection range expected for Cx. quinquefasciatus, although, again, the transmission potential for this species is unknown.
BFV and STRV were detected from Ae. notoscriptus. This mosquito has been demonstrated to be a competent laboratory vector of BFV (Doggett and Russell 1997, Watson and Kay 1999). Both BFV and STRV have been isolated from field-collected Ae. notoscriptus on numerous occasions (Doggett et al. 2005, Doggett et al. 2008).
Incorporating FTA cards into existing mosquito surveillance
The different methods that have been developed in the realm of expectorate surveillance each have strengths that lend them to different utilities. The passive bait trap technique used by van den Hurk et al. (2014) is very effective in remote areas with limited accessibility. However, the passive traps are bulky and, along with the compressed CO2 gas cylinder and regulator, are expensive to operate on a large scale. The sugar bait stations used by Lothrop et al. (2012) appear to be ineffective in urban areas and nonarid settings, where competing scents and food sources may reduce their efficacy. Our goal of obtaining virus activity data with high spatial resolution in urban areas was best met by a new approach that incorporates honey-baited FTA cards into the ubiquitous dry ice-baited mosquito traps.
In the current study, our objective was to identify where and when virus activity occurred, rather than to identify the mosquito species carrying the virus. However, our method is suitable for studies intended to elucidate the vector ecology of an arbovirus, because mosquitoes could be frozen at −80°C after FTA cards are removed. Traps with a positive card could have their mosquitoes tested retroactively for infection status.
Furthermore, we propose that allowing the mosquitoes access to the cards for a week may have enhanced our sensitivity by allowing: (1) Completion of the extrinsic incubation period; (2) the virus additional time to replicate, amplifying the number of virions per infected mosquito; and (3) each mosquito to feed multiple times, thus raising the amount of virus expectorated onto the card. We believe this technique may have improved our sensitivity; a pilot study suggested that most mosquitoes had fed on the card within 24–48 h (E.J.F., unpublished data), and therefore a shorter period of time may also be sufficient. We suggest implementing this form of virus surveillance in a few key locations on an annual basis to continue monitoring detection rates and also to begin the surveys earlier to see how virus detections fluctuate throughout the season. Clusters of traps in “hotspot” or indicator locations may provide a better ability to detect increases in virus activity before an outbreak.
Conclusions
Our findings indicate that incorporating FTA cards into an existing mosquito surveillance program provides spatially and temporally precise arbovirus surveillance and can be done without significant additional cost and labor. Using this method, we found substantial arbovirus activity in an urban area (Adelaide, Australia) where it was previously believed to only rarely occur. By conducting surveillance throughout the arbovirus season, health authorities will be able to detect when and where mosquitoes become infectious and respond quickly by mobilizing control and education resources to the affected areas without having to wait for the incubation–diagnosis–reporting period delay that is characteristic of surveillance systems reliant on human case data.
Footnotes
Acknowledgments
We gratefully acknowledge the people who made this work possible. We appreciatae the thoughtful comments and critique from Dr. Andrew van den Hurk and Dr. Andrew Flies that greatly improved this manuscript. Dr. Sharolyn Anderson provided guidance on site selection and mapping methods, Stephen Fricker and Gina Rau assisted with fieldwork and Claire Fisk helped with the live mosquito work. Thanks also to David Slaney for his input into the formulation of this study. The ongoing mosquito surveillance program is funded by SA Health in partnership with the following local governments: Salisbury, Renmark-Paringa, Loxton-Waikerie, Berri-Barmera, Mid-Murray, Murray Bridge, Coorong, Alexandrina. The Adelaide, and Mt Lofty Ranges Natural Resource Management Board funded mosquito surveillance in urban wetlands in Adelaide.
Author Disclosure Statement
No competing financial interests exist.