
Abstract
Rickettsia montanensis has long been considered a nonpathogenic member of the spotted fever group rickettsiae. However, the infection potential of R. montanensis is being revisited in light of its recent association with a case of human infection in the United States and the possibility that additional cases may have been misdiagnosed as Rocky Mountain spotted fever. To this end, DNA was extracted from American dog ticks (Dermacentor variabilis) removed from Department of Defense (DoD) personnel and their dependents at DoD medical treatment facilities (MTFs) during 2002–2012 (n = 4792). These 4792 samples were analyzed for the presence of R. montanensis (n = 136; 2.84%) and all vector DNA was confirmed to be of D. variabilis origin using a novel Dermacentor genus-specific quantitative real-time polymerase chain reaction procedure, Derm, and a novel Dermacentor species multilocus sequence typing assay. To assess the risk of R. montanensis infection, the positive and negative samples were geographically mapped utilizing MTF site locations. Tick localities were imported into a geographical information systems (GIS) program, ArcGIS, for mapping and analysis. The ecological niche modeling (ENM) program, Maxent, was used to estimate the probability of tick presence in eastern United States using locations of both R. montanensis-positive and -negative ticks, climate, and elevation data. The ENM for R. montanensis-positive D. variabilis estimated high probabilities of the positive ticks occurring in two main areas, including the northern Midwest and mid-Atlantic portions of the northeastern regions of United States, whereas the R. montanensis-negative D. variabilis tick model showed a wider estimated range. The results suggest that R. montanensis-positive and -negative D. variabilis have different ranges where humans may be at risk and are influenced by similar and different factors.
Introduction
S
Until recently, Rickettsia montanensis had long been considered a nonpathogenic member of the SFGR with a geographical distribution that colocalizes with R. rickettsii due to its shared association with Dermacentor variabilis (American dog tick), which ranges across eastern United States and California (Fig. 1). However, in light of its recent implication in a case of human infection (presenting as an afebrile rash with headache and nausea) in the United States (McQuiston et al. 2012) as well as the possibility that additional rickettsial cases may have been misdiagnosed as RMSF, the possibility of humans as accidental hosts for R. montanensis-infected ticks should be considered a plausible possibility. In addition, a recent PCR study utilizing blood samples taken from dogs that were seropositive for SFGR found that the causative agent was R. montanensis, instead of the more pathogenic R. rickettsii (Barrett et al. 2014).
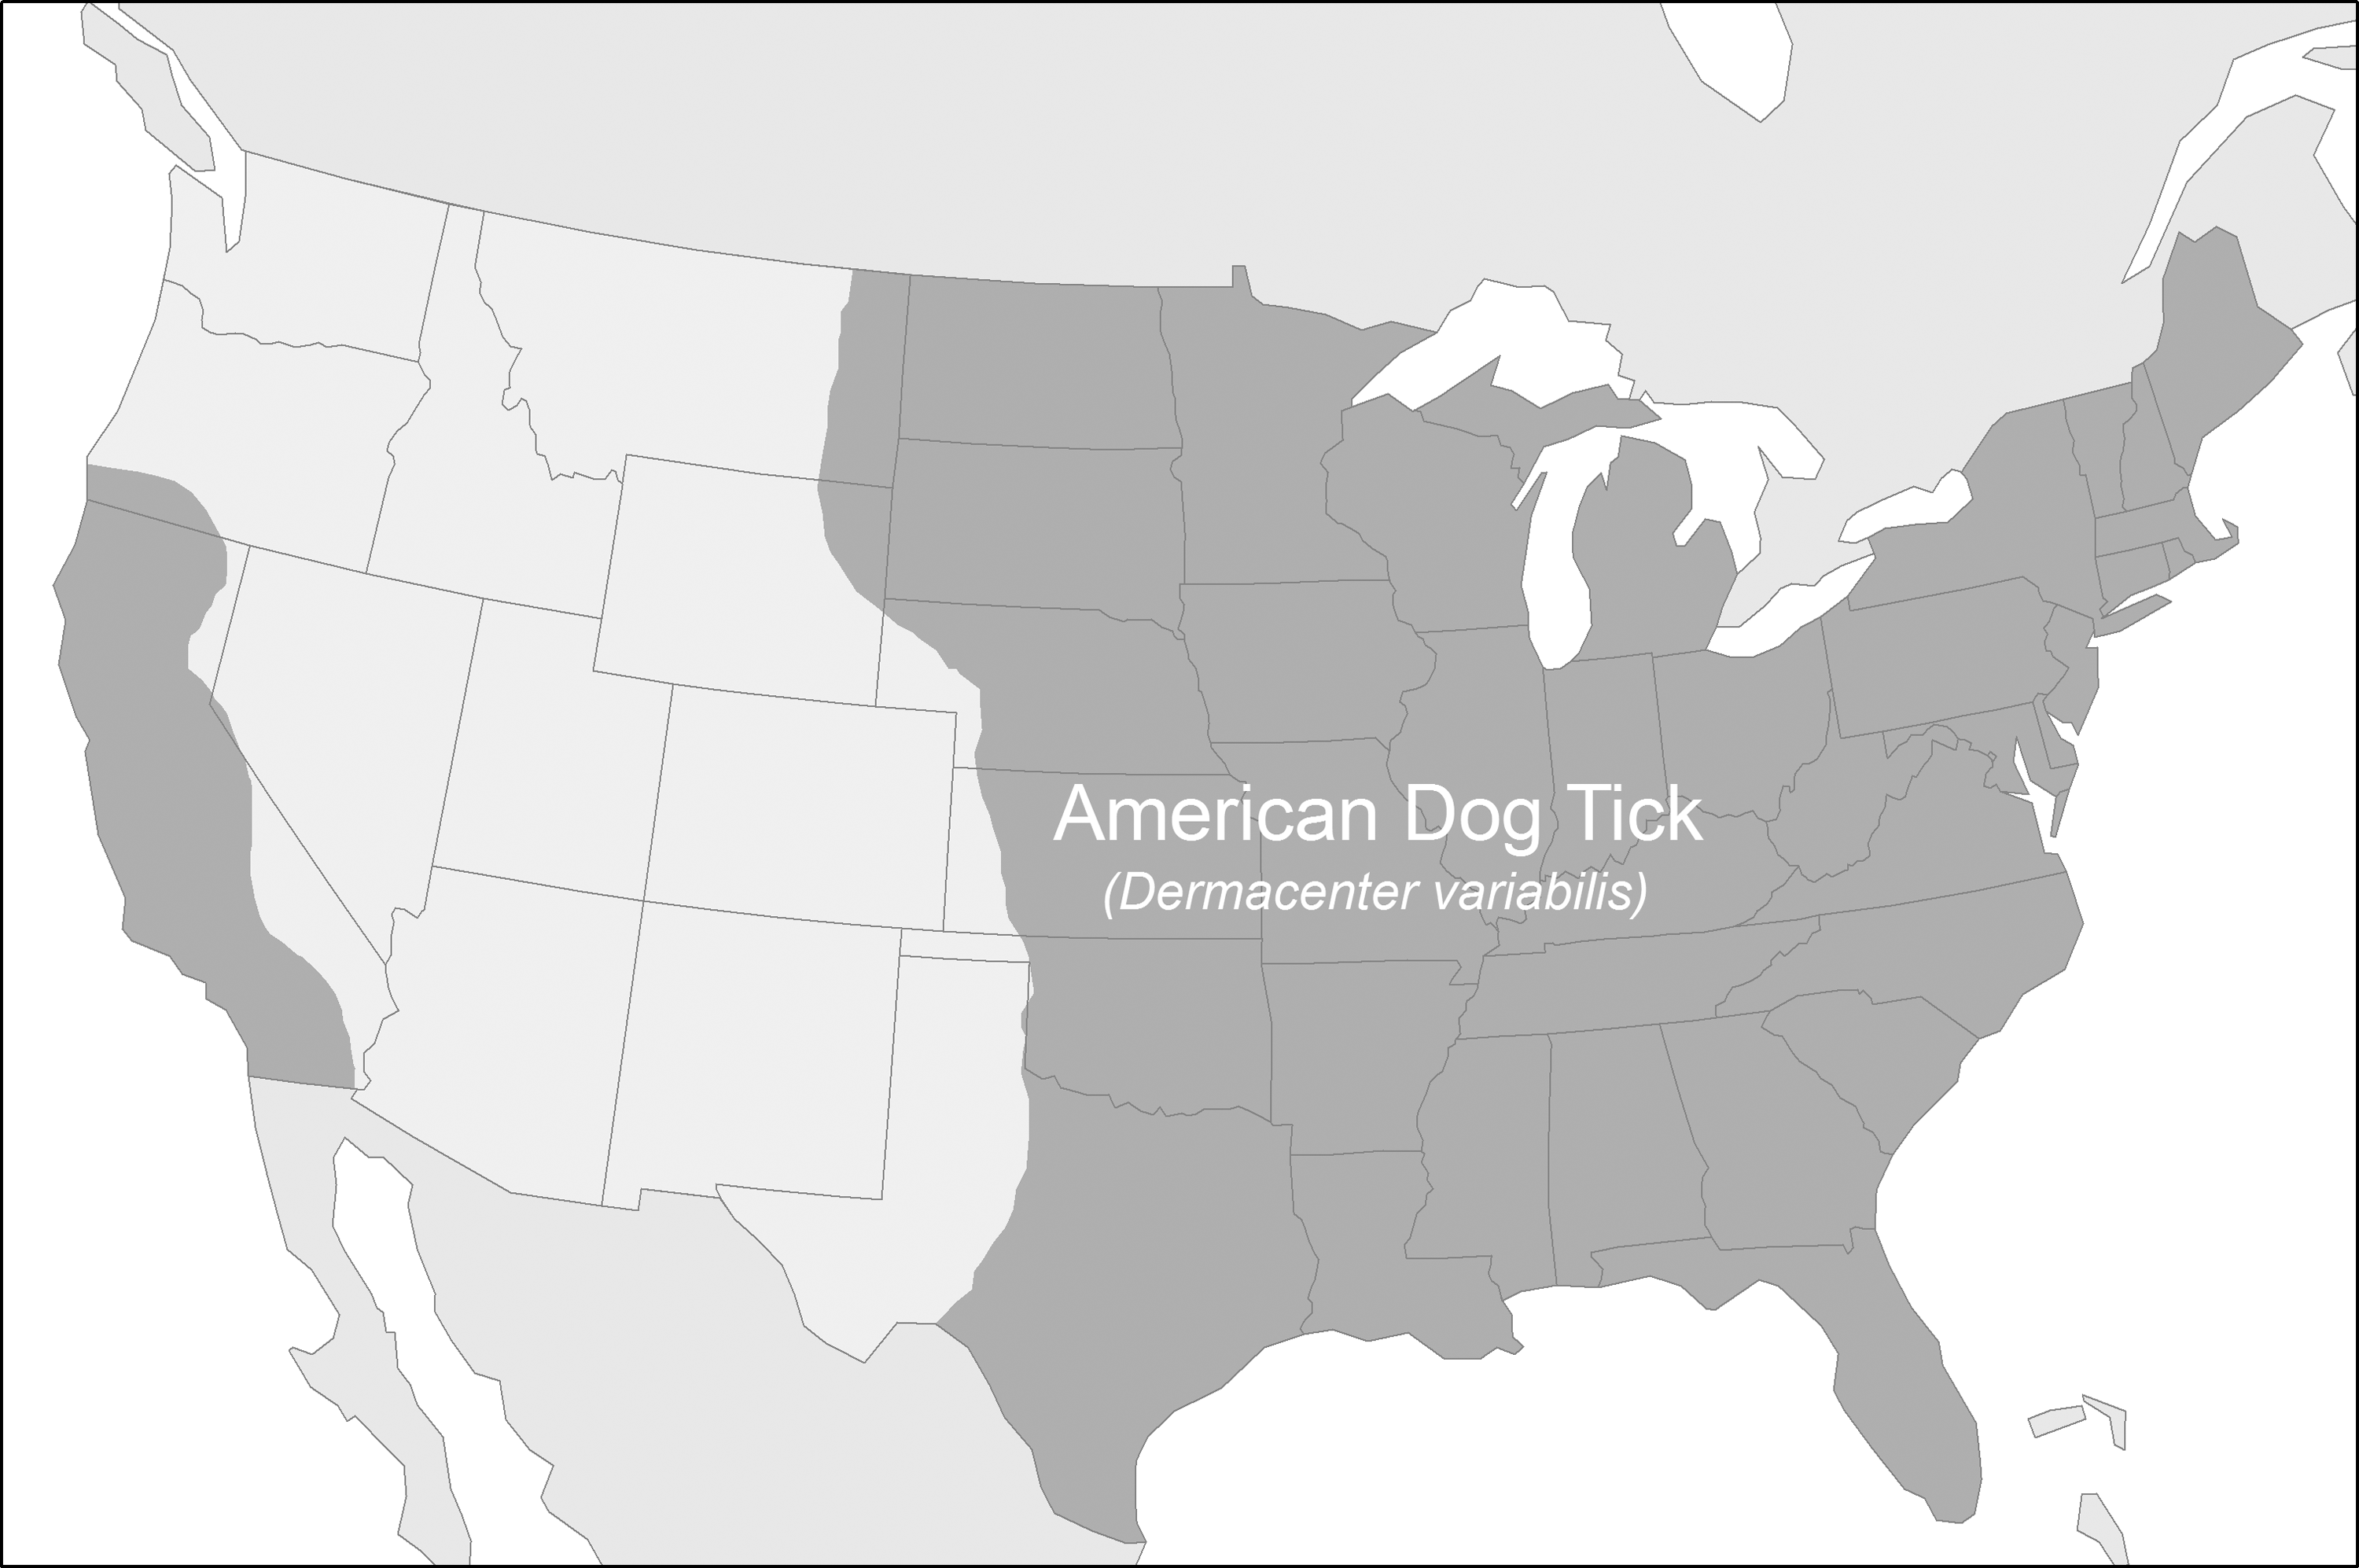
CDC estimated distribution of Dermacentor variabilis in the United States (
The high frequency at which D. variabilis parasitize humans and animals warrants investigation into the distribution of R. montanensis-positive D. variabilis as well as the risk of humans serving as accidental hosts. The distributions of tick-borne diseases are driven by the vector that transmits the disease and by vector–host movements, which for D. variabilis is complicated because several species of small animals serve as primary hosts for this tick (Azad and Beard 1998, Stein et al. 2008). Beyond the presence of the tick vector, the epidemiology of rickettsial diseases also is dependent upon the prevalence of the rickettsiae in the tick population and the interaction of the ticks with humans (Hackstadt 1996), which indicates the need to conduct surveillance of R. montanensis-positive D. variabilis.
Although R. montanensis was first reported in 1965 (Lackman et al. 1965), few studies have addressed R. montanensis-positive D. variabilis. In the 1980s and 1990s, R. montanensis was found in locations such as Connecticut (Anderson et al. 1986); Ohio (Pretzman et al. 1990); New Jersey, Oklahoma, Wisconsin, and Virginia (Stromdahl et al. 2001); and Maine (Feng et al. 1980). More recently, it was identified in Maryland (Ammerman et al. 2004), California (Dergousoff et al. 2009), North Carolina (Smith et al. 2010), Canada (Wood and Artsob 2012), Georgia (McQuiston et al. 2012), Oklahoma (Barrett et al. 2014), and Virginia (Nadolny et al. 2014). The prevalence of R. montanensis has not been well characterized and estimates range from 1.5–2.0% in Virginia in 2010/2011 to 19–19.4% in North Carolina in 2006 (Feng et al. 1980, Dergousoff et al. 2009, Smith et al. 2010, Nadolny et al. 2014). The prevalence of R. montanensis in D. variabilis removed from humans in the Department of Defense (DoD) Human Tick Test Kit Program (HTTKP) of the Army Public Health Center (APHC) ranged from 2.9% to 4.6% with an average of 3.2% across the states west of the Rocky Mountains and in California (Stromdahl et al. 2011). Since R. montanensis was considered nonpathogenic and the identification of Rickettsia in some of the earliest prevalence and distribution studies was only to genus level, the prevalence and distribution of R. montanensis-positive D. variabilis have likely been underestimated (Ammerman et al. 2004).
In studying tick-borne pathogens, variables such as pathogen expansion, often-shifting environments, and the links between disease emergence and changes in climate and habitats make identifying a simple relationship between humans and tick-borne pathogens a matter of increasing complexity (Wimberly et al. 2008b). The availability of current mapping platforms and species habitat modeling software, enhanced vector distribution reports, and the production of niche models allow for better predictions of infected vectors in locations not previously assessed. Typically, range maps are generalized over broad areas and do not account for local changes in environmental conditions such as elevation and temperature (Wimberly et al. 2008a). Recently, ecological niche modeling (ENM) has become widely used to estimate species ranges for vectors, pathogens, and/or pathogen-infected vectors (Peterson 2006, Colacicco-Mayhugh et al. 2010, Haverkost et al. 2010). ENMs examine the environmental conditions at the known locations of a species of interest and subsequently identify areas of similar environmental conditions to estimate the probability of the presence of selected species (Phillips et al. 2006).
In our study, D. variabilis localities obtained from the HTTKP were mapped and used to create ENMs estimating the distribution of R. montanensis-positive and -negative D. variabilis ticks in the United States. The results from our study increase the understanding of R. montanensis prevalence, distribution, and potential risk to humans. This was achieved by examining the distribution within the endemic range of D. variabilis with particular emphasis on those R. montanensis-positive D. variabilis associated with humans and predictive modeling (ENM). In presenting our data, R. montanensis-positive D. variabilis ticks may be referred to as positive ticks and R. montanensis-negative D. variabilis ticks may be referred to as negative ticks.
Materials and Methods
Dermacentor variabilis collection, nucleic acid preparation, and rickettsial detection and identification
R. montanensis-positive D. variabilis tick samples were obtained from the HTTKP from the years 2002–2012 (n = 28,689 for all tick species), where 4792 (16.7%) were morphologically identified as D. variabilis and prepared for rickettsial DNA assessment, as previously described (Stromdahl et al. 2001, 2011). Individual tick DNA preparations were produced and screened for pathogens using standard PCR, restriction fragment length polymorphism, and Rickettsia genus-specific qPCR as previously described (Stromdahl et al. 2001, 2011, Jiang et al. 2005, 2012). Of these, 163 were further analyzed by the Rmont qPCR assay as previously described (Smith et al. 2010).
Dermacentor genus-specific molecular identification
To confirm the identification of the R. montanensis-positive ticks as Dermacentor, a novel genus-specific qPCR assay, Derm, was utilized using primers and probes designed to target the ITS2 region DermITS2F2 (forward primer): 5′-TACCACGCAACTGCTCGT; DermITS2R2 (reverse primer): 5′-TCGACGCCCTACCACGT, and DermITS2P2 (probe): 5′-FAM-CCTCGTCTATAAGTAGCTCCGTGTTGG-BHQ1. The primers and probe oligonucleotide sequences were selected based on Dermacentor ITS2 sequences from D. andersoni, D. variabilis, and D. marginatus in GenBank (AY365361, AY365355, AY365358, AY365357, AY365360, AY365359, AY365356, AY365362, S83088, FN296275, FN296269, FN296273, and FN296278). The sequences were compared for regions of similarity, and primers and probe were designed using Beacon Design Software (Premier Biosoft, Palo Alto, CA). The qPCR assay was optimized on a SmartCycler II (Cepheid, Sunnyvale, CA) thermocycler system. The final reaction was performed in a volume of 25 μL, consisting of 12.5 μL or 0.75 U of UDG Supermix, 0.6 μM of forward and reverse primer, 0.5 μM of probe, 5 mM of MgCl2, and 1 μL of template. The thermocycler reaction parameters consisted of a hold at 50°C for 2 min, a hold at 95°C for 2 min, and 45 cycles at 95°C for 15 s and 61°C for 30 s. Fluorescence was recorded during the annealing step and data were analyzed with SmartCycler software (Cepheid, Sunnyvale, CA).
To confirm D. variabilis speciation, a fragment of 230bp of the 16s rRNA gene was amplified from randomly selected 16 (∼10%) R. montanensis-positive D. variabilis samples using Dermacentor-specific standard PCR primers (Derm16SF [forward primer]: 5′-CAGGGAAAAACTGTTTTAAACT TAA and Uni16SR [reverse primer]: 5′-CGCTGTTATCCC TAGAGTATTT), followed by sequencing. The primers were designed by comparing Dermacentor 16S sequences from D. variabilis, D. marginatus, D. andersoni, Dermacentor occidentalis, Dermacentor albipictus, Dermacentor imitans, Dermacentor halli, Dermacentor hunteri, and Dermacentor nitans found in GenBank (AY010238, AY010235, AY010241, AY010237, AF001248, AF001233, AF001247, AF001246, AF001249, AF001232, AF001231, AF001252, L34299, L34300, AY676458, U14144, and Z97879) and utilizing Beacon Design Software (Premier Biosoft). The PCR used 0.3 μM of forward and reverse primers and was run under conditions consisting of a hold at 94°C for 3 min; 40 cycles at 94°C for 30 s, 51°C for 30 s, and 68°C for 1 min; and a hold at 72°C for 7 min. The amplicons were run on a 1.5% agarose gel and purified using the QIAquick PCR Purification Kit (Qiagen, Valenica, CA). Sequencing reactions, purification, and sequence assembly were performed as previously described (Luce-Fedrow et al. 2015).
Mapping and modeling
Locations provided by the HTTKP (ticks were accompanied by submission forms that requested where the tick bite occurred) for the R. montanensis-positive D. variabilis ticks were available for 135 of the 136 ticks (location information was not available for one sample) using either the medical treatment facility (MTF) or the reported tick collection site. Text locations were converted to latitude/longitude coordinates using Google Maps or DistancesFrom (also Google Maps based) (
To obtain negative tick coordinates, the records of 3746 D. variabilis ticks having tested negative for R. montanensis as part of the HTTKP sampling protocol were downloaded from TickMap (
One kilometer resolution bioclimatic data and global elevation data were obtained from WorldClim for modeling (
Ticks obtained from TickMap with localities with ≤21,000 meters of uncertainty.
Two-Sided, type 3 Student's t-test with (Bonferroni correction/adjustment for multiple variables) ([p ≤ α/n] = [p ≤ 0.05/20] = 0.0025).
--- Bio3, Bio4, and Bio15 are unitless bioclimatic variables (
To compare the positive and negative tick models, the raster output probability maps from the Maxent model were imported into ArcGIS and processed with the Raster Calculator program. Using a threshold of 0.17 (based on the 10 percentile training presence of each model), images containing predicted presence and predicted absence of the vector were produced. These binary images of positive and negative D. variabilis ticks were used in Raster Calculator to produce a final raster image representing predicted areas of R. montanensis-negative D. variabilis ticks, -positive D. variabilis ticks, and -positive and -negative D. variabilis ticks.
Statistical analysis
To understand the possible reasons for differences in the estimated range of the positive versus negative ticks, the environmental conditions for each tick location were examined using statistical analysis. ArcGIS was used to extract environmental variable values at the collection sites of positive and negative ticks. Using Excel (Microsoft, Redmond, WA), a two-tailed heteroscedastic t-test with a Bonferroni adjustment/correction for multiple variables (p ≤ 0.05/20) was applied to the two data sets to determine if there was a significant difference between the positive and negative tick datasets.
Results
R. montanensis was confirmed in 136 of 4792 (2.84%) D. variabilis ticks (16.7%, 4792 of 28,689 total ticks) that were submitted to MTFs as part of the HTTKP. The DNA preparations were confirmed as R. montanensis positive by the Rmont qPCR assay, showing an average cycle threshold (Ct) value of 31.71 (range: 20.18–41.08). These positive DNA preparations were confirmed to have been isolated from Dermacentor ticks by the novel genus-specific qPCR assay, Derm, showing an average Ct value of 18.66 (range: 12.14–28.53). Furthermore, 16 randomly chosen DNA preparations from a total of 155 (136 R. montanensis-positive and 19 R. montanensis-negative D. variabilis) DNA sample preparations identified as Dermacentor by the Derm qPCR assay were amplified by the novel species-specific PCR and sequencing assay, Derm16SF/Uni16SF, yielding a 230 bp amplicon that was sequenced with Dermacentor-targeted primers to confirm 100% species identification as D. variabilis.
The locations of ticks obtained through the HTTKP were ascertained from the accompanying questionnaire form used when submitting a tick. Eighty-two percent of submitters reported that the tick bite was acquired either on a military installation or at a descriptive location (e.g., city, town, and creek). The remaining 12% did not specify a location for where the tick bite occurred. This study used the location of the MTF when a tick was submitted without a specific location reported. Using the detail provided on the questionnaire, the latitude and longitude were determined by the installation/MTF (74%), city (18.5%), county (3.0%), or descriptive location (e.g., creek, school, or land fill) (4.4%).
The distribution of R. montanensis-positive D. variabilis ticks was found to occur across the eastern half of United States, with the highest prevalence in Virginia (n = 31), Maryland (n = 23), New Jersey (n = 18), Wisconsin (n = 15), Kentucky (n = 12), and Pennsylvania (n = 10) (Fig. 2A). Virginia, followed by Maryland, contained the majority of the positive ticks. The distribution area of the positive ticks (Fig. 2A) was smaller compared with the negative ticks (Fig. 2B). Negative ticks were found to occur at least once in California, Washington, and Colorado, but primarily were found in states east of the Mississippi River, excluding Michigan and Vermont.

Distribution of D. variabilis ticks collected as part of the Human Tick Test Kit Program (HTTKP). Each point represents a location where one or more tick(s) were collected.
In developing the ENMs, a total of 62 unique site locations or presence records (each geographical coordinate was only represented once) were used in the Maxent ENM to construct the R. montanensis-positive D. variabilis model (Fig. 3A). Fifty points were randomly designated as training points to build the model and 12 points were used to test the model. The statistical evaluation indicated a high accuracy as shown by the AUC of .952 for training data and the AUC of .932 for test data and p value of 4.619E-5. The Maxent jackknife test indicated that the variable that produced the highest training gain in a model using one environmental variable was the mean temperature of the coldest quarter. The variable that decreases the gain when it is not included in the model was altitude. Altitude therefore contains information that the other variables do not. In addition to mean temperature of the coldest quarter, annual mean temperature, precipitation seasonality, and minimum temperature of coldest month were influential variables in this model.
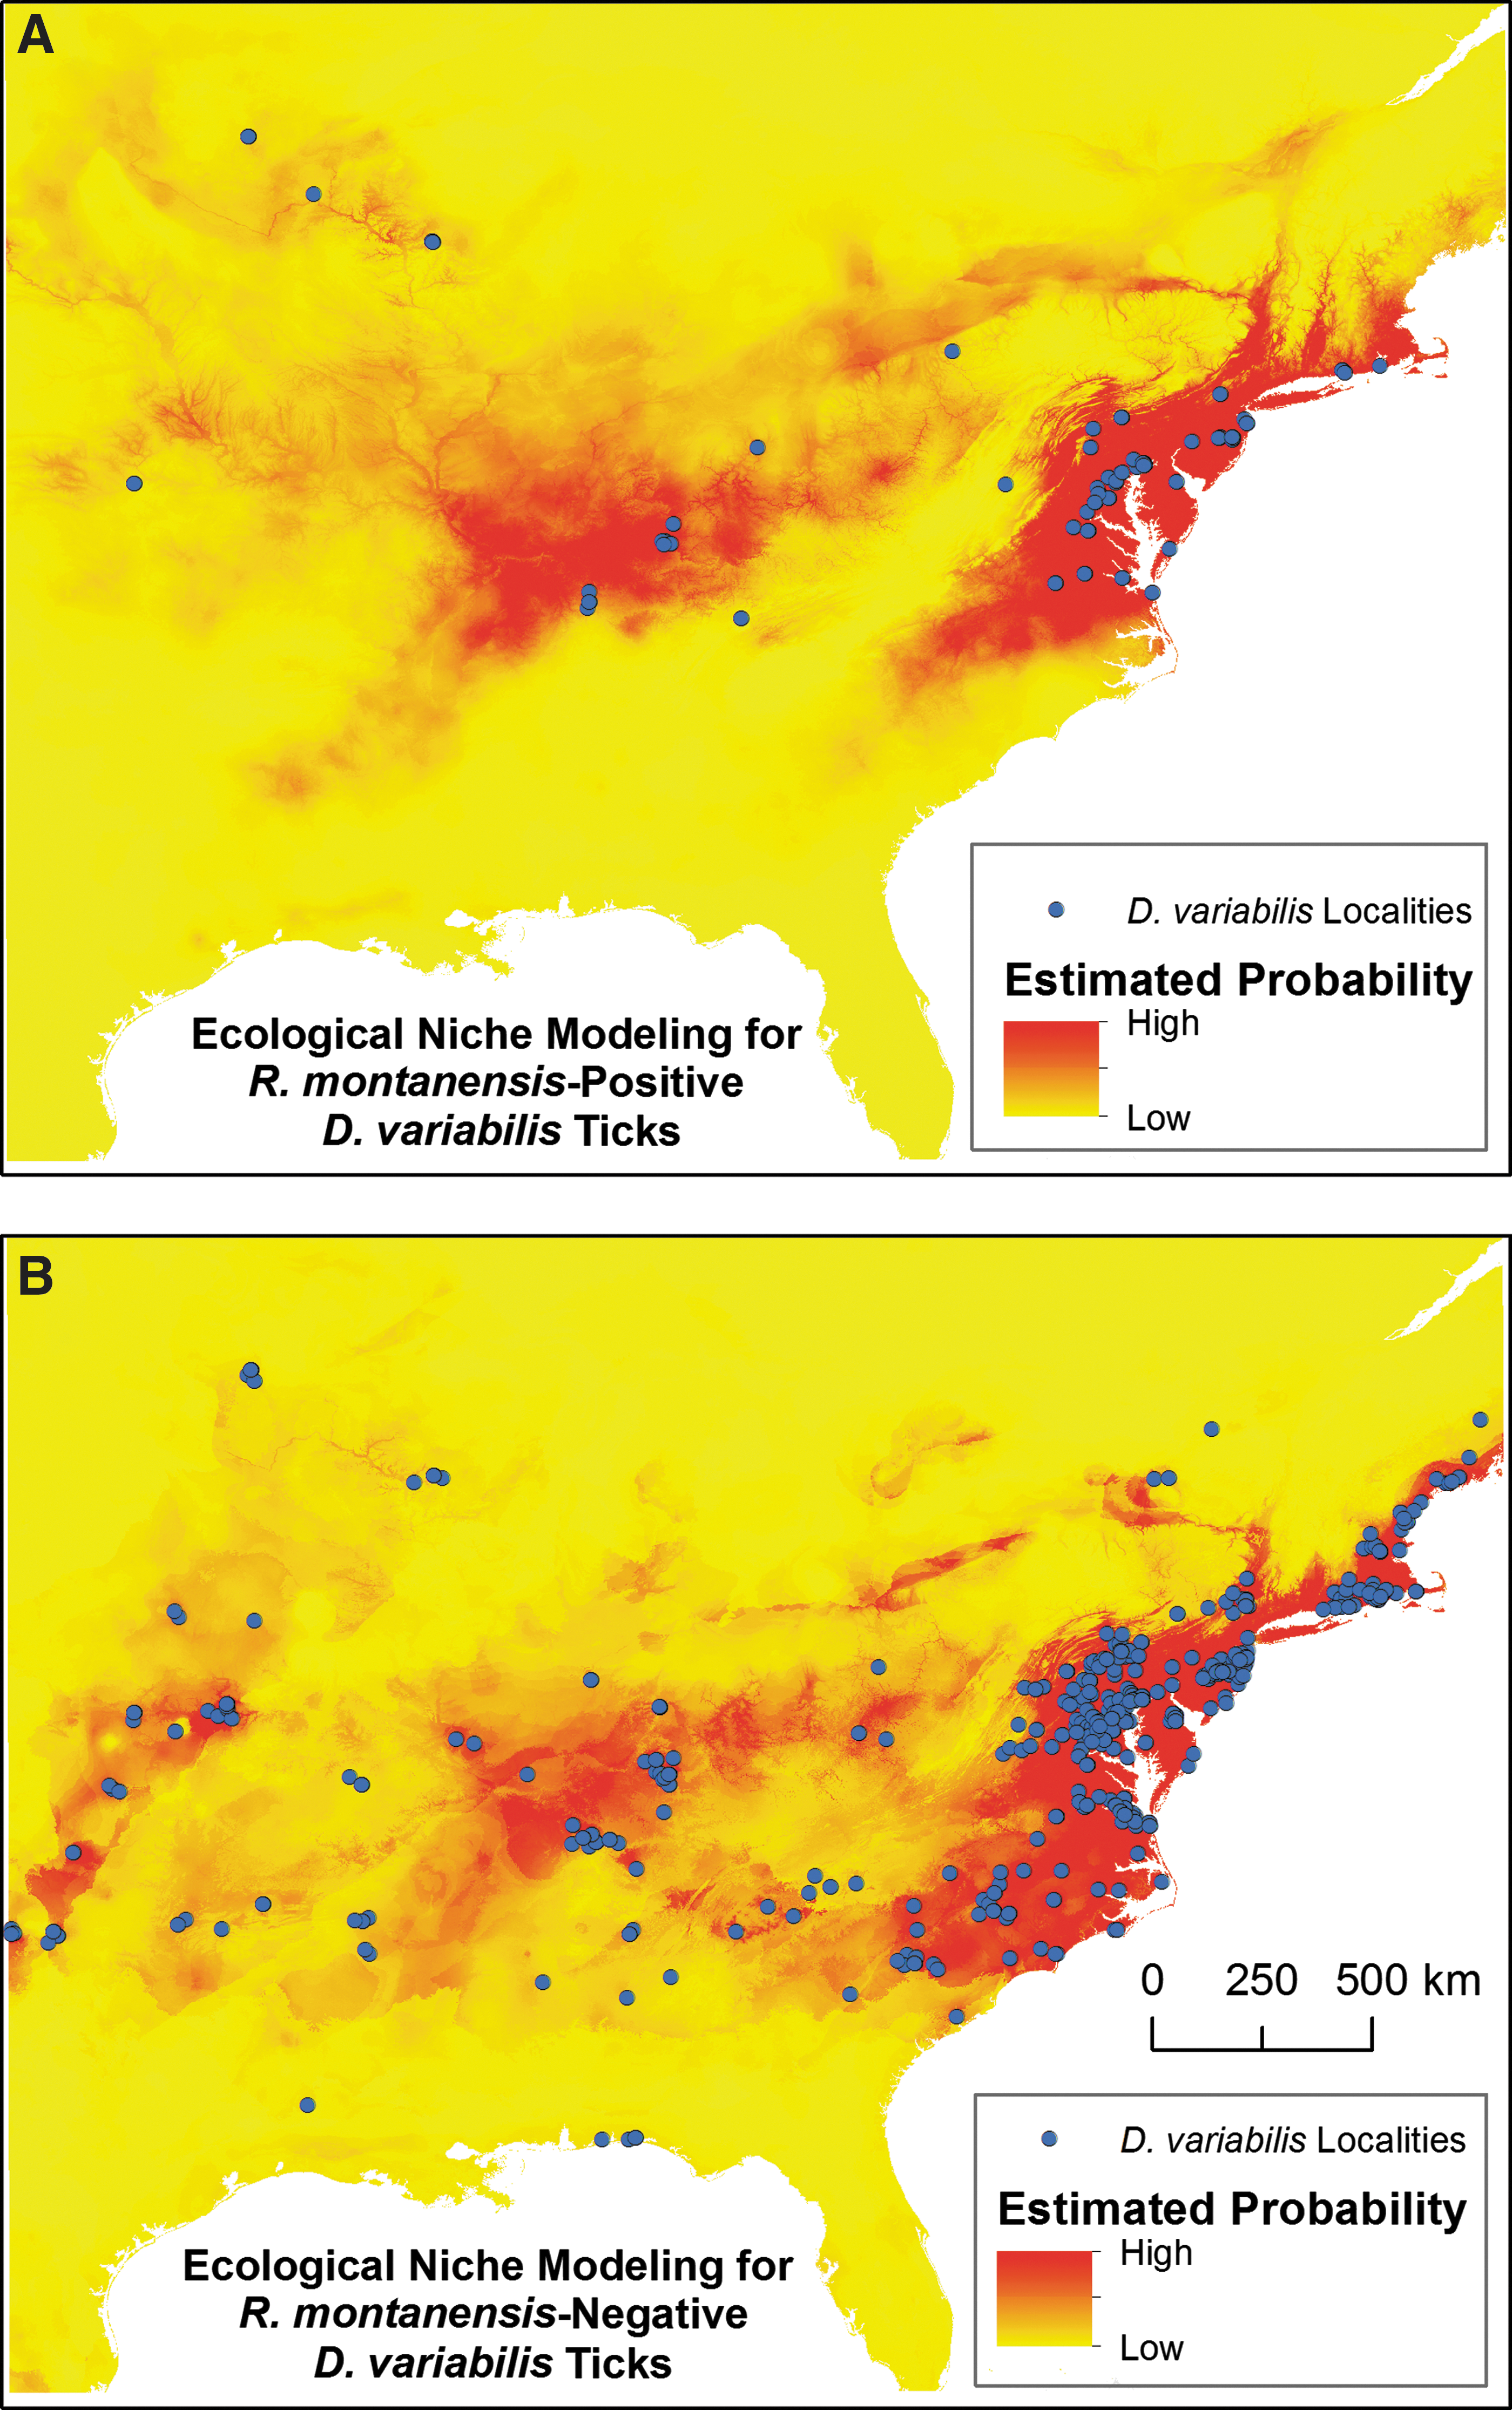
Maxent ecological niche model of D. variabilis ticks collected as part of the HTTKP. Each point represents a spatially unique tick presence record that was incorporated in the ecological niche model; duplicate presence records were deleted.
The R. montanensis-negative D. variabilis model utilized 316 unique presence records for training and 78 for testing (Fig. 3B). The AUC was 0.949 and the p value was 1.505E-21. The most useful variable by itself was temperature seasonality, which accounts for the differences in temperature between the summer and winter seasons (Andreasson and Schmitz 2000), and the variable with the most information not in the other variables was altitude. In addition, other influential variables were mean temperature of coldest quarter, mean temperature of driest quarter, and precipitation seasonality, which reflects the changes of seasonal receipt of precipitation (Pryor and Schoof 2008).
The influential variables of the positive and negative tick models were compared. Both models indicate altitude, mean temperature of the coldest quarter, and precipitation seasonality to be the predominantly influential variables. Furthermore, the t-test p values associated with these variables are below the threshold value (p ≤ 0.0025), indicating that these conditions associated with these variables differ between the models (Table 1). The p values for the other influential variables (important to one, but not both models) listed above for each model were also below the same threshold value (Table 1). Finally, the variables that showed low significance levels by the t-test were not influential variables in either model (Table 1). Overall, the variables that statistically appear to differ between the models, but only influenced one or the other model, were temperature-based variables: annual mean temperature, temperature seasonality, minimum temperature of coldest month, and mean temperature of driest quarter.
An image representing predicted areas of R. montanensis-negative ticks, -positive ticks, and -positive and -negative ticks was created. According to the probability map produced by Maxent, the areas with higher probabilities of positive ticks were located in Delaware, Maryland, New Jersey, Virginia, and the Kentucky–Tennessee location; the areas with the lowest probability were Alabama, Georgia, Florida, and Michigan. The negative tick model shows three areas of increased probability and the positive tick models show two areas of increased probability. More specifically, the upper and lower areas of the easternmost regions found in the negative tick model are absent in the positive tick model. The positive tick model shows a low probability of positive ticks to be found in Oklahoma, Kansas, southern North Carolina, and South Carolina. Furthermore, it appears that the probability is not as great in Connecticut, Maine, and Rhode Island. To further compare the probabilities indicated by the two models, we were able to use Raster Calculator to create a prediction that incorporated both models and reinforced the probabilities each individual model reported (Fig. 4) by demonstrating that the positive only area was smaller in extent compared with the areas that may be inhabited by both positive and negative ticks.
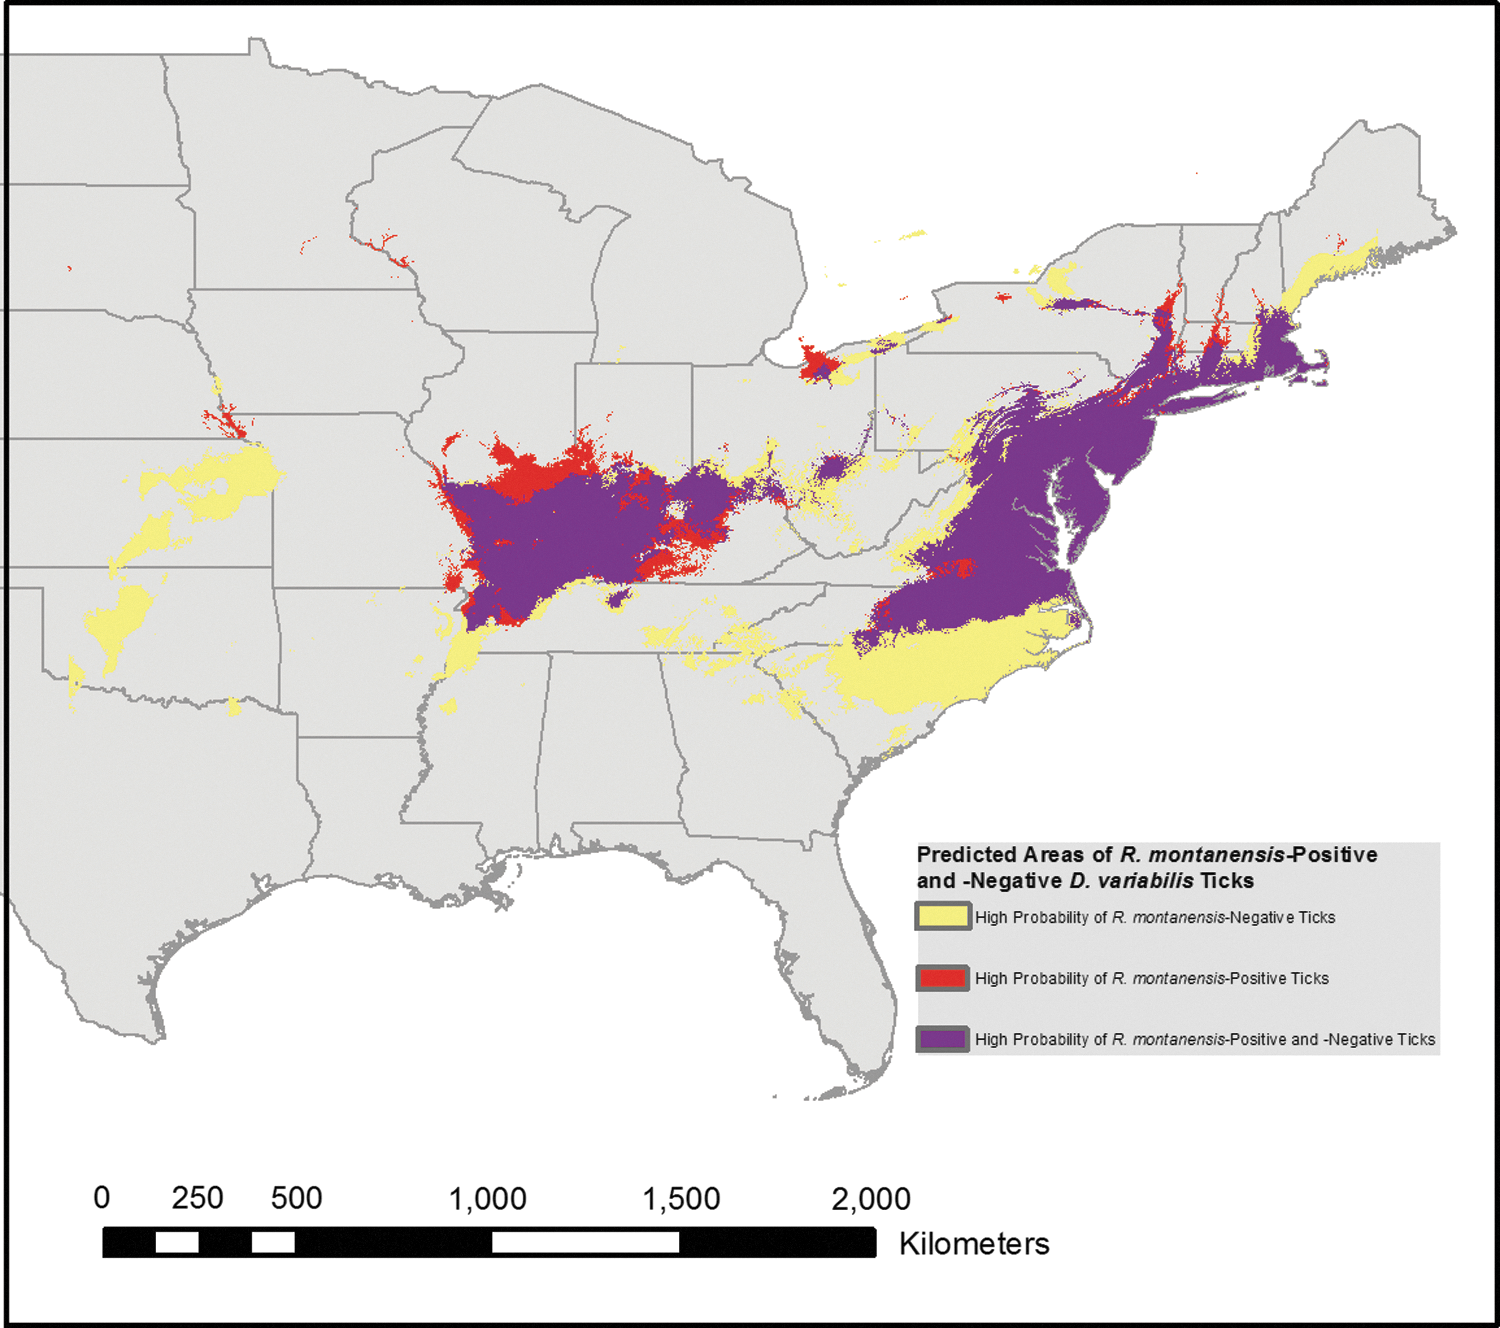
Overlay of the results of two tick models: R. montanensis-positive and -negative D. variabilis. The purple regions on the map indicate the overlap of the models for R. montanensis-positive and -negative ticks; the yellow and red regions indicate where the two models differ: yellow represents areas predicted to only have R. montanensis-negative ticks and red represents areas predicted to only have R. montanensis-positive ticks.
Discussion
The recent discovery that R. montanensis may actually be pathogenic to humans prompted a reexamination of the prevalence and geographic distribution of R. montanensis in D. variabilis, along with a determination of the risk to humans based on models that indicate the probability of positive D. variabilis ticks in the eastern half of United States. The study investigated ticks found on military personnel and their dependents, particularly in the North East (including the mid-Atlantic), South, and much of the Midwest, as classified by the US Census Bureau (
Over the 10-year tick collection period, the 2.84% prevalence of R. montanensis found in D. variabilis ticks parasitizing DoD personnel and their dependents is similar to other reportings, including field-collected ticks. Reports of other tick species being field collected include Amblyomma americanum, Amblyomma maculatum, and Ixodes scapularis (Stromdahl et al. 2011, Stromdahl and Hickling 2012). In relation to other studies, prevalence reports of R. montanensis detected in D. variabilis ticks collected include 1.5–2.0% by flagging in Virginia (Nadolny et al. 2014), 3.3% by various collection methods (dragging, flagging, CO2-baited traps, and human collections) in Kentucky and Tennessee (military installations) (Pagac et al. 2014), 3.8% by flagging in Maryland (Ammerman et al. 2004), and 19.4% by flagging in North Carolina (Smith et al. 2010). In ticks collected in Tennessee from humans, animals, and tick drags, reports indicated 0.3% R. montanensis infections in A. americanum ticks and 10% in D. variabilis (Moncayo et al. 2010). Similarly, R. montanensis was found in D. andersoni in Montana and in D. variabilis in Ohio, New York (Long Island), and Maryland (Azad and Beard 1998). Interestingly, serological studies of dogs demonstrated that 15% of dogs in North Carolina (Breitschwerdt et al. 1987) and 50% in Oklahoma (Barrett et al. 2014) tested positive for R. montanensis. Although D. andersoni and A. americanum have shown to be infected with R. montanensis, D. variabilis is the primary vector and R. montanensis has not been found in A. maculatum, I. scapularis, D. albipictus, Ixodes affinis, Haemaphysalis leporispalustris, or Ixodes brunneus (Azad and Beard 1998, Socolovschi et al. 2009, Smith et al. 2010, Stromdahl et al. 2011, Barrett et al. 2014, Nadolny et al. 2014). In relation to the other studies, our prevalence rate falls within similar ranges. However, our collection methods used were strictly from parasitized humans and did not include environmental collections.
The localities of the tick samples were mapped and used to create ENMs for R. montanensis-positive and R. montanensis-negative D. variabilis. The ENMs provide insight into the ecological and environmental factors that a given species depends upon for survival to estimate the range of the species, as previously described (Peterson 2006). The spatial representation and resulting ENMs predicting the risk of encountering R. montanensis-positive D. variabilis indicated regions where ticks may be found. More specifically, the models included potential regions that were not part of the assessed dataset, indicating that positive ticks could inhabit more regions than what were observed by our collection distribution and could pose a risk to humans in those areas.
When modeling with Maxent, presence-only data are incorporated, and in many instances, negative or absence data are not available (Phillips et al. 2006). Utilizing our tick data that were negative for R. montanensis does not indicate an absolute absence of R. montanensis in an area; instead, it demonstrates that it has just not been yet identified there. Therefore, it was advantageous to have access to a negative dataset for modeling, where the models could be discerned individually or in comparison. The separate modeling of the R. montanensis-negative data and -positive data allowed for comparison of the pathogen and vector, particularly in regard to predicted areas and environmental requirements. The positive tick model showed clustered areas, whereas the negative tick model was more dispersed. In addition, the predicted extent/range was smaller for the positive tick model than the negative tick model. When examining the influential variables of these models, the variables that include cold temperatures, seasonal temperature changes, and altitude were important and were common to both models, although by different magnitudes.
The Maxent software produced habitat species models of the probability of presence for positive and negative D. variabilis ticks. When considering the influential variables utilized in these models, it is not surprising that temperature was shown as an important environmental condition. Previous studies have shown that ticks are sensitive to temperature extremes (Atkinson 2012) and that covariates related to Dermacentor behavior include temperature (maximum, minimum, and mean) variables (Monello and Gompper 2007). Furthermore, it has been reported that host-seeking D. variabilis prefers temperatures above 10°C (Harlan and Foster 1986) and that this behavior decreases on cooler, less clear days (Sonenshine et al. 1966). Therefore, it stands to reason that our study's prediction as to where R. montanensis-positive D. variabilis ticks are is so highly based on temperature. Altitude can affect temperature as well, but the impact of altitude in these models could be biased as MTFs are generally not located in higher altitude/mountainous regions. The temperature and time of year when the HTTKP ticks were reported were not included in our study.
As for vector causes, nature suggests that there is competition between closely related species that may limit or prevent the coexistence of one or more species, such as rickettsial organisms (Telford 2009). This is demonstrated in D. variabilis tick populations where only one SFGR was detected per tick based on collections from diverse geographical locations (Socolovschi et al. 2009). These phenomena could be the result of transovarial interference, which could potentially interfere or block a secondary infection, resulting in D. variabilis ticks only maintaining a single rickettsial species (Macaluso et al. 2002, Socolovschi et al. 2009, Telford 2009). These factors could, in part, potentially explain the smaller region shown for R. montanensis compared with that of the D. variabilis having tested negative for R. montanensis.
Published spatial studies on non-R. rickettsii SFGR, such as R. montanensis and Rickettsia parkeri, appear to be limited due to the lack of recognition of their potential importance. This is largely due to the determination that species detection by nonmolecular serological methods has not shown species specificity, indicating that many less pathogenic rickettsiae could be the cause of spotted fever illnesses (Apperson et al. 2008, Stromdahl et al. 2011, McQuiston et al. 2012, 2014, Wood and Artsob 2012, Barrett et al. 2014). Distribution maps have been generated for D. variabilis and other tick species to investigate tick behavior and/or rickettsial species (or closely related species), but at the individual state level (Clark et al. 1998, Smith et al. 2010, Stromdahl et al. 2011, Gaines et al. 2014, Nadolny et al. 2014). As for ENMs, R. montanensis models have not been published to date, although statistical and mathematical models have been produced. Kollars et al. published an ANOVA model for D. variabilis and RMSF, Harlan et al. published a model for D. variabilis questing behavior based on multivariate analysis of micrometeorologic and microenvironmental parameters, and Gaff et al. created mathematical models to investigate tick control and disease dynamics primarily in regard to Ehrlichia chaffeensis (rickettsial relative) (Harlan and Foster 1990, Kollars Jr. 1996, Gaff and Gross 2007). In addition, global habitat models and predictive risk models for Anaplasma phagocytophilum and E. chaffeensis were created using environmental and ecological variables based on logistic regression (Manangan et al. 2007, Wimberly et al. 2008a, 2008b). In 2012, Atkinson published preliminary results where a lack of spatial concordance between D. variabilis and RMSF was found (Atkinson et al. 2012). Furthermore, Atkinson's study used Maxent-based habitat suitability and disease incidence rates to evaluate spatial concordance (Atkinson et al. 2012).
Further evaluation of the model's factors determined to be influential in relation to the predicted range is warranted and could help elucidate why the range of R. montanensis is more restricted than the range of D. variabilis. Factors that influence R. montanensis-positive D. variabilis ticks that need to be ascertained and investigated include sampling/collection, environmental and topographical impact, vector characteristics (coinfection or infection suppression by endosymbionts), and host density. The data obtained by analyzing factors will be useful to help assess why certain regions are more (or less) favorable for R. montanensis-positive D. variabilis ticks. Additional studies using traditional tick collection methods (e.g., tick dragging, flagging, and CO2 trapping) with accurate records of collection locations (GPS coordinates) over a wide area of diverse habitats will be helpful in confirming our findings. Creating a larger dataset that incorporates greater habitat and geographical diversity is important in further understanding R. montanensis and its relationship to D. variabilis migration and host movement (Sonenshine et al. 1966). Therefore, in conjunction with expanding the sampling of habitat diversity, particularly beyond primarily urbanized MTFs, collections from states that are underrepresented in the current study should be included in future datasets. These states or U.S. regions include southeastern United States (southern halves of Louisiana, Mississippi, Alabama, Georgia, and Florida), California, and Washington State, where D. variabilis has been reported as part of the HTTKP or CDC (
The prevalence, distribution, and ENM results of R. montanensis-positive ticks provide further insight into the evolving field of rickettsiology and into the possibility of misdiagnosed SFGR, the evaluation of fevers of unknown origin, and the better understanding of emerging infectious diseases (Paddock et al. 2004, Paddock 2005, Whitman et al. 2007, Stromdahl et al. 2011, Wood and Artsob 2012, Parola et al. 2013, Barrett et al. 2014, McQuiston et al. 2014). As underestimated tick-borne febrile and afebrile diseases are better understood, the ability to treat and prevent the related illnesses also improves, as has been the case for Tidewater Spotted Fever caused by R. parkeri found in the Gulf Coast Tick (Whitman et al. 2007). Furthermore, the findings from this and related studies could be adapted to other non-tick-borne rickettsioses, such as flea-borne spotted fever caused by Rickettsia felis (Reif and Macaluso 2009, Luce-Fedrow et al. 2014), human monocytic ehrlichiosis caused by E. chaffeensis (Paddock and Childs 2003), and rickettsialpox caused by Rickettsia akari (Paddock et al. 2004, Whitman et al. 2007).
It has been documented that determining and predicting the geographical distribution of any pathogen can be complicated by the dynamic interaction between bacteria, their vectors, and their hosts (Manangan et al. 2007). Although the information and results obtained from our study are MTF based, the potential distribution of R. montanensis provides a preliminary view of where R. montanensis may be found and potentially impact human health. Future studies need to incorporate areas, both geographical and environmental, which are not represented within this study. These sorts of studies will help to create a larger data set of unique locations and additional environmental variables that can be compared with the currently developed models. Our results will help to create a more detailed understanding of R. montanensis prevalence and distribution among people parasitized with D. variabilis in the eastern half of United States. These data will be useful in assisting with future R. montanensis surveillance and prevention programs. We acknowledge that the results of this study may be limited due to the tick sampling method and lack of spatial accuracy of the collection samples. However, and most importantly, the data provide the first study concerning the details of the distribution and potential risk areas associated with R. montanensis-positive D. variabilis found parasitizing humans.
Footnotes
Acknowledgments
The authors thank Dr. Chad Porter for his statistical counseling. The views expressed in this article are those of the authors and do not necessarily represent the official policy or position of the Department of the Navy, Department of Defense, the U.S. Government, the Uniformed Services University of the Health Sciences, or the Henry M. Jackson Foundation. This project was funded by the Department of Defense Global Emerging Infections System (GEIS), work unit 0000188M.0931.001.A0074. A.L.R. and E.Y.S. are employees of the U.S. Government and their work was prepared as part of their official duties. Title 17 U.S.C. §105 provides that “Copyright protection under this title is not available for any work of the United States Government.” Title 17 U.S.C. §101 defines a U.S. Government work as a work prepared by a military service member or employee of the U.S. Government as part of that person's official duties.
Author Disclosure Statement
No competing financial interests exist.