
Abstract
Background:
Alkhumra hemorrhagic fever virus (AHFV) is a flavivirus that was discovered in 1995 in Saudi Arabia. Clinical manifestations of AHFV infection include hemorrhagic fever, hepatitis, and encephalitis with a reported mortality rate as high as 25%. There are no published data on the growth characteristics of AHFV in mammalian cell lines. The objective of this study was to examine the ability of AHFV to grow and propagate in four of the commonly used mammalian cell culture lines and to determine the virus growth curve characteristics in each.
Materials and Methods:
Human epidermoid carcinoma (HEp-2), LLC-MK2, Madin-Darby canine kidney (MDCK), and Vero cell lines were inoculated with AHFV. The virus production by each cell line was determined by growth curve studies. Mean titers were calculated and expressed as median tissue culture infective dose per mL (TCID50/mL).
Results:
AHFV grew and propagated to variable titers in the employed cell lines. The highest mean titers were observed in the LLC-MK2, followed by the MDCK, Vero, and HEP-2, in descending order.
Conclusions:
The growth curve studies showed that AHFV can propagate in the four types of cell lines to variable titers. LLC-MK2 cells are superior to MDCK, Vero, and HEP-2 for propagation of AHFV.
Introduction
A
AHFV was recently reported to propagate in mosquito and tick cells (Madani et al. 2012b, Madani et al. 2013). However, no published data are yet available on the differential ability of mammalian cell culture lines to propagate AHFV. The objective of this study was to examine the ability of AHFV to grow and propagate in some commonly used mammalian cell culture lines and to determine the virus growth curve for each.
Materials and Methods
Cell culture lines
The continuous rhesus monkey kidney (LLC-MK2, ATCC CCL-7), the Madin-Darby canine kidney (MDCK, ATCC CCL-34), the African green monkey kidney (Vero, ATCC CCL-81), and the human epidermoid carcinoma (HEp-2, ATCC CCL-23) cell lines (VIRCELL, Granada, Spain) were used for this study.
AHFV
The virus used for this study (designated AHFV/997/Nj/09/SA) was originally isolated from a patient's blood in baby Wistar rat brains during the outbreak of the disease that occurred in Najran, Saudi Arabia, in 2008–2009 (Madani et al. 2011, Madani et al. 2014a). Its original titer was 109.4 Rat Lethal Dose50/mL (RLD50/mL). It was subsequently inoculated in each of the LLC-MK2, MDCK, Vero, and HEp-2 cell lines, as described below.
Virus passage in the cell culture lines
Monolayers of each of the four cell lines were grown in screw-cap Corning cell culture tubes at 37°C in Eagle's minimum essential medium (EMEM) supplemented with 10% fetal calf serum (FCS) to a concentration of 106 cells/mL. When the monolayers were 70% confluent, growth medium removed from each tube was inoculated with 0.1 mL of the AHFV-Wistar rat brain suspension and incubated at 37°C for 1 h to adsorb (Madani et al. 2011, Madani et al. 2014a). This was followed by the addition of 1 mL of EMEM maintenance medium (containing 2% FCS) and incubation at 37°C with daily observation for discernible cytopathic effect (CPE). When the CPE was above 50% in the monolayer, the tubes were stored at −86°C. This was followed by thawing, vortexing, and spinning at 492 × g for 10 min at 4°C. The supernatant fluid was collected and used to inoculate new monolayers of the same cell line. The second passage from each cell line was titrated in its homologous cells, as described by Madani et al. (2014b), and used in the growth curve experiments as described below. The median tissue culture infective dose per mL (TCID50) was calculated according to Reed and Muench (1938), and the virus titers of the four cell lines were adjusted to the same level (titer of 105 TCID50) to ensure similar virus concentration was used in the growth curve experiments.
Growth curve studies
Cell monolayers of each cell line were grown in forty screw-cap Corning cell culture tubes at 37°C in EMEM supplemented with 10% FCS. Twenty-four tubes from each cell line were inoculated with the AHFV cell suspension (titer of 105 TCID50) from the second passage of the same cell line at a multiplicity of infection (MOI) of 0.1 and incubated at 37°C for 1 h to adsorb. The inoculums were tilted and the monolayers were washed twice with phosphate-buffered saline (PBS), pH 7.4. This was followed by the addition of 1 mL of EMEM maintenance medium (containing 2% FCS) and incubation at 37°C with daily observation for discernible CPE. Sixteen tubes from each cell line were left as uninoculated controls. Three of the inoculated tubes and two uninoculated controls from each cell line were removed daily from the incubator and stored at −86°C. This exercise extended for 8 days postinoculation of the cell lines. The growth curve experiments were repeated three times for each cell line.
For titration of the virus in the daily collected tubes of each cell line, the tube contents were thawed, vortexed, and spun at 492 × g for 10 min at 4°C. The supernatant fluids from tubes of the same collection date were pooled and virus titration was conducted in the same cell line using 10-fold dilution series in tissue culture microplates as described by Madani et al. (2014b). The TCID50 for the relevant cell line was calculated according to the Reed and Muench method (1938). Control wells containing uninoculated monolayers of each cell line were included in the tests. The mean titers and standard deviations were calculated using the ANOVA for the four cell lines.
Indirect fluorescent antibody test
AHFV-infected cell culture monolayers of each cell line were harvested 48 h postinoculation, pelleted by centrifugation (492 g) for 10 min at 4°C, and deposited on Teflon-coated 8-well slides. The slides were air-dried inside a biosafety cabinet and fixed in chilled acetone/methanol (1:1) for 20 min. The wells were overlaid with 20 μl (1:200 dilution in PBS) of hyperimmune mouse ascitic fluid containing polyclonal antibodies against AHFV prepared using the procedure described by Brandt et al. (1967). Slides were incubated in a moist chamber at 37°C for 60 min before they were washed three times in PBS. The bound antibody was detected with fluorescein isothiocyanate (FITC)-conjugated goat anti-mouse IgG (Sigma, Chemicals Co.) with 0.2% Evans blue (Sigma, Chemicals Co.). The slides were washed, mounted with Fluoprep (BioMerieux, Marcy L'Etoile, France), and finally examined under a Leitz fluorescence microscope with appropriate excitation and barrier filtration for FITC.
Results
AHFV growth and propagation in cell culture lines
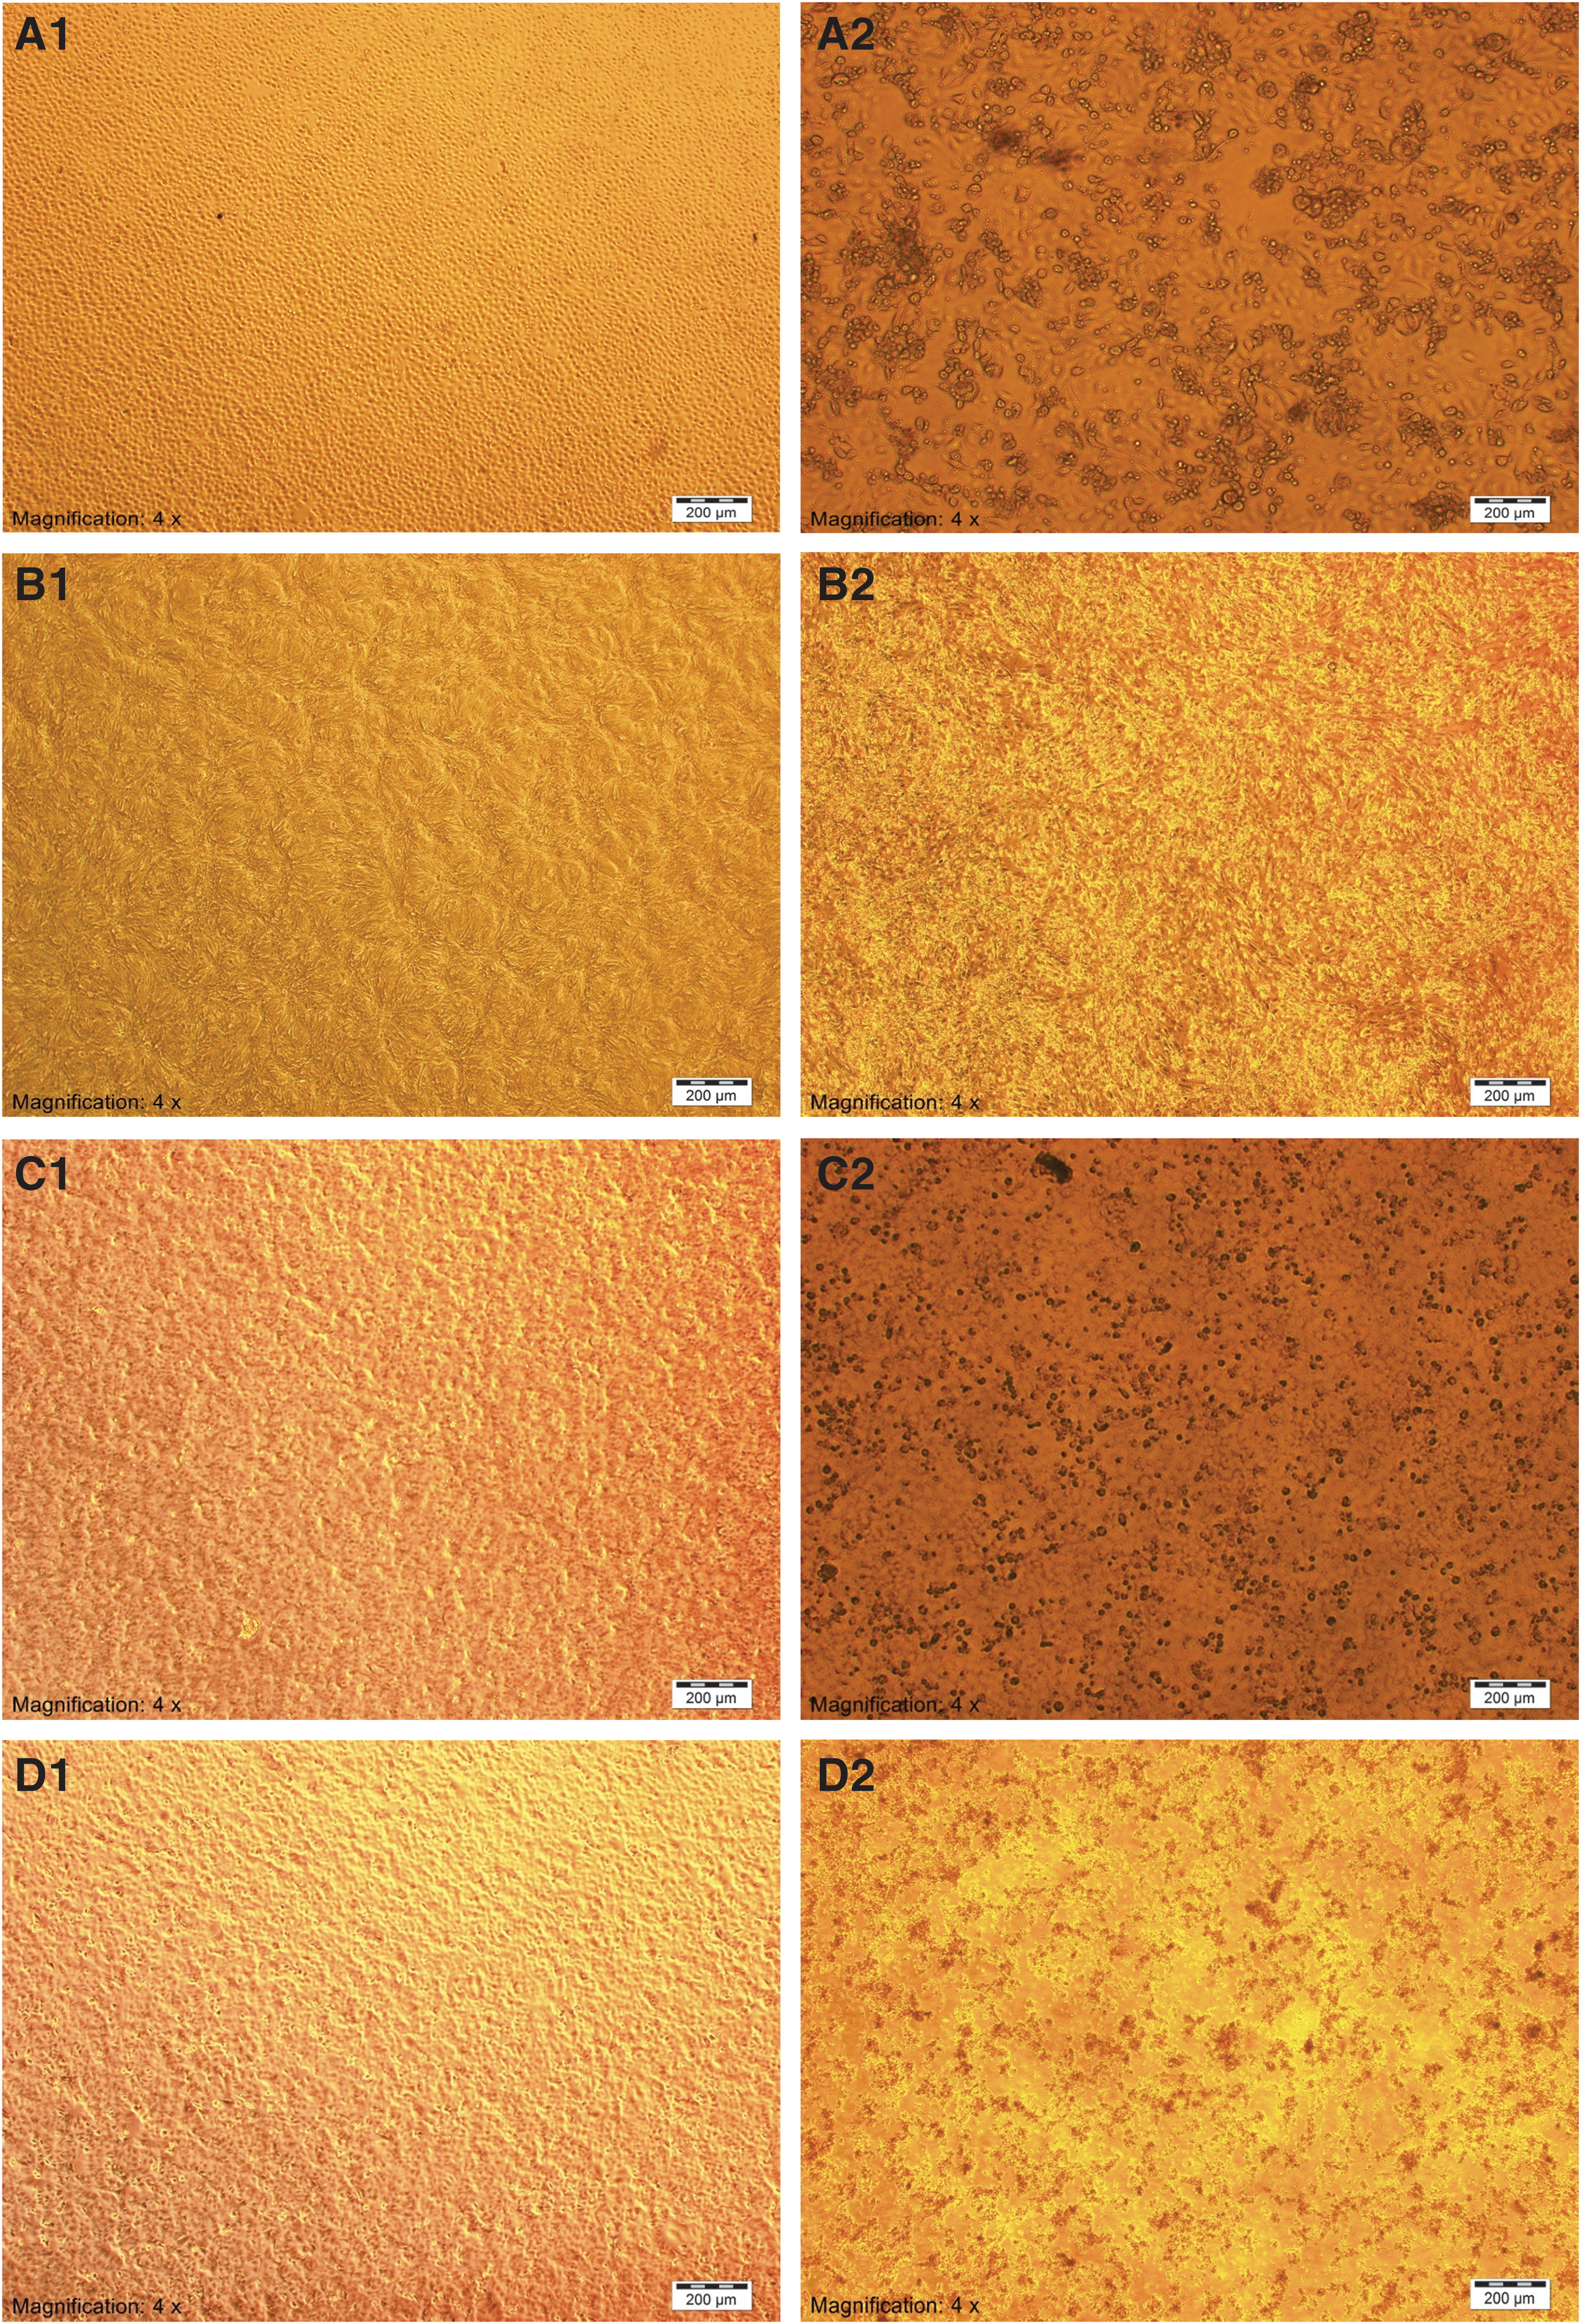
Figure 1 shows the CPE produced by the virus in the monolayers of each cell culture line. The CPE started in all cell lines with cell rounding, followed by cell aggregation, syncytium formation, and eventually cell destruction. The CPE was first observed within 24 h of inoculation of all cell lines. The time span from inoculation to spread of the CPE over the entire cell monolayer varied between cell lines, being 6 days in the LLC-MK2 and 7 days in the MDCK and the Vero cells. In the HEp-2 cells, the cell destruction was incomplete until the end of the experiment on day 8 postinoculation.
The indirect fluorescent antibody test
All four cell lines expressed AHFV antigens in the cytoplasm when tested with indirect fluorescent antibody test (IFAT). Figure 2 shows Vero cells, as an example, before and after infection with AHFV and examination with the IFAT.
Indirect fluorescent antibody test staining of AHFV-infected Vero cell culture monolayers harvested 48 h postinoculation, deposited on Teflon-coated 8-well slides, fixed in chilled acetone/methanol, and overlaid with hyperimmune mouse ascitic fluid containing polyclonal antibodies against AHFV. The bound antibody was detected with fluorescein isothiocyanate (FITC)-conjugated goat anti-mouse IgG (Sigma, Chemicals Co.) with 0.2% Evans blue. Figure
Growth curve studies
The growth curves for AHFV in the different cell lines are illustrated in Figures 3 –6. Two peak titers, each of 107.4TCID50/mL, were seen in the growth curve of the virus in LLC-MK2 cell line; the first on day 2 and the second on day 5 postinoculation (Fig. 3). The titers subsequently declined to reach 105.3 TCID50/mL by day 8 postinoculation. The growth curve of the virus in MDCK cells (Fig. 4) showed a peak titer of 107.0 TCID50/mL that plateaued through days 1–2 postinoculation, after which there was slight drop, up to day 4, followed by a sharp decline to reach 105.0TCID50/mL by day 5 postinoculation, and subsequent further decline to lower titers up to day 8 postinoculation. The growth curve of AHFV in Vero cell line (Fig. 5) showed a peak titer of 106.6TCID50/mL that plateaued on days 2–3 postinoculation, after which the titers declined to reach 105.4TCID50/mL by day 8 postinoculation. The growth curve of AHFV in HEp-2 cell line (Fig. 6) showed three peak titers; the first, 105.4 TCID50/mL, extended as a plateau over the first 2 days postinoculation; the second, 104.9 TCID50/mL, observed on day 4 postinoculation; and the third peak, 104.5 TCID50/mL, recorded at day 7, which declined to 104.2 TCID50/mL by day 8 postinoculation. The ranges of the mean titers were log10 5.3–7.4 in the LLC-MK2, log10 4.5–7.0 in the MDCK, log10 5.4–6.6 in the Vero cells, and log10 4.2–5.4 in the HEp-2 cell lines.

Growth curve of AHFV in LLC-MK2 cell culture inoculated with an MOI of 0.1. Three culture tubes were combined each day and titrated in the same cell line. Data are the logarithmic mean and standard deviation of three experiment repetitions. MOI, multiplicity of infection.

Growth curve of AHFV in MDCK cell culture inoculated with an MOI of 0.1. Three culture tubes were combined each day and titrated in the same cell line. Data are the logarithmic mean and standard deviation of three experiment repetitions.
Growth curve of AHFV in Vero cell culture inoculated with an MOI of 0.1. Three culture tubes were combined each day and titrated in the same cell line. Data are the logarithmic mean and standard deviation of three experiment repetitions.
Growth curve of AHFV in HEp-2 cell culture inoculated with an MOI of 0.1. Three culture tubes were combined each day and titrated in the same cell line. Data are the logarithmic mean and standard deviation of three experiment repetitions.
Statistical analysis of the results showed that there was significant difference between the growth curves of AHFV in the four cell lines (p < 0.01). The LLC-MK2 had significantly higher mean titers when compared with the Vero and MDCK cell lines (p < 0.05), with the difference being more statistically significant when compared with the HEp-2 cell line (p < 0.001). The growth curve in HEp-2 was significantly lower than that in the other three cell lines (p < 0.001). There was no significant difference between the growth curves in the MDCK and the Vero cell lines (p > 0.05).
Discussion
This study confirmed that AHFV could infect LLC-MK2, MDCK, Vero, and HEP-2 cell lines causing discernible CPE. The AHFV antigen was detected in the infected cells by IFAT.
The results also showed statistically significant difference between the growth curves of the AHFV in the four cell lines. The difference observed between titers in the four cell lines is likely to be due to difference in the viral permissiveness of each cell line and not due to variation in the titer of the virus inoculated in the cell lines as the same virus concentration and MOI were used for the cell lines to ensure that each cell line received the same amount of virus. In spite of the statistically significant difference observed between the growth curves of the AHFV in the four cell lines, a common feature in the patterns of these curves was that the highest mean virus titers were recorded in the early days postinoculation. In the LLC-MK2, the highest titers were observed in the first 6 days postinoculation; in the MDCK, in the first four days postinoculation; for the Vero, in the first 5 days postinoculation; and in the HEp-2, in the first 4 days postinoculation. Following the initial days of high titers, in each of the four cell lines, there was subsequently a statistically significant drop in the titers until the end of the experiment. As the monolayers of each cell line were thoroughly washed from the inoculums, the obtained titers in the early days postinoculation in the four cell lines were likely primarily due to virus replication and not due to the virus present in the inoculums, as also indicated by the presence of CPE in the four monolayers from day 1 postinoculation and progression until the end of the experiments on day 8 postinoculation.
The growth curve in the LLC-MK2 (Fig. 3) showed two phases of virus replication, with two peak titers of equal values, one on day 2 postinoculation and the other on day 5 postinoculation. The growth curve of the virus in MDCK cells (Fig. 4) showed a plateau in the first 4 days postinoculation, followed by a sharp decline on day 5 and then a slower progressive decline up to day 8 postinoculation. The growth curve of AHFV in Vero cells (Fig. 5) showed a rise of titer from day 1 postinoculation, a plateau on days 2–3, followed by progressive decline to low levels by day 8 postinoculation. The growth curve of AHFV in HEp-2 cell line (Fig. 6) showed three peak titers. The first and highest was on days 1–2 postinoculation; a second lower peak on day 4; and a third even lower peak on day 7, followed by a decline on day 8 postinoculation. In comparison with the other cell lines, the titers in HEp-2 cell line were the lowest and the CPE in this cell line was slow and nonprogressive, indicating that HEp-2 cells are low in their permissiveness to the AHFV.
Previous studies on replication of other flaviviruses in various mammalian cell lines reported different patterns of growth curves. For example, Chambers et al. (2003) showed that peak titers of the yellow fever and dengue viruses were attained within the first 48 and 72 h, respectively, following infection of Vero and BHK-21 cell culture. The growth curves for Japanese encephalitis virus in the continuous cell strains of hamster lung, hamster embryonic skin and muscle, and WI-38 cells indicated that the virus peak was detected on day 3 postinoculation (Lee et al. 1965). Shameem et al. (1988) also reported a peak titer for the Japanese encephalitis virus on day 3 postinoculation of the BHK-21 cells. The growth curves of the West Nile virus in the human embryonic kidney cells (Hek 293) and the chicken embryo fibroblast cells (DF-1) showed that high virus titers were reached on days 2–4 postinoculation, with the peak observed on day 3 postinoculation of the Hek293 and between days 1 and 3 postinoculation of the DF-1 cells (Aliota et al. 2012). It was reported that the growth curves of the West Nile virus showed peak titers on days 2–3 postinoculation of the cells, adenocarcinomic human alveolar basal epithelial cells (A549) and Vero cells (Orlinger et al. 2011).
The pattern of the growth curves of AHFV in the cell lines used in our study showed that the LLC-MK2 cells could maintain the highest titers of the four cell lines throughout the days of study; followed by the Vero, MDCK, and the HEp-2, respectively. In addition to its ability to produce higher virus titers, the LLC-MK2 cells are also superior to other cell lines because they are more economical to utilize as they have a higher split ratio and can give confluent monolayers within 2–3 days. Therefore, the LLC-MK2 cell line is currently the preferred choice in our laboratory for propagation of AHFV for various research purposes.
In conclusion, AHFV could infect LLC-MK2, MDCK, Vero, and HEP-2 cell lines causing discernible CPE; however, the LLC-MK2 cell line was superior to the other cell lines for propagation of AHFV.
Footnotes
Acknowledgments
This study was supported through the Scientific Chair of Sheikh Mohammad Hussein Al-Amoudi for Viral Hemorrhagic Fever, King Abdulaziz University, Jeddah, Saudi Arabia. The authors thank the technologist, Mrs. Noora Algaidy, for her technical assistance and the statistician, Mr. S.B. Barnawi, for the statistical analysis. The sponsor, Sheikh Mohammed Hussein Al-Amoudi, had no involvement in the study design, in the collection, analysis and interpretation of data, in the writing of the manuscript, or in the decision to submit the manuscript for publication.
Authors' contributions
T.A.M., E.M.E.A., E.I.A., and H.M.S.A. conceived and designed the study; E.M.E.A., and A.M.H. performed the viral culture and IFAT; E.M.E.A. performed the viral titration and growth curve studies; T.G.K. provided the hyperimmune mouse ascitic fluid containing polyclonal antibodies against AHFV; all of the authors analyzed and interpreted the data; T.A.M. and E.M.E.A. wrote the manuscript; E.I.A., H.M.S.A., A.M.H., and T.G.K. critically revised the manuscript. All authors read and approved the final version. T.A.M. is the guarantor of the article.
Ethical approval
Ethical approval was obtained from the Research Ethics Committee at the Faculty of Medicine, King Abdulaziz University (Jeddah, Saudi Arabia).
Author Disclosure Statement
No competing financial interests exist.