




Abstract
Japanese encephalitis (JE) is one of the leading causes of viral encephalitis in Southeast Asia, particularly India. The major vector transmitting the disease, Culex tritaeniorhynchus, breeds in paddy field and its associated water bodies. The incidence of human infection usually occurs after the peak in vector abundance. Earlier, an association between JE vector abundance and paddy growth was demonstrated in Bellary district of Karnataka state, India, using radar satellite (RISAT 1) data. In this study, an attempt has been made to validate this phenomenon with the data collected from Uttar Pradesh state, using moderate resolution imaging spectroradiometer data.
Introduction
O
Materials and Methods
Study area
In UP, 7 of the total of 71 districts are highly endemic, and among them, Gorakhpur district (between 26°45′ and 26°76′N and 83°21′ and 83°36′E) is worst affected (Sanjay et al. 2017). In Gorakhpur, two JE endemic blocks, namely, Campierganj (235 km2) and Belghat (185 km2), were selected for the study. There is mixed vegetation although paddy cultivation is predominant with large number of varied water bodies. Paddy is grown in two seasons (“rabi”: November–March and “kharif”: June–October). The incidence of JE cases occurs mainly during “kharif” season, and hence the JE vector density measurements were made only to cover this season for two consecutive years (2014 and 2015) following the procedure adopted earlier (Raju et al. 2016).
In this study, the imageries from RISAT 1 could not be obtained for previous dates to validate the phenomenon (association between JE vector abundance and paddy growth) developed in the earlier study (Raju et al. 2016). Alternatively, the normalized difference vegetation index (NDVI) derived from any space-borne satellite (multispectral scanner data) if available could be used as an indicator to study the vegetation/crop phenology. Thus, moderate resolution imaging spectroradiometer (MODIS) data available on archives were considered as an alternative satellite data, as it provides substantially improved radiometric and geometric property of mixed vegetation types in an area within a season/annual cycle (Xiangming et al. 2005, Dailiang et al. 2011, Arika and Thomas 2012, Yuting et al. 2016). Furthermore, it aids in identifying the specific phenological behavior characterized by paddy growth in a mixed vegetation area, which is common in crop land regions in Southeast Asia (similar to that of our study areas).
MODIS data are available at the website: (
Co-ordinates of the entomological collection sites and the corresponding paddy fields were collected for the selected two study blocks, using the global positioning systems. Databases were developed on GIS platform, using ArcGIS 10 (ESRI, Redlands, CA) and ERDAS IMAGINE 9 (ERDAS, Atlanta, GA) software.
The monthly data (June–December) on vector abundance and NDVI for 2 years in each study block were averaged for the corresponding months. Since a scatter plot of the mentioned two variables indicated a nonlinear pattern, an exponential model was fitted for describing the relationship between them. The equation of the model is as follows:
where “a” and “b” are the two parameters of the model to be estimated by fitting the model to the observed data. The model is linearized by taking logarithmic transformation on both sides of the equation and is as follows:
The log-transformed vector abundance data were used as a dependent variable and the NDVI as a predictor. The IBM-SPSS software was used for estimating model parameters. The model fit was assessed by the coefficient of determination (R 2) and p value. Residual analysis was carried out to check assumptions of linear regression analysis (observations are independent and normally distributed and have constant variance). The Durbin–Watson statistic “d” and its 95% confidence interval (d L and d U) were used to test whether the serial correlation among the residuals is significantly different from 0. If the calculated “d” value is greater than d U, the correlation is not different from 0. A “zero” correlation indicates that the observations are independent over different months. The normal probability plot and a plot of the residuals against the predicted logarithmic per man-hour density (PMD) values were visually inspected to check for normality condition and constant variance, respectively.
Results and Discussion
The derived NDVI values during “kharif” season ranged between 0.29 (June) and 0.68 (August). From the vegetative stage of paddy during July, the NDVI value (0.55) started increasing, and reached a peak in its flowering stage during August (0.68). Then, the values decline in subsequent stages of paddy senescence period. However, since the changes in phenological properties of other vegetation was slow compared to paddy, the NDVI for other vegetation remained without much change during the paddy period, and hence noncrop vegetation was masked out for phenological analysis purpose.
The vector data, in terms of PMD of Cx. tritaeniorhynchus collected during the mentioned period, were used to assess its relationship with paddy growth in mixed vegetation, using the derived NDVI values. Regression analysis revealed that the PMD exponentially increased with NDVI (b = 11.196, R 2 = 0.80, p < 0.0001) (Fig. 1). The R 2 value indicates that NDVI can explain about 80% variation in the observed PMD.
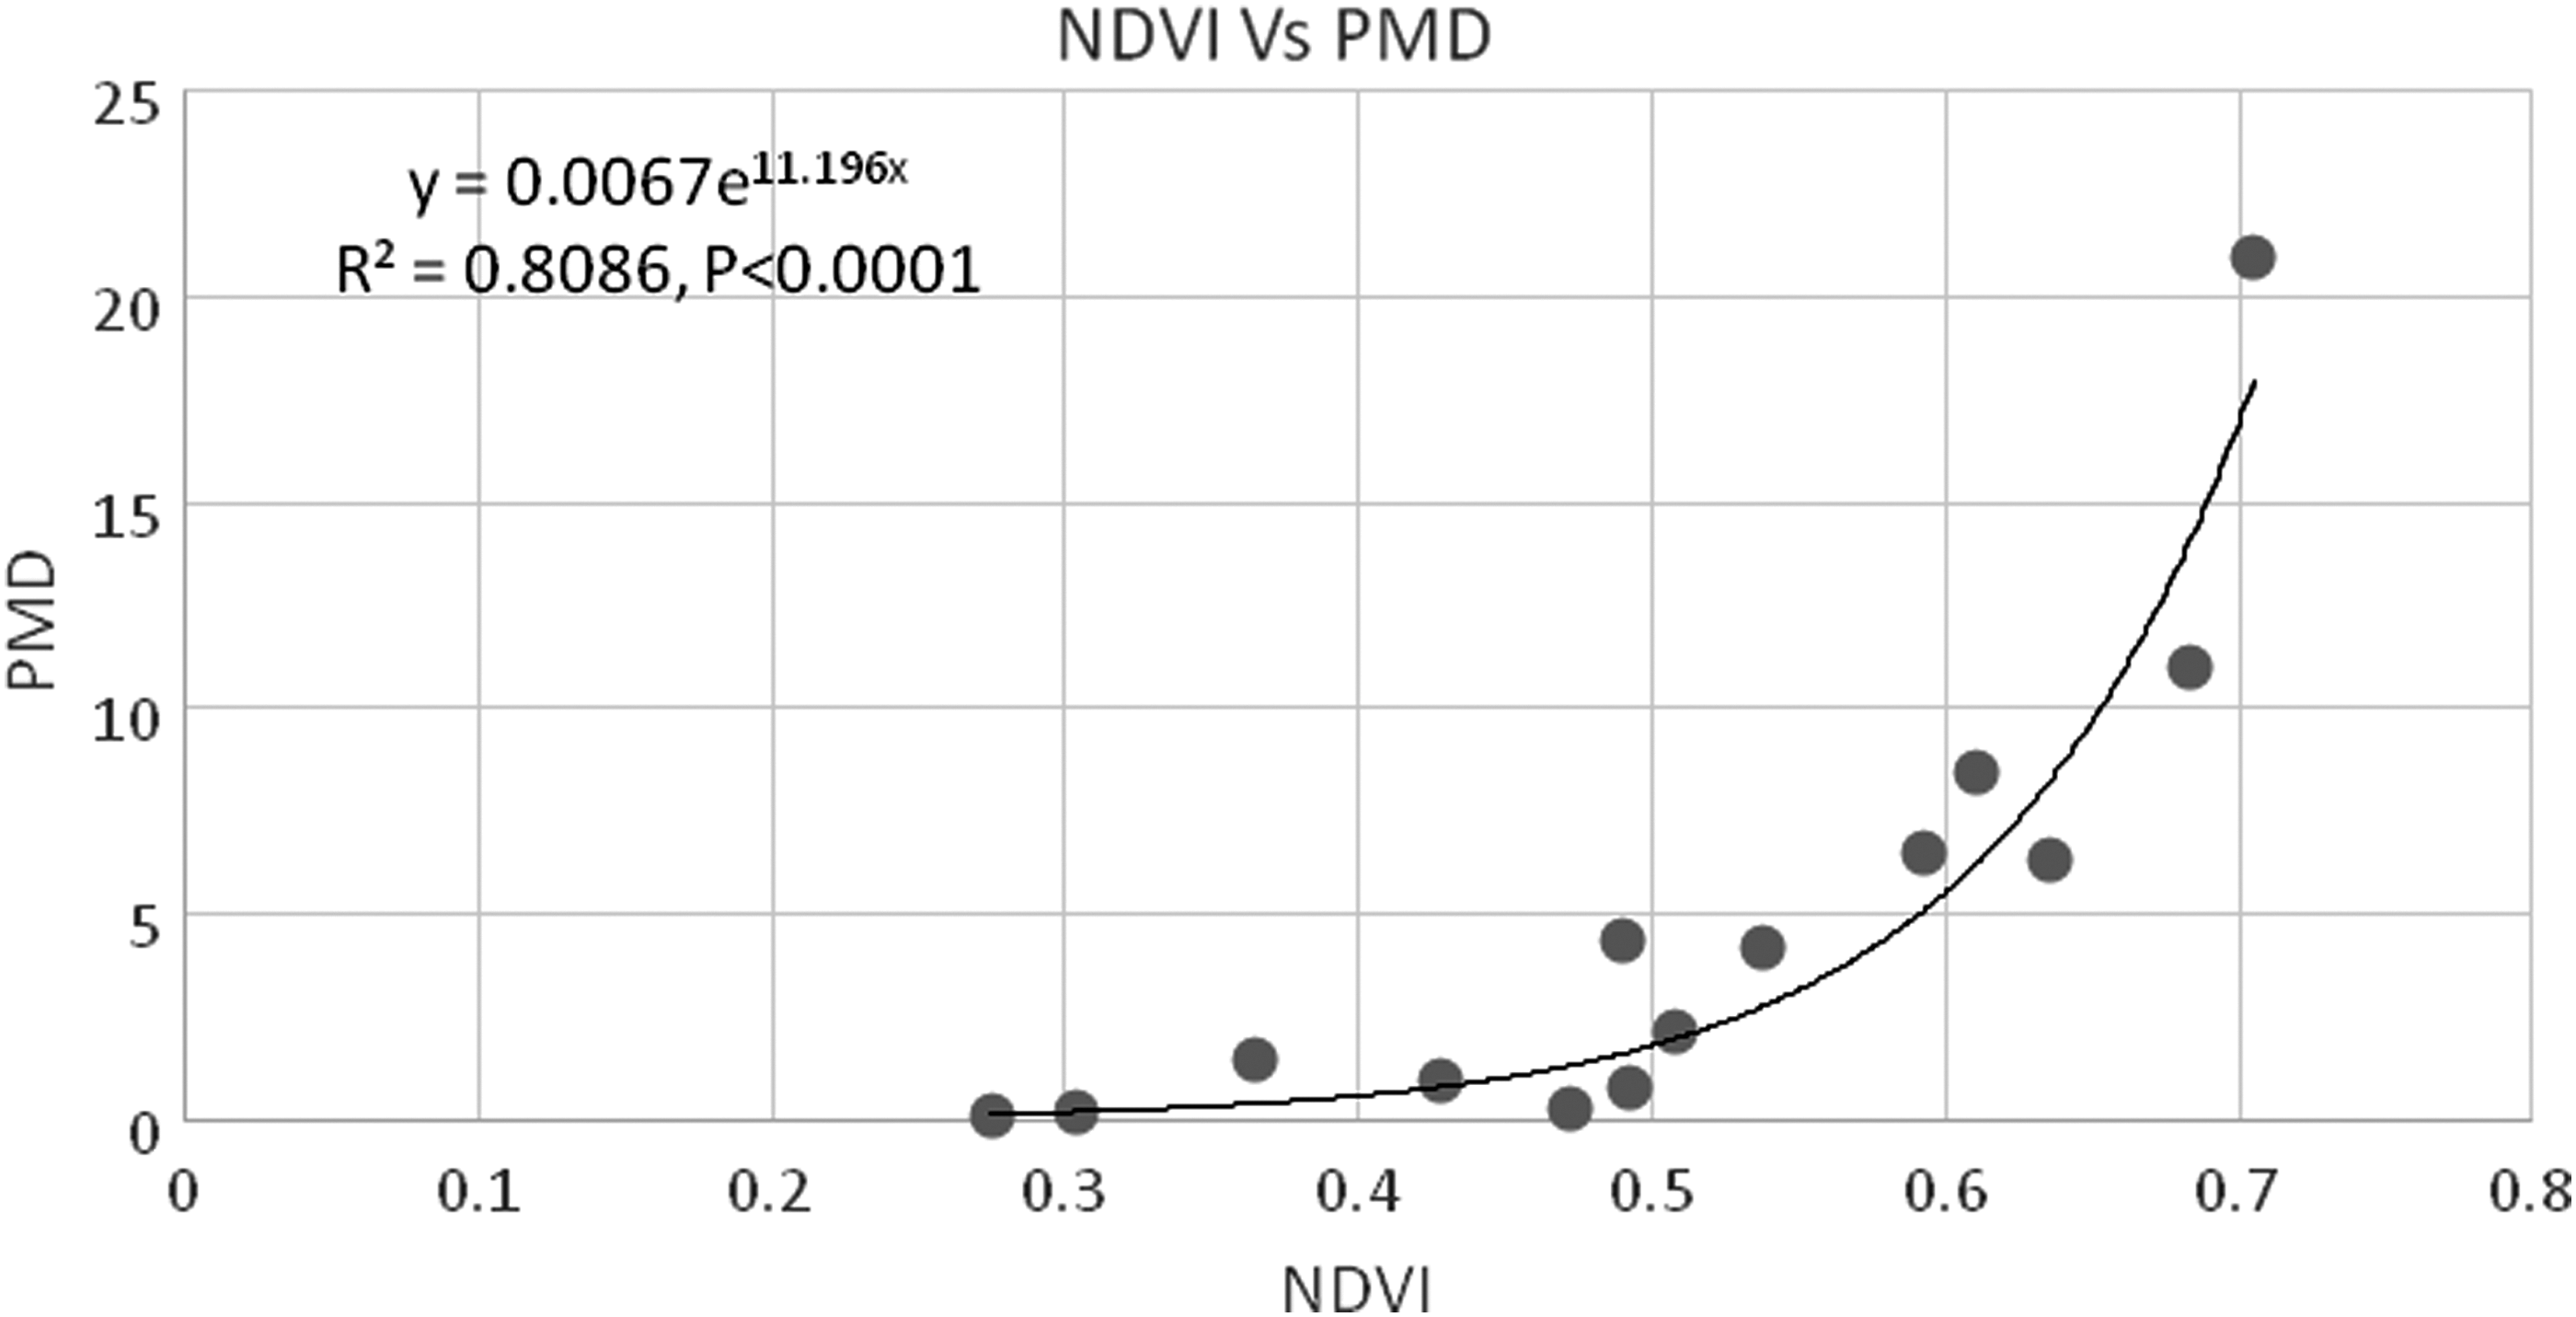
Relationship between NDVI and JE vector density. Dots are observations and the solid line is based on model predictions. JE, Japanese encephalitis; NDVI, normalized difference vegetation index.
A plot of the residuals against the model predicted logarithmic value of PMD showed that the residuals are constant with the predicted values, thus meeting the assumption of constant variance required for linear regression analysis. The calculated Durbin–Watson statistic “d” ( = 1.82) was found to be greater than its upper 95% confidence interval (d U = 1.35), indicating that serial correlation among the residuals is not significantly different from “zero.” This suggests that the observed PMD is independent over different months. A visual inspection of the plot of normal probability against the residuals showed a linear relationship (with “zero” intercept') between them, and thus validates the normality assumption required for the linear regression analysis. The residual analysis showed that the observed data on log-scale meet all the assumptions of linear regression analysis.
The NDVI values derived from MODIS imageries could thus be used as “proxy” for monitoring the vector abundance in mixed vegetation areas in Gorakhpur, where paddy cultivation is predominant.
The association demonstrated earlier between the JE vector abundance and paddy growth (derived from RISAT 1 imageries) (Raju et al. 2016) is thus validated in another setting with MODIS data.
Conclusion
Based on the present findings, it is possible initially to repeat the exercise in smaller areas, and subsequently extend to larger areas and ultimately to develop a country-level risk map in due course for forecasting the JE vector abundance in relation to space. This will help the public health program managers to plan suitable site-specific intervention measures in advance, and prevent the possible occurrence of JE transmission.
Footnotes
Acknowledgments
We thank the NASA LP DAAC for making MODIS data freely available. The contribution of Dr. A.R. Rajavel (Formerly Scientist E, VCRC) for entomological data from the Gorakhpur field sites is gratefully acknowledged.
Authors' Contributions
All authors conceived and designed the study, K.H.K.R. and S.S.M. contributed to data analysis, S.S. and P.J. wrote and edited the article.
Author Disclosure Statement
No conflicting financial interests exist.