
Abstract
Rabies is a zoonotic disease that poses a serious public health risk. To facilitate pet owner compliance with statewide mandatory animal rabies immunization requirements, Maryland statute requires Maryland's local health departments to conduct low-cost animal rabies vaccination clinics at least twice per year. We describe the outputs of these public low-cost clinics by documenting the number of animals vaccinated, number of clinics held annually, and cost per vaccine to pet owners for the years 2015–2016. These data are compared with clinic data from 2006 to 2008, providing insight into changes that have occurred in the decade interval between the surveys and consequently informing future clinic policies and procedures. The Maryland low-cost rabies clinic model allows for the vaccination of roughly 20,000 pet animals per year, representing ∼1% of the Maryland pet population, and can be adopted by other states to allow for more comprehensive rabies vaccination coverage in other regions of the country.
Introduction
The rabies virus (family Rhabdoviridae, genus Lyssavirus) is a zoonotic virus that poses a significant public health risk. Rabies is one of the oldest known infectious diseases worldwide and is considered the infectious disease with the highest case-fatality ratio (Rupprecht et al. 2002). All mammals are believed to be susceptible to rabies, which causes an acute progressive encephalitis. Upon development of clinical signs, the disease is almost always fatal, as there are currently no known effective rabies antiviral drugs (Brown et al. 2016). Transmission most commonly occurs through the bite of an infected animal (Ma et al. 2018).
Rabies causes an estimated 59,000 human deaths per year worldwide, the majority of which are concentrated in Africa and Asia (Taylor and Nel 2015). In the United States, human rabies cases are uncommon. The dramatic reduction in incidence for several decades in the United States has been attributed to vaccination of domestic pets (i.e., cats and dogs), control of stray dog and cat populations, oral rabies vaccination campaigns in wildlife, elimination of the canine rabies virus variant, widely available and timely postexposure prophylaxis, and effective public and provider outreach (Petersen and Rupprecht 2011, Ma et al. 2018). Animal cases of rabies in the United States, however, are far more common; the most recent national surveillance update from 2016 reported 4910 identified cases in animals, 91% of which were in wildlife (Ma et al. 2018).
Adherence to a regular rabies vaccination schedule is critical to protect domestic pets against recognized and unrecognized rabies exposures, such as contact with wildlife (Brown et al. 2016). In addition to protecting the animals themselves, routine vaccination of domestic pets helps reduce human exposures to rabid animals. For these reasons, rabies immunization for domestic pets is regulated in the United States at the state level.
Notably, however, there is variability among states in the species that are statutorily required to be vaccinated; although many require the administration of rabies vaccinations to dogs, cats, and ferrets, a few state laws cover only one species (i.e., dogs), and a few states do not mandate rabies vaccinations for any pets (AVMA 2017b). In some circumstances, counties and municipalities may develop more stringent requirements in the absence of statewide laws (Blanton et al. 2010). Variation by state also exists in the statutorily required frequency of rabies vaccinations (AVMA 2017b).
In Maryland, state statute dictates, “(a) Vaccination required—Each person who owns or keeps a dog, cat, or ferret that is 4 months old or older shall have the dog, cat, or ferret vaccinated adequately against rabies,” (Annotated Code of Maryland Health-General Article, Subtitle 3 2005) in accordance with guidelines presented in the Compendium of Animal Rabies Prevention and Control (Brown et al. 2016). In order for a pet to remain current on its rabies vaccinations, a 1-year booster is required after the first immunization, after which recurring immunizations are required every 1 or 3 years depending on the type of vaccine used and species of the pet.
Rabies vaccination is routinely performed by veterinarians in general practice. In addition, to facilitate adherence with mandatory rabies immunization requirements, Maryland statute requires low-cost self-financing public animal rabies vaccination (antirabies) clinics to be held by each of Maryland's 24 local health departments (LHDs) (Annotated Code of Maryland Health-General Article, Rabies, § 18–315) and Maryland regulations specify that these clinics be conducted at least twice annually (Code of Maryland Regulations (COMAR) 10.06.02.10G(3)).
This analysis aimed to describe the outputs of the public low-cost antirabies clinics by documenting the number of animals vaccinated, number of clinics held annually, cost per vaccine, and logistical details across the state of Maryland for the years 2015–2016. Data on animals vaccinated at Maryland's low-cost antirabies clinics were previously collected through survey by the Maryland Department of Health (MDH) Center for Zoonotic and Vectorborne Diseases (CZVBD) for the years 2006–2008 (Mitchell et al. 2012). A comparison of the findings from the two time periods was conducted to provide insight into changes that have occurred in the decade between the surveys, consequently informing future clinic policies and procedures.
Materials and Methods
A web-based survey, adapted from the survey instrument used in 2008, was distributed to LHDs using the online SurveyMonkey™ platform. The survey included 25 multiple-choice and free-response questions regarding the number and species of animals served by the clinics as well as clinic logistics. Follow-up with nonresponding jurisdictions was conducted by phone to achieve a response rate of 100%.
The American Veterinary Medical Association (AVMA) Pet Ownership Calculator formulas (AVMA 2012) were used to calculate dog and cat populations in each jurisdiction based on the number of households as determined from the U.S. Census Bureau's American Community Survey (ACS) (United States Census Bureau 2017). AVMA pet ownership statistics from 2007 and ACS 3-year estimates from 2006 to 2008 were used to derive the 2006–2008 pet ownership values. The most recent AVMA pet ownership statistics from 2012 and ACS 1-year estimates from 2015 were used to derive the 2015–2016 pet ownership values; 1-year ACS estimates from 2015 were not available for eight counties and were approximated using 5-year estimates from 2010 to 2015.
All analyses were performed using Microsoft Excel. Owing to the difference in length of the 2006–2008 and 2015–2016 time periods, the number of animals vaccinated in each jurisdiction was averaged by year to yield a mean number of animals vaccinated per year for each time period and compared using two-sided paired t-tests. Similarly, population-adjusted vaccination rates were compared for the two time periods using two-sided t-tests paired by jurisdiction. Proportions of animals vaccinated were compared using chi-squared tests. For all analyses, values of p < 0.05 were considered significant.
Results
Number of animals vaccinated, 2006–2008
Of the 24 jurisdictions in Maryland, 23 jurisdictions (96%) reported the total number of animals vaccinated at public low-cost antirabies clinics in 2006. All 24 jurisdictions (100%) reported totals for both 2007 and 2008. Twenty-one jurisdictions (88%) provided the number of vaccinations stratified by animal species for 2006 and 22 (92%) provided this information for both 2007 and 2008.
In 2006, a total of 22,638 animals were vaccinated at public low-cost antirabies clinics conducted across 23 jurisdictions in Maryland. From the 21 jurisdictions that reported species-specific data, 13,850 dogs (67% of total), 6715 cats (32%), and 182 ferrets (<1%) were vaccinated. In 2007, a total of 21,604 animals were vaccinated at public low-cost antirabies clinics conducted across 24 jurisdictions in Maryland. From the 22 counties that reported species-specific data, 13,998 dogs (69% of total), 6116 cats (30%), and 209 ferrets (1%) were vaccinated. In 2008, a total of 23,502 animals were vaccinated at public low-cost antirabies clinics conducted across 24 jurisdictions in Maryland. From the 22 counties that reported species-specific data, 15,665 dogs (70% of total), 6489 cats (29%), and 197 ferrets (<1%) were vaccinated.
Number of animals vaccinated, 2015–2016
Of the 24 jurisdictions in Maryland, 23 (96%) reported the total number of animals vaccinated at public low-cost antirabies clinics in 2015, and all 24 jurisdictions (100%) reported totals for 2016. Twenty-one jurisdictions (88%) provided the number of vaccinations stratified by animal species for 2015 and 22 (92%) provided this information for 2016.
In 2015, a total of 20,187 animals were vaccinated at public low-cost antirabies clinics conducted across 23 jurisdictions in Maryland. From the 21 counties that reported species-specific data, 13,197 dogs (69% of total), 5999 cats (31%), and 30 ferrets (<1%) were vaccinated. In 2016, a total of 17,910 animals were vaccinated at public low-cost antirabies clinics conducted across 24 jurisdictions in Maryland. From the 22 jurisdictions that reported species-specific data, 11,643 dogs (68% of total), 5404 cats (32%), and 39 ferrets (<1%) were vaccinated.
Number of animals vaccinated, 2006–2008 versus 2015–2016 time period
During the 2006–2008 time period, the mean number of animals vaccinated per year by jurisdiction was 946 (median 790, range 272–3645); during the 2015–2016 time period, the mean number of animals vaccinated per year by jurisdiction was 811 (median 662, range 114–2771). This difference was not statistically significant when comparing the paired values for each jurisdiction for the two time periods (p = 0.11; Fig. 1). When adjusted for human population in each jurisdiction, the mean number of animals vaccinated per year in the 2006–2008 time period was 9.6 per 1000 persons (median 7.4, range 0.7–32.4) and the mean number of animals vaccinated per year in the 2015–2016 time period was 7.7 per 1000 persons (median 6.0, range 0.2–32.9). This difference was also not statistically significant when comparing the paired values for each jurisdiction for the two time periods (p = 0.12; Fig. 2).
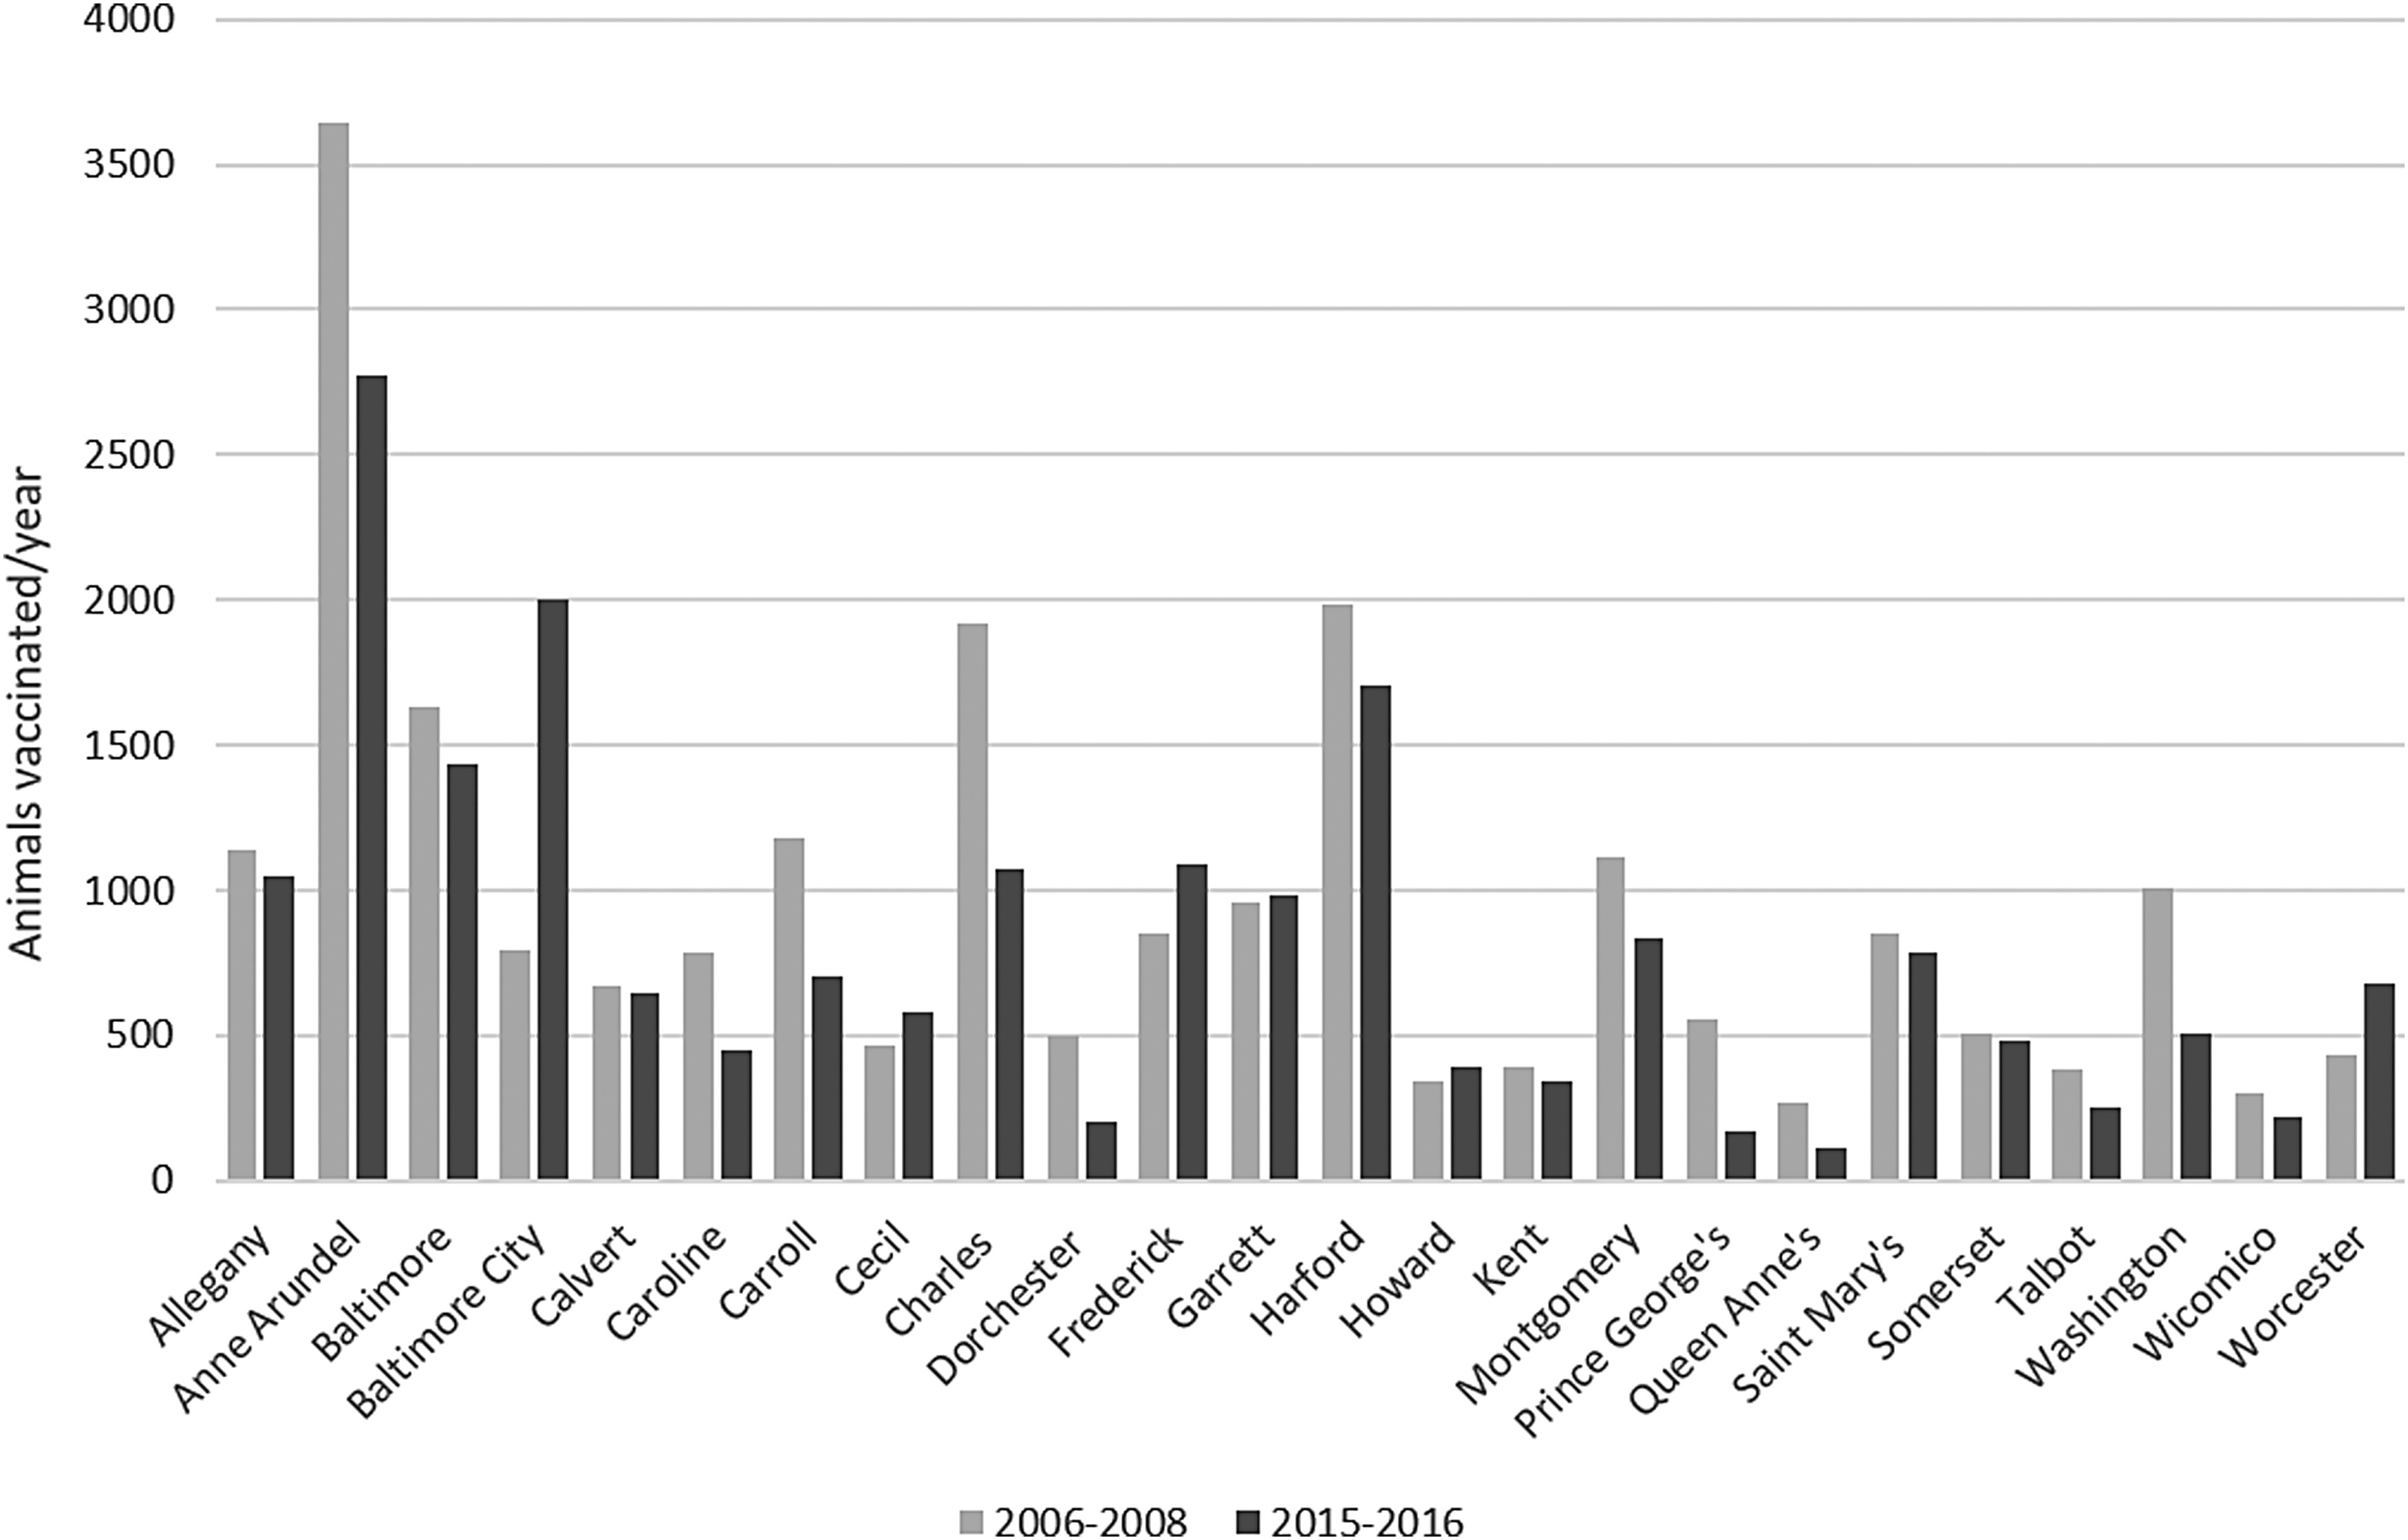
Number of animals vaccinated per year by jurisdiction, 2006–2008 versus 2015–2016. Two-sided t-test, paired by jurisdiction, p = 0.11.
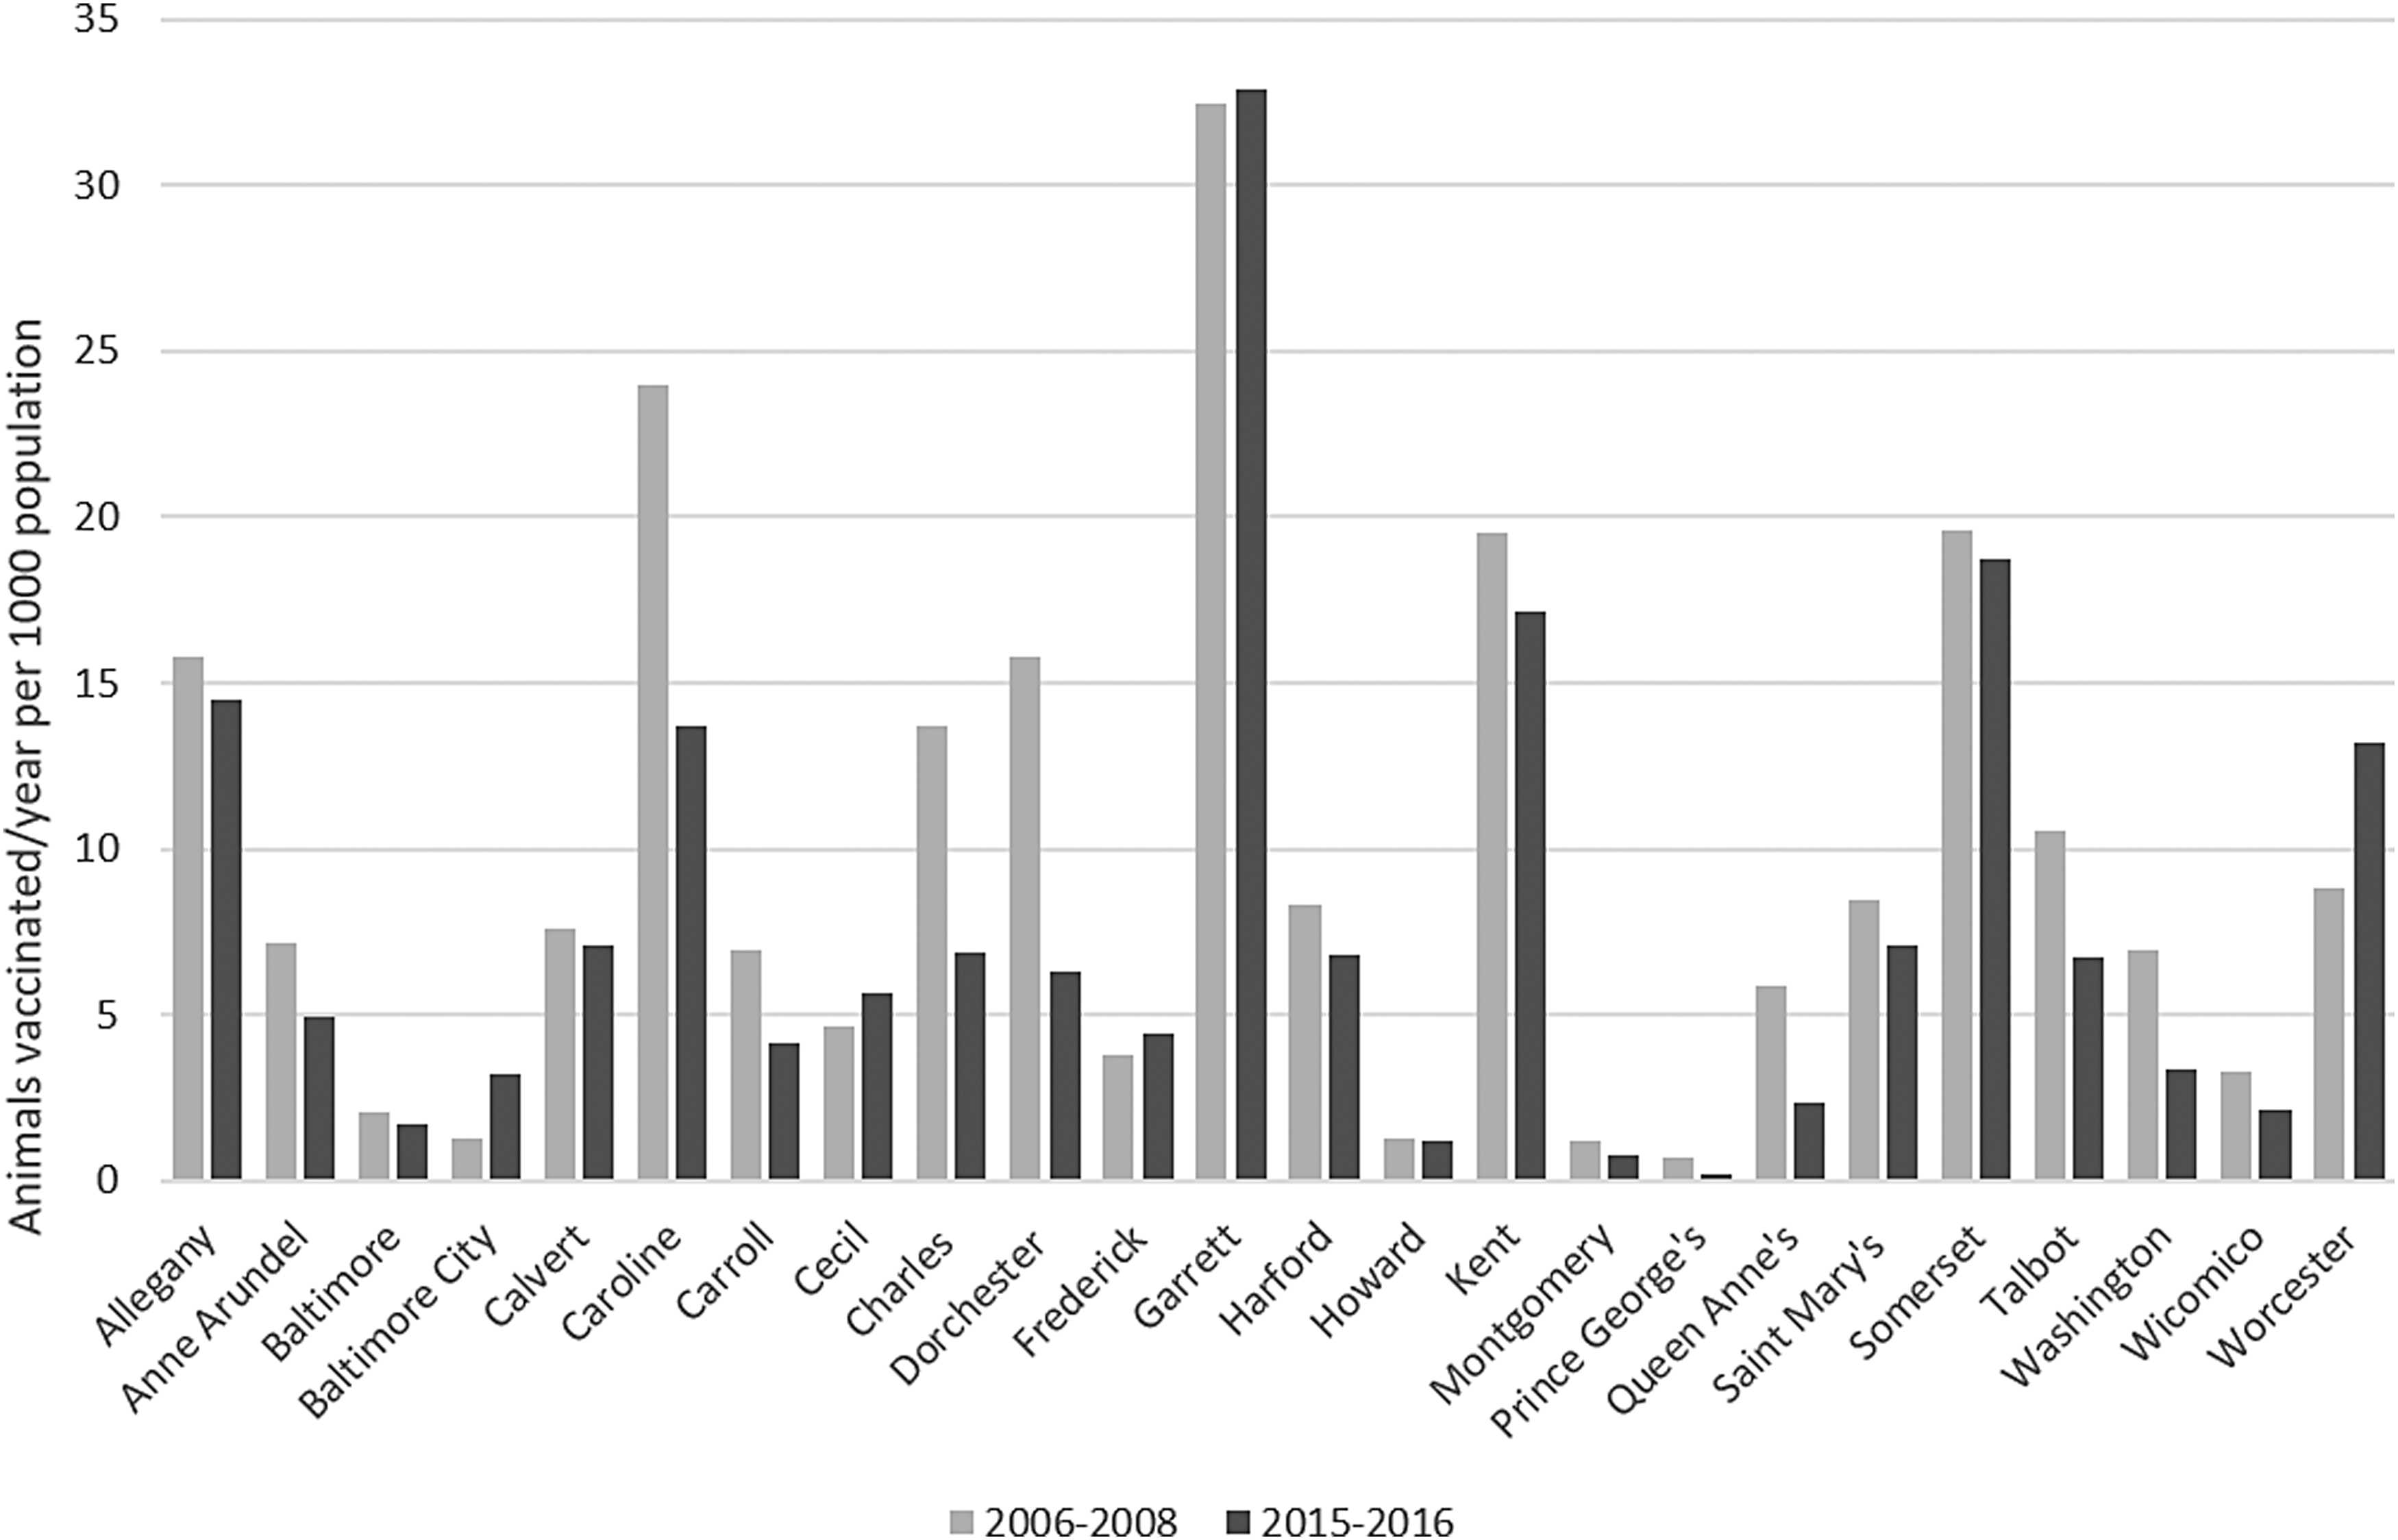
Population-adjusted number of animals vaccinated per year by jurisdiction, 2006–2008 versus 2015–2016. Two-sided t-test, paired by jurisdiction, p = 0.12.
Five counties ranked highest in population-adjusted number of animals vaccinated per year in both 2006–2008 and 2015–2016: Garrett County, Somerset County, Caroline County, Kent County, and Allegany County (Fig. 3).

Percent rural population and population-adjusted number of animals vaccinated per year by jurisdiction.
Stratifying by species provided further information regarding the characteristics of animals receiving rabies vaccinations at the public antirabies clinics. During the 2006–2008 time period, the mean number of dogs vaccinated per year by jurisdiction was 663 (median 535, range 185–2550); during the 2015–2016 time period, the mean number of dogs vaccinated per year by jurisdiction was 576 (median 466, range 66–1981). This difference was not statistically significant when comparing the paired values for each jurisdiction for the two time periods (p = 0.05; Table 1). During the 2006–2008 time period, the mean number of cats vaccinated per year by jurisdiction was 295 (median 241, range 85–1055); during the 2015–2016 time period, the mean number of cats vaccinated per year by jurisdiction was 267 (median 221, range 32–1000). This difference was again not statistically significant (p = 0.43; Table 1). During the 2006–2008 time period, the mean number of ferrets vaccinated per year by jurisdiction was 9 (median 6, range 1–40) and during the 2015–2016 time period, the mean number of ferrets vaccinated per year by jurisdiction was 2 (median 1, range 0–7); this difference was statistically significant (p < 0.01; Table 1).
Species-Specific Number of Animals Vaccinated Per Year by Jurisdiction, 2006–2008 Versus 2015–2016
p Values from two-sided t-test, 2006–2008 vs. 2015–2016, paired by jurisdiction.
Proportion of pets vaccinated
During the period 2006–2008 in Maryland, the estimated total number of owned dogs was 1,464,555 and owned cats was 1,652,259, for a total of 3,116,814 owned dogs and cats. During the period 2015–2016 in Maryland, the estimated total number of owned dogs was 1,421,229 and owned cats was 1,552,644, for a total of 2,973,874 owned dogs and cats. Calculations for ferret ownership were unavailable.
For all owned dogs and cats in Maryland, the overall proportion of pets vaccinated at antirabies clinics per year during the period 2006–2008 was 0.7% (jurisdiction-specific median 1.4%, range 0.1–4.3%). Specifically, the proportion of owned dogs vaccinated at antirabies clinics per year was 1.0% (jurisdiction-specific median 2.0%, range 0.2–6.2%), and the proportion of owned cats vaccinated at antirabies clinics per year was 0.4% (jurisdiction-specific median 0.9%, range 0.05–2.6%). The difference between the proportion of dogs vaccinated and proportion of cats vaccinated per year during this period was significant (p < 0.01).
For all owned dogs and cats in Maryland, the overall proportion of pets vaccinated at antirabies clinics per year during the period 2015–2016 was 0.6% (jurisdiction-specific median 1.0%, range 0.04–4.2%). Specifically, the proportion of owned dogs vaccinated at antirabies clinics per year was 0.9% (jurisdiction-specific median 1.6%, range 0.07–6.4%), and the proportion of owned cats vaccinated at antirabies clinics per year was 0.4% (jurisdiction-specific median 0.7%, range 0.02–2.5%). The difference between the proportion of dogs vaccinated and proportion of cats vaccinated per year during this period was again significant (p < 0.01).
Vaccine cost
The mean cost of a single rabies vaccine across jurisdictions in 2016 was $6.85 per animal (median $6.00, range $0.00–15.00). This represented a statistically significant difference (p < 0.01) from the cost in 2006, during which the mean was $5.36 per animal (median $5.00, range $0.00–15.00; Table 2).
Cost Per Animal Vaccinated and Number of Clinics Held, 2006 Versus 2016
p Values from two-sided t-test, 2006–2008 vs. 2015–2016, paired by jurisdiction.
USD, U.S. dollars.
Clinic logistics and administration
Each local jurisdiction is required by Maryland regulations to hold at least two public antirabies clinics every year. Across all jurisdictions, the mean number of clinics held per year in 2016 was 8.75 (median 6, range 2–52). Notably, Anne Arundel County conducts weekly clinics, an outlier among the Maryland jurisdictions. Twenty-three of the 24 jurisdictions (96%) conducted more than the statutorily required two clinics per year, with 4 jurisdictions conducting at least one clinic per month. The mean number of clinics held in 2006 was 6.41 (median 6, range 2–52); there was no significant difference across all counties in the number of clinics held in 2006 versus 2016 (Table 2).
LHDs were asked to designate the agency within their jurisdiction assuming responsibility for conducting the antirabies clinics. Fifty percent of the clinics are conducted by the LHD, 17% by the local animal control agency, 12% by a local animal shelter or welfare organization, and 21% collaboratively run by multiple agencies.
Discussion
Low-cost public antirabies clinics serve ∼20,000 animals in the state of Maryland every year. This represents a small proportion (1%) of the pet population of the state, which we estimated at 2,973,874 dogs and cats for the year 2015 based on census data; however, it should be noted that these pet population estimates have limited accuracy. Furthermore, this calculation likely underestimates the proportion of pets appropriately vaccinated in Maryland through the public clinics, given that not all pets in Maryland were due to be vaccinated against rabies during 2015–2016 (in many circumstances, the recommended vaccination frequency is every 3 years). Nonetheless, 20,000 animals constitute a substantial number when considering that each unprotected pet poses a risk to any animals and humans exposed to it.
Between the two time periods examined, the number of ferrets vaccinated at the public low-cost antirabies clinics slightly decreased; however, the overall number of animals vaccinated remained consistent. Being that ferrets represent a very small proportion of the pet population, changes in the number of ferrets vaccinated in the decade-long interval are not remarkable. Furthermore, between the years 2006 and 2016, the cost per vaccination slightly increased. The ∼$1 increase in vaccine cost across counties should be interpreted in the context of inflation for the decade, as $5 in 2006 is roughly equal to $5.97 in 2016 (Bureau of Labor Statistics 2018). However, the apparent increase does not appear to have affected the number of pet owners seeking vaccination at these antirabies clinics.
The 1% pet population served by these clinics is consistent with results from a 2015 survey conducted by the AVMA, which found that 1% of respondents used city- or county-sponsored public clinics for veterinary care rather than veterinary clinics/hospitals (AVMA 2017a); this may indicate that these antirabies clinics serve a key demographic that might not otherwise receive veterinary services.
Moreover, based on prior CZVBD data, affordability emerged as a key factor in survey respondents' use of public clinics. Individuals with an annual household income <$30,000 were significantly less likely to indicate that they would take their pets to a private veterinarian for rabies vaccination in the absence of public clinics (Mitchell et al. 2012). The average cost of a canine routine checkup at a private veterinary clinic (inclusive of rabies vaccination) can range widely from $0 up to $500 depending on location and circumstances (AVMA 2017a); although these checkup visits may provide additional preventive health benefits, the average price of $6 for rabies vaccinations through Maryland's public clinics provides an economical alternative for residents for whom higher veterinary costs are not financially feasible.
Garrett County, the jurisdiction that consistently ranked highest in population-adjusted average number of animals vaccinated per year at the antirabies clinics, is the most rural county in the state of Maryland, with an 83.9% rural population per 2010 U.S. Census data (Maryland State Data Center 2012; Fig. 3). Caroline County and Kent County, also in the group of five highest jurisdictions in population-adjusted average number of animals vaccinated per year, follow Garrett County as the second and third most rural counties in the state, with a percent rural population of 76.0% and 72.6%, respectively (Maryland State Data Center 2012; Fig. 3).
A plausible explanation for why rural counties may have higher rates of vaccination at public clinics is that these are largely lower socioeconomic counties, with all 3—Garrett, Caroline, and Kent—ranking among the 10 lowest counties for median family income (2014 dollars) in Maryland (U.S. Census Bureau 2017). It is also possible that veterinary services are less commonly available in rural counties (Villarroel et al. 2010), and thus low-cost clinics provide a service that might not otherwise be available regardless of ability to pay. For these two reasons, low-cost clinics may be of greater appeal in these jurisdictions.
Considering that the majority of animal rabies cases in Maryland (CZVBD 2017) and across the United States (Ma et al. 2018) occur in wildlife, facilitating vaccination of domestic pets in rural settings may be particularly important, as these animals could potentially spend more unsupervised time outdoors and more frequently come into contact with wildlife species such as foxes, skunks, bats, and raccoons.
In international settings where the canine rabies virus variant predominates, the World Health Organization recommends that 70% of dogs in a population should be vaccinated to control rabies (WHO 2014). However, in settings such as the United States where wildlife variants of the virus predominate, there are no estimates for what proportion of dogs and other domestic animals need to be vaccinated to provide an effective buffer between rabid wildlife and humans. Therefore, it is important to maximize vaccination rates in the United States in all pet animals that may contact wildlife.
Cats present a particular challenge in Maryland, being the domestic species in which rabies is most frequently confirmed (CZVBD 2017). This trend is consistent with national data, in which rabid cats greatly outnumber rabid animals of other domestic species (Ma et al. 2018). This is likely due to several reasons, including the opportunity for outdoor cats to have unsupervised interactions with wildlife, a large population of stray and feral cats in the United States (as compared with other domestic species such as dogs), and lower vaccination rates among cats, as demonstrated in this analysis and also documented in other settings (Nelson et al. 1998, Freiwald et al. 2014).
Prior studies have indicated that cats receive routine veterinary care less frequently than dogs due to behavioral challenges presented to owners from high-stress handling and transport (Volk et al. 2011). Although the estimated proportion of cats vaccinated at Maryland's public clinics was less than the proportion of dogs vaccinated in both periods 2006–2008 and 2015–2016, >5000 cats were vaccinated each year, representing a large absolute number for this particularly problematic species. The decrease in proportion may indicate an opportunity for owner outreach regarding the importance of rabies vaccination and routine veterinary care for cats, as well as education regarding low-stress handling and transport techniques to facilitate owner compliance (Volk et al. 2011). Unlike Maryland, not all states require cats to be rabies vaccinated; however, adopting a similar public clinic model in such settings may nonetheless facilitate greater vaccination coverage of a species unlikely to receive routine veterinary care as compared with its canine counterparts.
Based on prior survey data collected by the CZVBD, nearly a quarter (22%) of pet owners surveyed at these public clinics reported that their pets were overdue on their rabies vaccinations (Mitchell et al. 2012). Although adherence to vaccination requirements is difficult to measure, it can be inferred that there would be less compliance with rabies vaccination laws without the presence of these public clinics.
Limitations of these findings include the inexact estimation of the pet population for each jurisdiction, as well as potential inaccuracies in the LHDs' manual tallies of animals vaccinated. Furthermore, the inability to track individual animals for the period from 2006 to 2016 prevents evaluation of the percentage of pets receiving an initial or booster dose of vaccination, as well as owners' adherence to the vaccine schedule for individual animals.
Conclusions
By providing the opportunity for pet owners to have their animals vaccinated at public low-cost antirabies clinics, this Maryland program seeks to minimize the public health effect of potential human rabies exposures from unvaccinated dogs, cats, and ferrets. Adherence to recommended vaccination schedules for domestic animals is key to maintaining low numbers of human rabies cases in the United States, as well as decreasing direct and indirect costs from postexposure prophylaxis administered after exposures to unvaccinated animals. Descriptive analyses of the animal populations served by these clinics provide an estimate of the reach of this public health program, which has stayed relatively consistent for the decade interval between 2006 and 2016.
Although these clinics serve an important role, they are required to be self-financing, which can place a considerable burden on local agencies that are already resource limited. Based on our survey results, there is variability in implementing agencies across jurisdictions, with responsibilities differently distributed between LHDs, animal control agencies, and other agencies across different jurisdictions. Support and evaluation of these clinics by a central agency such as MDH and consequent dissemination of recommendations can allow these antirabies clinics to be maximally effective while remaining inexpensive for pet owners.
Future recommendations may include boosting the number of animals vaccinated through increased advertising, particularly targeted to cat owners. In addition, if further evaluation of rural counties confirms a greater need for public antirabies clinics in those settings, resources can be prioritized for conducting additional clinics in rural counties. Ultimately, features of the Maryland low-cost rabies clinic model can be adopted by other states to facilitate more comprehensive rabies vaccination coverage across other parts of the United States.
Footnotes
Acknowledgments
We thank our partners at Maryland's 24 LHDs for providing clinic data.
R. Gharpure was a student at the Johns Hopkins Bloomberg School of Public Health at the time that this work was completed.
Author Disclosure Statement
No conflicting financial interests exist.