
Abstract
Human infection by West Nile virus (WNV; family Flaviviridae), in some cases, develops into a deadly neuroinvasive disease. WNV risk is thought to be influenced by factors affecting the density of species that promote replication and transmission of the virus, namely peridomestic bird and mosquito species. Factors influencing contact between peridomestic bird and mosquito species and contact between infected mosquitoes and vulnerable human populations may also be important in determining WNV risk in an area. Several urban form and demographic factors, such as population density and the proportion of aged housing units, have been linked with increased WNV risk. Other factors, such as proportion of old-growth forest and wetlands, have been linked to decreased WNV risk. In this study, we aimed to test the effect of several demographic, land use, and urban form variables on WNV risk within neighborhoods of the city of Ottawa, Canada, based on the spatiotemporal clustering of infected mosquitoes and human WNV cases. We found a large positive effect of population density and proportion of aged housing units on WNV risk, using both entomological and epidemiological data. Interestingly, we found a large negative effect of proportion of natural areas in our epidemiological analysis, but not in our entomological analysis. Although our epidemiological data set was relatively small, these results suggest entomological surveillance results should be interpreted alongside other factors when investigating risk to humans. Our study is also one of the few to suggest an effect of demography, land use, and urban form on WNV risk in a Canadian urban center, using both entomological and epidemiological data.
Introduction
Infection by the West Nile virus (WNV; family Flaviviridae) in humans is usually mild or asymptomatic. It may develop into a febrile illness referred to as “West Nile fever,” and in rare cases, may develop into a deadly neuroinvasive disease (Gubler 2007). Since its discovery in Uganda in 1940 (Hughes et al. 1940, Reisen 2013, Chancey et al. 2015), overwintering persistence of the virus has led to invasion and establishment in temperate areas around the world (Reisen 2013). The virus was introduced to North America in 1999, and rapidly spread across the continent in the following years (Reisen 2013, Chancey et al. 2015).
The physiology of several peridomestic bird species (e.g., American robins—Turdus migratorius) permits WNV amplification to high viral loads without severe detrimental effects to the host, allowing infection of blood-feeding vectors (i.e., mosquitoes) without succumbing to the virus (van der Meulen et al. 2005, Kilpatrick et al. 2006, Reisen et al. 2013, VanDalen et al. 2013). Several mosquito species are most efficient at transmitting the virus among avian hosts, maintaining the enzootic transmission cycle (Reisen 2013). These same species live principally in peridomestic habitats. Their proximity and propensity to feed on humans, and their role as vectors in the WNV transmission cycle, means these species pose a public health risk (Reisen 2013). Mosquito species from the Culex genus, such as Culex pipiens, Culex restuans, and Culex tarsalis, are noteworthy examples (Burkett-Cadena et al. 2008, Hamer et al. 2008, 2009, Farajollahi et al. 2011, Andreadis 2012).
Studies in urban centers in northeastern United States have found an effect of demographic factors, such as population density, on Culex mosquito populations (Trawinski and Mackay 2010), and on human WNV cases (Liu et al. 2009). Other studies in eastern United States found links between land use (e.g., proportion of old-growth forest patches and urban wetlands) (Johnson et al. 2012, Levine et al. 2013), and infection rates of avian WNV reservoirs and mosquito vectors. Studies in other cities in the United States have found an effect of urban form, such as proportion of aged housing units (Ruiz et al. 2004), which may harbor suboptimal gutter drainage systems (Ozdenerol et al. 2008), and presence of artificial overflow systems (Vazquez-Prokopec et al. 2010), on WNV infection rates of mosquitoes and human WNV cases. Trends found in these studies do not necessarily apply generally; more WNV cases seemed to occur in sites near urban wetlands in New York City (Rappole et al. 2000) and in the Northern Great Plains (Hockett et al. 2012), whereas urban wetlands in central New Jersey had much lower WNV mosquito infection rates than nearby residential areas (Johnson et al. 2012). Differences in effects of natural areas on WNV epidemiological risk to humans may be related to differences in vector species composition and mosquito ecology.
A small number of studies (Ruiz et al. 2007, Paz 2015, Lockaby et al. 2016) have looked at a combination of demographic factors, land use, and urban form on WNV risk, using both entomological and epidemiological data, in the same region. Moreover, almost no such study has been conducted in Canada, where the WNV threat is growing due to climate change outcomes (Canadian Paediatric Society 2008, Paz 2015). Our practical understanding of infection risk in mosquitoes and spillover risk to humans would benefit from local investigations combining entomological data on WNV infection in mosquito populations and epidemiological data on WNV disease in human populations. In this study, we aimed to test the effect of demographic, land cover, and urban form factors on the proportion of the area of neighborhoods falling within a high WNV risk area, in the city of Ottawa, Canada, where sporadic epidemics of WNV have occurred in the past decade.
Materials and Methods
Data sources
Mosquito surveillance data
We obtained mosquito surveillance data for the city of Ottawa spanning 2007–2014. The municipal WNV surveillance program, conducted by GDG Environnement, involves collection of mosquitoes from 60 sites across the city of Ottawa, Ontario, Canada, from June to September each year. Sites were chosen based on four characteristics: spatial representation across the city of Ottawa, high incidence of WNV in dead birds, high mosquito abundance, and proximity to large human densities. For each site, surveyors collected mosquitoes using a light trap designed by Centers for Disease Control (CDC, Atlanta, GA) baited with dry ice for CO2 emissions. Mosquitoes were immediately stored on dry ice and transported to the laboratory for identification to the species and gender. Females of seven species/species groups considered to be competent WNV vectors were pooled by species and trap day (hereafter referred to as “catches”), with up to 50 individuals per catch (Cx. pipiens/Cx. restuans, Culex salinarius, Aedes vexans, Anopheles punctipennis, Ochlerotatus japonicus, Ochlerotatus trivittatus and Ochlerotatus triseriatus/Ochlerotatus hendersoni) (Public Health Ontario 2012). RNA was extracted from each catch using RNeasy Mini Kit (Qiagen, Hilden, Germany). RNA extracts were tested by quantitative polymerization chain reaction with a TaqMan (Roche Molecular Diagnostics, Basel, Switzerland) generic probe, followed by a TaqMan envelope probe for confirmation of positive results. Following Lanciotti et al. (2000), results with a cycle threshold (Ct) value <30 are considered positive and >37 are considered negative. For results with Ct values between 30 and 37, a re-extraction of RNA was performed followed by tests using both TaqMan generic and envelop probes.
Human WNV surveillance data
We obtained WNV human surveillance data from Ottawa Public Health for the period 2007–2014. Cases of human WNV are reported to Public Health Ontario and recorded in the integrated public health information system (iPHIS; Ontario Ministry of Health and Long-Term Care 2017). We collected data for cases where Ottawa was reported as the primary exposure location in iPHIS. Using ArcGIS 10.5 (ESRI, Redlands, CA), we geocoded the location of residence of each patient and linked each case to their neighborhood using a boundary shapefile. We also extracted data on the date of onset of the disease. We calculated WNV incidence rates for each neighborhood in the study area using population data from the 2011 Census, available from Statistics Canada (2016).
Demographic and land cover data
We selected eight variables that are known epidemiological risk factors for WNV infection, factors that may increase probability of incidence of serious viral symptoms, factors that may affect WNV risk by influencing bird and/or vector populations, or factors that may influence human-vector contact. These included proportion of seniors (aged 65 or older), population density, proportion of aged housing units (built 50 or more years prior), proportion of urban parks, density of catch basins, proportion of urbanized land, forest (all types), and wetlands (all types). We obtained data for such variables, last updated in 2011, for each neighborhood in the city of Ottawa from the Ottawa Neighborhood Study (University of Ottawa, Ottawa, ON, Canada). We obtained locations of all catch basins, last updated in 2016, in the city from Open Data Ottawa (city of Ottawa, ON, Canada). We obtained land cover data, last updated in 2011, spanning the entire city of Ottawa, from Southern Ontario Land Resource Information System (SOLRIS) (Lee et al. 1998). We collated information on number of catch basins and proportion of urbanized land, forest, and wetland area for each neighborhood, using a boundary file from Ottawa Neighborhood Study, and using ArcGIS 10.5.
Ethical approval
We obtained ethical approval for this study from the Ottawa Public Health Research Ethics Board (protocol no. 226-16) and the University of Ottawa Science & Health Sciences Research Ethics Board (file no. H06-16-22). Access to anonymized iPHIS data was granted through a data sharing agreement with Ottawa Public Health.
Statistical analysis
Cluster detection
We identified spatiotemporal clusters with high rates of WNV-infected mosquito catches, and clusters with high rates of human WNV cases, using Kulldorf's spatial scan statistic with SaTScan 9.4 software (Kulldorff 1997). We aggregated data for each week (7 days) of the study. We performed a likelihood ratio test to identify clusters with significantly higher relative risk than expected, defined as the observed versus expected number of cases. For the mosquito infection rate data, we treated individual mosquito catches as data points, assigning a value of 1 for catches testing positive for WNV and 0 for catches testing negative, applying geographic coordinates of the trap site in which each catch was collected. We applied a Bernoulli model, and specified 10% of the population at risk, which is recommended by the author when only specific sites in the study area were sampled, as opposed to the whole area (Kulldorff 1997). We kept other parameters at default values. For human case data, we used the neighborhood of residence, as defined by the Canada 2014 census for the city of Ottawa (Fig. 1), and date of onset of the disease, as spatial and temporal data for this analysis. We applied a Poisson model, using population estimates of Ottawa neighborhoods from the Canada 2014 census. We kept other parameters at default values. We imported cluster data for both analyses to ArcGIS 10.5 for visualization.
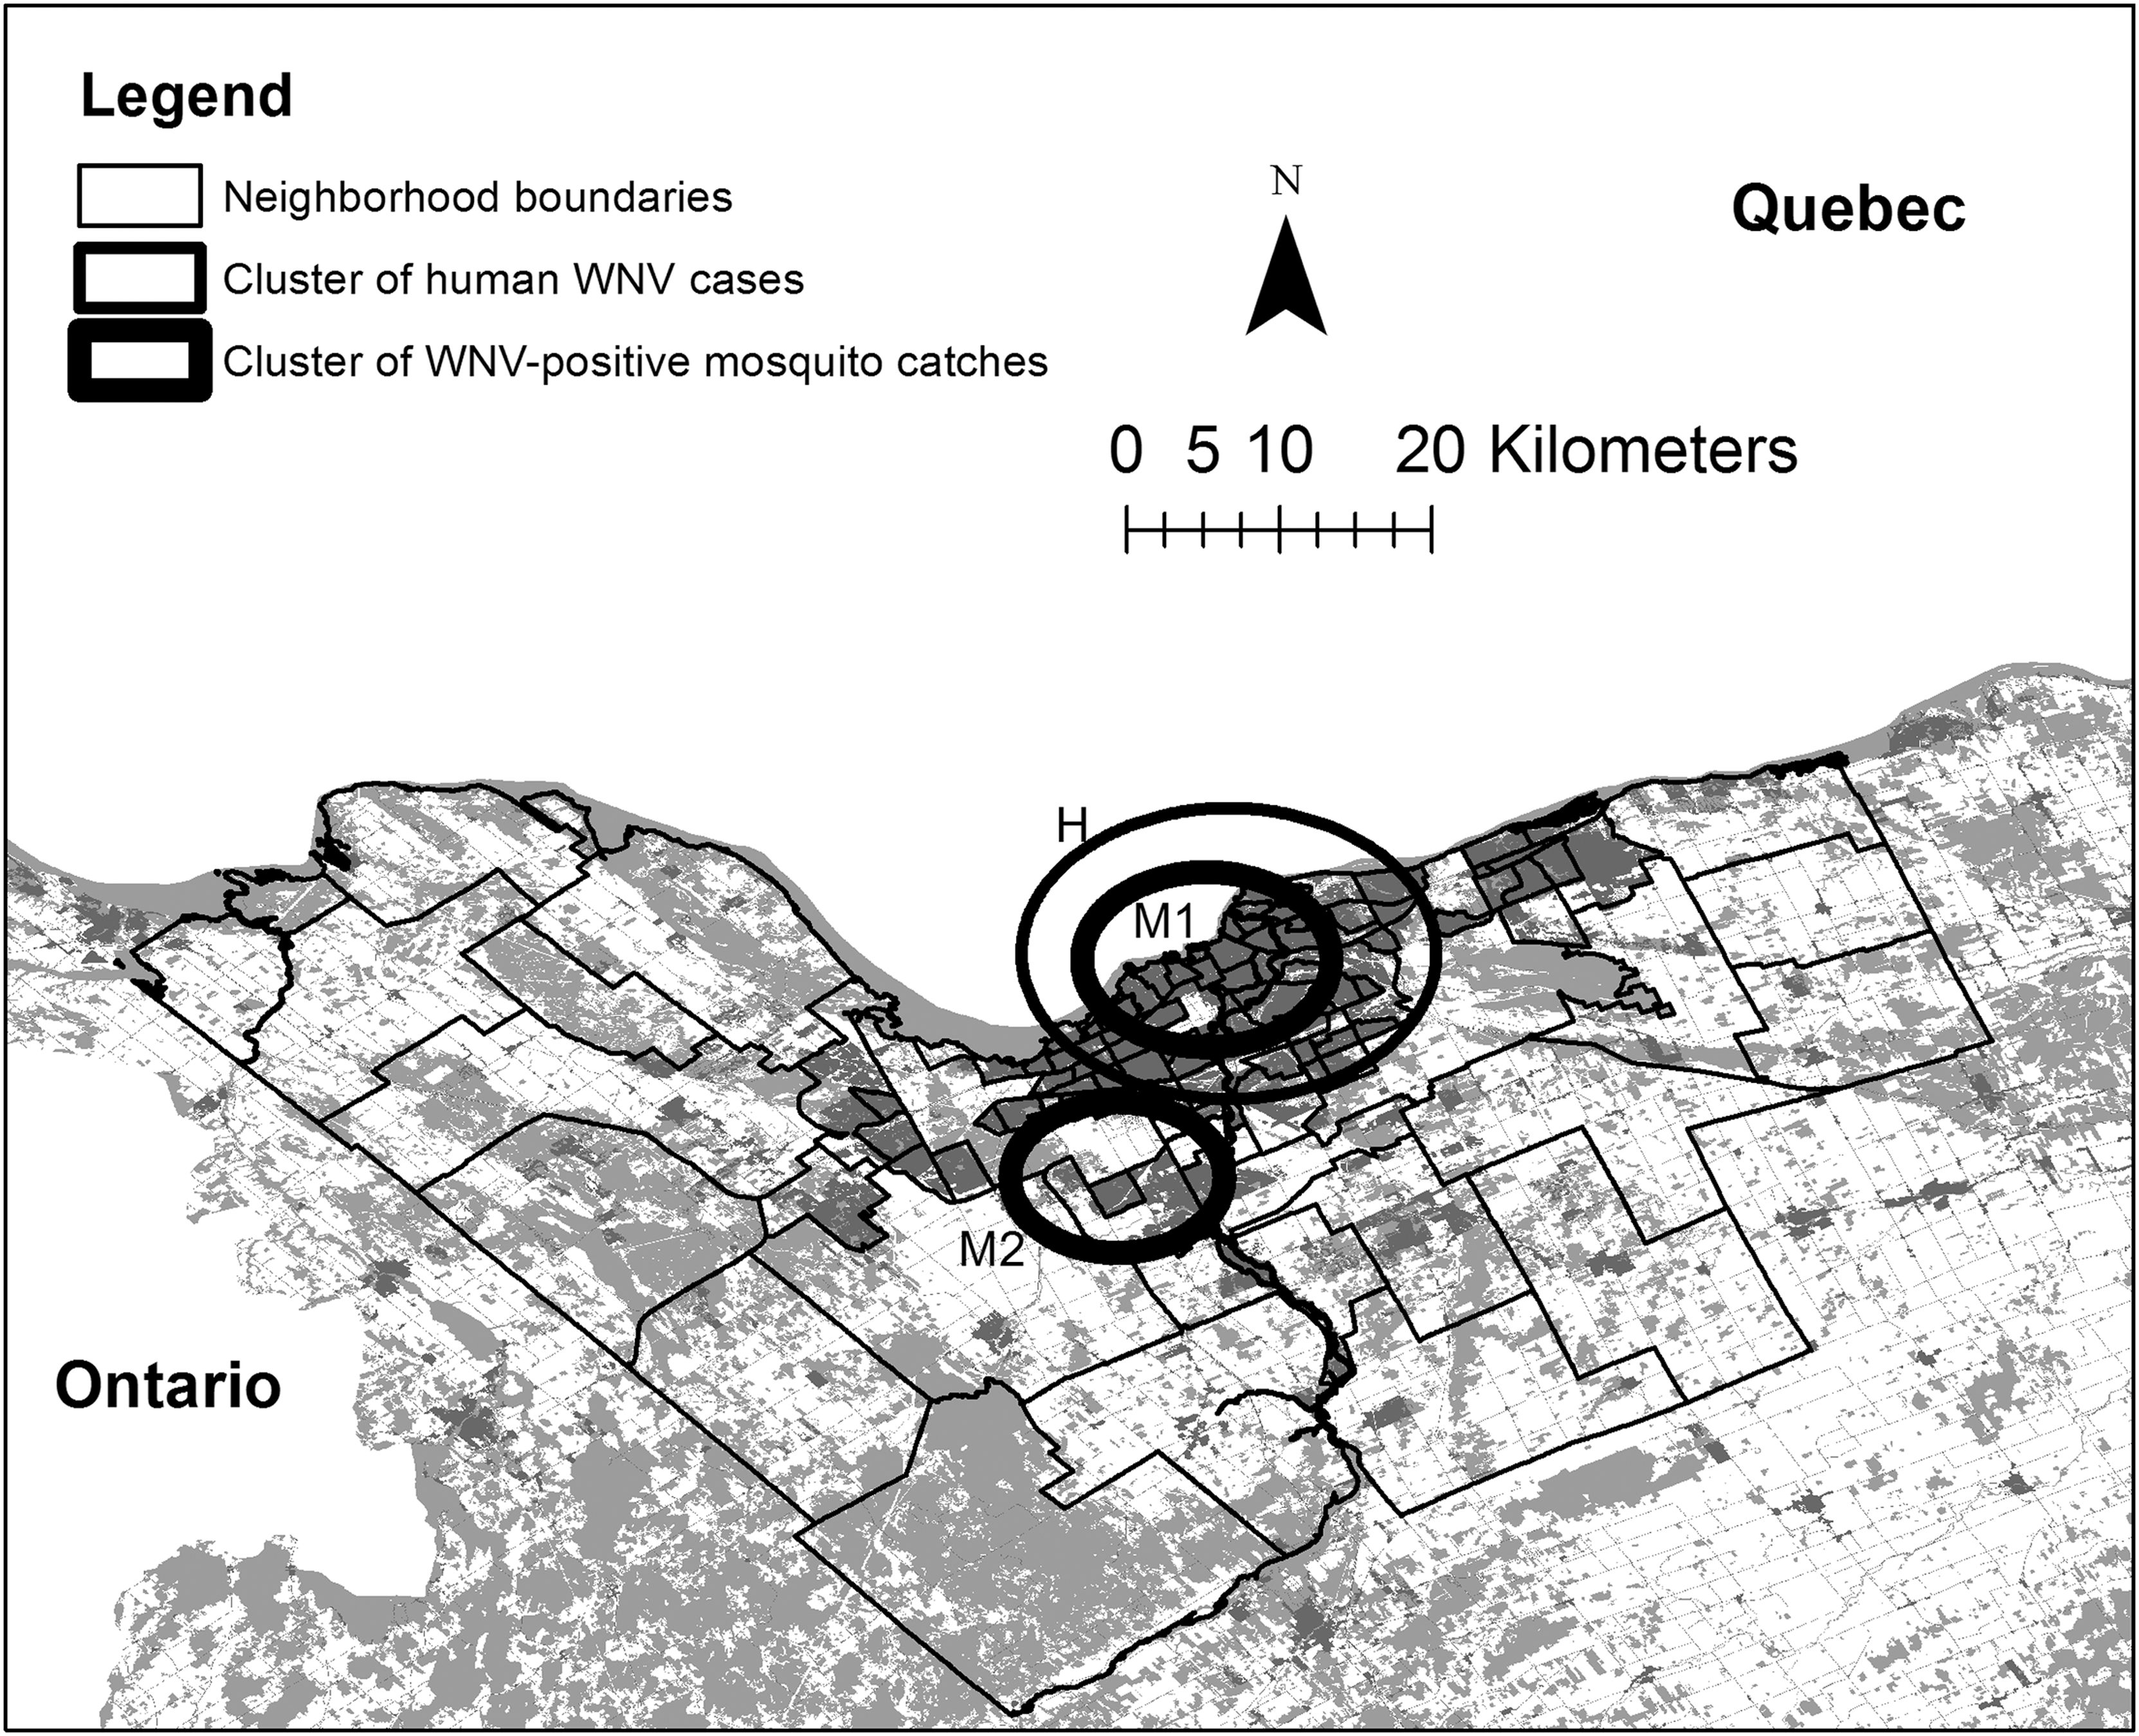
Map of neighborhood boundaries within the city of Ottawa, Canada. Built-up land is shown in dark gray and natural areas (forest and wetlands) in light gray. Circles identify boundaries of entomological and epidemiological space-time clusters of high WNV rates (identifiers refer to “Cluster ID” in Table 1), as in legend, detected using SaTScan 9.4 (Kulldorff 1997). Map was created using ArcGIS 10.5 (ESRI, Redlands, CA). WNV, West Nile virus.
Modeling analysis
To determine factors affecting the proportion of neighborhoods falling within the boundaries of high WNV risk clusters, we used a generalized linear modeling approach. To this end, we used the “glm” function from the “lme4” package in R 3.3.2. We assessed variable importance using model averaging (Symonds and Moussalli 2011). In all models, we treated neighborhoods as individual data points.
As the initial step in model averaging, we ran univariate models, including each of the following variables: population density, proportion of 50-year-old-and-older housing units, proportion of urban parks, proportion of urbanized land, forest and wetlands, and density of catch basins. For analysis of human case data, we also included a model, including only proportion of seniors, because older age groups are more vulnerable to severe symptoms of the disease and thus infections in these groups are more likely to be reported (Drebot et al. 2003). We then ran bivariate models of each possible combination of predictors, models of each possible combination of all but one predictor, and a full model, including all predictors. We averaged all models to obtain corrected Akaike Information Criterion values and importance of each variable, and weights of the most informative models, using the “model.avg” function from the “MuMIn” package (Barton 2013) in R 3.3.2. We calculated R 2 for each model, following the method of Nakagawa and Schielzeth (2013), using the “r.squaredGLMM” function from the “MuMIn” package (Barton 2013) in R 3.5.1, to measure the fit of each model. Before these analyses, we tested for correlation among pairs of predictors, to detect potential collinearity effects on the results.
Results
Mosquito and human WNV surveillance
A total of 61,581 adult female mosquitoes, identified as 1 of 7 potential vector species/species groups, were collected comprising 5257 mosquito catches (average of 12 female mosquitoes per catch). A total of 75 mosquito catches tested WNV positive; 74 of which were Cx. pipiens/Cx. restuans catches, and a single catch comprised Ae. vexans. A total of 12 human WNV cases were recorded in the city of Ottawa, across 11 neighborhoods, between 2007 and 2016, with half (50%) occurring in 2012.
Spatiotemporal cluster detection
We identified a total of two clusters of significantly higher observed than expected cases in the study area based on mosquito infection rate data (Clusters M1 and M2; Table 1 and Fig. 1). Notably, one cluster is centered on the urban core (Cluster M1), whereas the other is situated in an outer suburban area (Cluster M2). We found one cluster in the study area based on human case data, with significantly more observed than expected number of cases (Cluster H; Table 1 and Fig. 1). The cluster of human WNV cases is spatially concentric, but larger than the statistically significant cluster detected using mosquito infection rate data situated in the urban core (Cluster M1; Table 1 and Fig. 1). The two clusters detected using mosquito infection rate data temporally overlap with the cluster detected using human case data, but start 53 (Cluster M1) and 3 weeks (Cluster M2) earlier, respectively, and end within 3 weeks after (Table 1). Although no mosquito data was collected during October to May, it seems that results from Cluster M1 indicate a pattern of higher-than-expected rates of mosquito infection that continued into the next year.
Characteristics (Start and End Date, Observed and Expected Number of Cases, Relative risk, Likelihood Ratio, and p Value) of Detected Space-Time Clusters (Two for Mosquito Data and One for Human Data) of Significantly High West Nile Virus Rates in the City of Ottawa, Canada, From 2007 To 2014
Cluster ID refers to those in Figure 1.
Modeling analysis
We merged proportion of wetlands and forest into one variable representing natural areas, because these two variables were highly correlated (r > 0.5). We also removed proportion of urbanized land because of its high correlation with population density (r > 0.5). After merging and exclusion, all pairs of remaining predictor variables displayed r ≤ 0.4, suggesting little to no effect of collinearity in our models.
When examining factors affecting proportion of area of neighborhoods within clusters of high mosquito infection rates, most likely models were different for Cluster M1 and Cluster M2. Only one model had a ΔAICc <1.5 in explaining proportion of neighborhoods within Cluster M1 (R 2 = 0.64; Table 2). It includes two variables: population density and proportion of 50-year-old-and-older housing units, both of which also display relative variable importance = 1.0, and a positive estimate (Table 3). These results suggest a large positive effect of population density and proportion of aged housing units on entomological WNV risk in a neighborhood.
Model Selection Parameters, Model-Averaged Akaike Weight and R 2 (Nakagawa and Schielzeth 2013) of Top Generalized Linear Models (ΔAICc ≤1.5) Explaining Proportion of Neighborhoods in a High West Nile Virus Risk Cluster
1 = Population density (person/km2), 2 = proportion of 50-year-old-and-older housing units (%), 3 = proportion of urban parks (%), 4 = proportion of natural areas (%), 5 = catch basin density (unit/km2), 6 = proportion of seniors (%; only for analysis of proportion of neighborhoods in cluster H). Cluster ID refers to those in Figure 1 and Table 1.
Model-Averaged Coefficients of Five (Six for Analysis of Proportion of Neighborhoods in Cluster H) Predictor Variables Explaining Proportion of Neighborhoods in a High West Nile Virus Risk Cluster, from a Total of 21 Models (28 for Analysis of Neighborhoods in Cluster H)
In contrast, four models had a ΔAICc <1.5 in explaining proportion of area of neighborhoods within Cluster M2 (Table 2), and Akaike weight <0.2 and R 2 < 0.05 for all of them. Variable importance was <0.5 for all variables (Table 3). Altogether, these results suggest that different factors may contribute to WNV infection rates in mosquitoes in the urban and suburban zones.
Two models had a ΔAICc <1.5 in explaining proportion of neighborhoods within Cluster H (R 2 = 0.53 for both; Table 2). These models both include population density, proportion of 50-year-old-and-older housing units, proportion of natural areas, and proportion of seniors. All these variables show relative variable importance between 0.95 and 1.0 (Table 3), suggesting a large effect on human WNV risk in a neighborhood. Population density, proportion of 50-year-old-and-older housing units, and proportion of seniors all displayed a positive effect on WNV risk, but proportion of natural areas displayed a negative effect on WNV risk. These results suggest a large positive effect of population density and proportion of aged housing units on human WNV risk in a neighborhood, and higher risk in neighborhoods with higher proportion of seniors. These results also suggest a reducing effect of natural areas (i.e., forests and wetlands) on human WNV risk in our study area.
Discussion
In the city of Ottawa, where sporadic outbreaks of WNV have occurred in recent years, we detected two spatiotemporal clusters of high WNV risk using entomological data and one using epidemiological data. Of note, one of the entomological clusters spatially overlaps with the cluster of human WNV cases in a densely populated area in downtown Ottawa. The second entomological cluster is situated in a suburban area southwest of downtown. This is interesting, as it potentially points to different factors that contribute to enzootic WNV transmission versus spillover to humans.
We detected a large effect size of two variables, namely population density and proportion of aged housing units, on the proportion of neighborhoods within the overlapping clusters of high WNV risk in downtown Ottawa. Similarly, studies in urban and suburban localities in northeastern United States have found these two variables to be linked to abundance of Culex mosquito populations (Trawinski and Mackay 2010), known as main WNV vectors in North America, as well as the number of human WNV cases (Ruiz et al. 2004, 2007). These two variables possibly increase the availability of suitable habitats, that is, nesting locations and breeding sites, used by both WNV reservoir and vector species, which thrive in disturbed, or peridomestic, areas (Reisen 2013). Urban cores are usually more densely populated and were built before surrounding suburbs, which could explain why WNV case clustering was observed in the downtown core of Chicago (Ruiz et al. 2004) and also Ottawa, according to results from this study.
Our results also show that natural areas may affect WNV risk in humans, but not urban parks. The influence of urban parks on WNV transmission and risk to humans is unclear. Although other studies have observed an amplification effect of urban green spaces (Brownstein et al. 2002) and zoological parks (Levine et al. 2013) on WNV transmission, in our study the proportion of urban parks was not associated with epidemiological WNV risk. Our results also suggest a potential role of natural areas in reducing WNV spillover risk to humans. Other studies found negative associations between old-growth forest patches and urban wetlands on WNV vector and reservoir infection rates (Johnson et al. 2012, Levine et al. 2013). Under certain conditions, natural areas could hinder WNV amplification in urban settings. Notably, their role on WNV amplification could depend on their suitability for nesting of avian WNV reservoir and breeding of mosquito WNV vector species, both of which are known to prefer peridomestic areas, relative to other avian and mosquito species (Rappole et al. 2000, Johnson et al. 2012, Levine et al. 2013). The role of natural areas on WNV risk also depends on their suitability for WNV replication, which itself depends on microclimatic ambient temperatures (Haider et al. 2017). Clearly, more research needs to be performed in this area. Notably, characterizing natural areas at the fine scale according to landscape variables such as cover of forest, wetlands, and open area could help us understand their effects on density of WNV reservoir and vector species, and overall avian and mosquito species richness.
Our study suffers from a limited epidemiological data set due to the low number of WNV cases reported during the study period. However, it provides a useful approach that could be replicated in future studies when higher case numbers become available. Furthermore, our analyses suffer from a lack of precision of the available data on place of WNV exposure. This forced us to use neighborhood of residence of patients in our analyses, which is an acceptable proxy of neighborhood of exposure. A larger human case data set, with high reliability of place of exposure, would provide higher resolution in detection of epidemiological hotspots around the city of Ottawa. Finally, our analyses suffer from a possible selection bias of mosquito surveillance sites, which was partly based on indices of WNV risk. However, sites were also chosen to maximize spatial representation across the city of Ottawa. Therefore, we believe the study sites we used for our study can reliably inform on spatial WNV risk in the city of Ottawa.
Conclusions
Our study is one of the first to investigate the joint role of demographic, land use, and urban form factors on WNV risk using entomological and epidemiological data. More integrated approaches using data from a variety of sources should be performed to understand the complexity of WNV spillover risk to humans.
Footnotes
Acknowledgments
We thank Canadian Institutes of Health Research for funding of the project. We thank employees of GDG Environnement, volunteers of Ontario Bird Count, employees of Ottawa Public Health, and employees of Environment and Natural Resources Canada. We thank all members from the INSIGHT laboratory for their suggestions and comments on the analyses and the initial draft of the article.
Author Disclosure Statement
No competing financial interests exist.