
Abstract
Longitudinal studies are fundamental in the assessment of the effect of environmental factors on tick population dynamics. In this study, we use data from a 10-year study in 11 different locations in the Netherlands to gauge the effects of climatic and habitat factors on the temporal and spatial variation in questing tick activity. Marked differences in the total number of ticks were found between locations and between years. We investigated which climatic and habitat factors might explain this variation. No effects of climatic factors on the total number of ticks per year were observed, but we found a clear effect of temperature on the onset of tick activity. In addition, we found positive associations between (1) humus layer thickness and densities of all three stages, (2) moss and blackberry abundance and larval densities, and (3) blueberry abundance and densities of larva and nymphs. We conclude that climatic variables do not have a straightforward association with tick density in the Netherlands, but that winter and spring temperatures influence the onset of tick activity. Habitats with apparently similar vegetation types can still differ in tick population densities, indicating that local composition of vegetation and especially of wildlife is likely to contribute considerably to the spatial variation in tick densities.
Introduction
The sheep tick Ixodes ricinus, vector of several important tick-borne diseases, including Lyme borreliosis (LB) and tick-borne encephalitis (TBE), has a widespread distribution in Europe. LB is the most prevalent vector-borne disease in the northern hemisphere (Medlock et al. 2013) as well as the most common tick-borne disease in the world (Hubálek 2009). In the last few decades, the prevalence of reported cases of LB has increased in several European countries (Hofhuis et al. 2006, 2015, Gassner and Overbeek 2007, Hubálek 2009, Stone et al. 2017). The geographic distribution of TBE is also expanding and recently, some human cases (de Graaf et al. 2016) as well as virus presence in ticks and roe deer have been reported in previously TBE-free countries, such as the Netherlands (de Graaf et al. 2016, Jahfari et al. 2017). The increased incidence of these diseases may be caused by various factors: (1) changes in the distribution of I. ricinus in Europe; I. ricinus occurs at higher altitudes and latitudes than before; (2) increase in tick abundance in endemic areas; (3) increase in percentage of ticks infected with the pathogens; and (4) change in the behavior of people, which has resulted in higher exposure to ticks. The changes in tick distribution and abundance have been linked to changes in climate, host distribution, landscape composition, or land use (Medlock et al. 2013).
Given the public health impact of tick-borne diseases, a proper understanding of the phenology and population dynamics of I. ricinus is very important. The risk of acquiring an infected tick bite depends on the number of questing infected ticks (for humans, mostly the nymphs). Knowledge on the timing of questing behavior in ticks is useful for risk communication. The timing of questing and the overlap between questing activity of the different life stages may also determine the extent to which cofeeding takes place. This, in turn, may influence the (local) transmission cycles of tick-borne pathogens such as TBE (Randolph et al. 1996). For LB, the density and timing of questing ticks are likely to influence the number of ticks on rodents, the principle host of immature I. ricinus, which in turn determines the transmission opportunities of Borrelia and hence the infection rates of ticks (van Duijvendijk et al. 2015).
The density and timing of questing ticks can vary substantially in time and space. Temporal variation comprises within-year (seasonal) as well as between-year variation and possibly even long-term trends. Spatial variation in questing tick density, that is, variation between locations, is likely to be related to site-specific factors, such as soil, vegetation, and host composition. Understanding how tick density varies spatially and which factors drive this variation will help us to assess the risk of acquiring an (infected) tick bite in specific areas. Drivers for temporal and spatial variation are likely to be a combination of abiotic and biotic factors. Climatic factors, such as temperature and humidity, are known to influence tick survival and activity (Randolph 2004, Ehrmann et al. 2017). For instance, in Switzerland, mild winters and warm springs have been shown to allow for earlier questing in an area at 500 meter above sea level (Perret et al. 2000). Vegetation characteristics will influence the size and composition of local host populations, as well as the opportunities for ticks to quest (grass and low vegetation) and find shelter for adverse conditions, such as desiccation or cold. Soil characteristics may also influence moisture level, and opportunities for ticks to find shelter during the molting process or during the questing period. It is clear that some areas provide more suitable habitats for ticks and their hosts than others, and ticks are generally considered to be associated with (deciduous) forests, but dunes, and periurban and even urban areas can be infested with ticks as well (Wielinga et al. 2006, Rizzoli et al. 2014, Paul et al. 2016, Hansford et al. 2017).
Understanding how climatic factors and habitat factors (such as vegetation and soil type) and their interactions affect the timing and density of questing ticks would help us to predict the risk of tick-borne diseases. From previous studies, it is clear that there is temporal and spatial variation in the population dynamics of I. ricinus in the Netherlands (Gassner et al. 2011, Takken et al. 2017). However, assessing the long-term variation more accurately and linking it to possible driving factors require a long time series of observations. Until now, such data were lacking for this region.
To this end, a long-term study was performed between 2006 and 2016 with the help of a group of trained volunteers in the context of the Dutch phenological network De Natuurkalender (Nature's Calendar). The aim of the study was to investigate the population dynamics and phenology of I. ricinus in the Netherlands. This study yielded a dataset consisting of monthly collections of ticks of all stages from 11 sites across a wide geographic range and various habitats for a period of 10 years. This dataset is one of the few studies that monitor tick activity throughout the year. Data from the period 2006–2011 have been used in an analysis of Borrelia infections (Takken et al. 2017), and data from 2006 till 2014 were used to model tick dynamics (Garcia-Martí et al. 2017).
In this study, the complete dataset is used for a detailed analysis of the spatial and temporal variation in questing tick density and the climatic and habitat factors driving this variation. We show how tick abundance and timing vary between locations and between years. We investigate whether climatic factors, such as temperature and saturation deficit, affect the tick density or the onset of questing activity. This will help to determine how, for instance, mild winters or warm springs might affect the tick population and the timing of questing. We also assess whether variation between locations in number of ticks can be attributed to differences in vegetation or soil characteristics.
Materials and Methods
Tick data collection
Monthly collections by blanket dragging of all 3 postegg stages for I. ricinus were performed by well-trained volunteers for 10 years (June 2006–July 2016) at 11 locations in the Netherlands (Fig 1). Sampling was done in the first weekend of each month, if possible. The volunteers dragged a white cotton cloth (1 m2) over two marked transects, each measuring 100 meter long; thus, the total sampled area per location is 200 m2 per session. The cloth was inspected for ticks at intervals of 25 meter. All larvae, nymphs, and adult ticks that had attached were counted and removed at each interval.
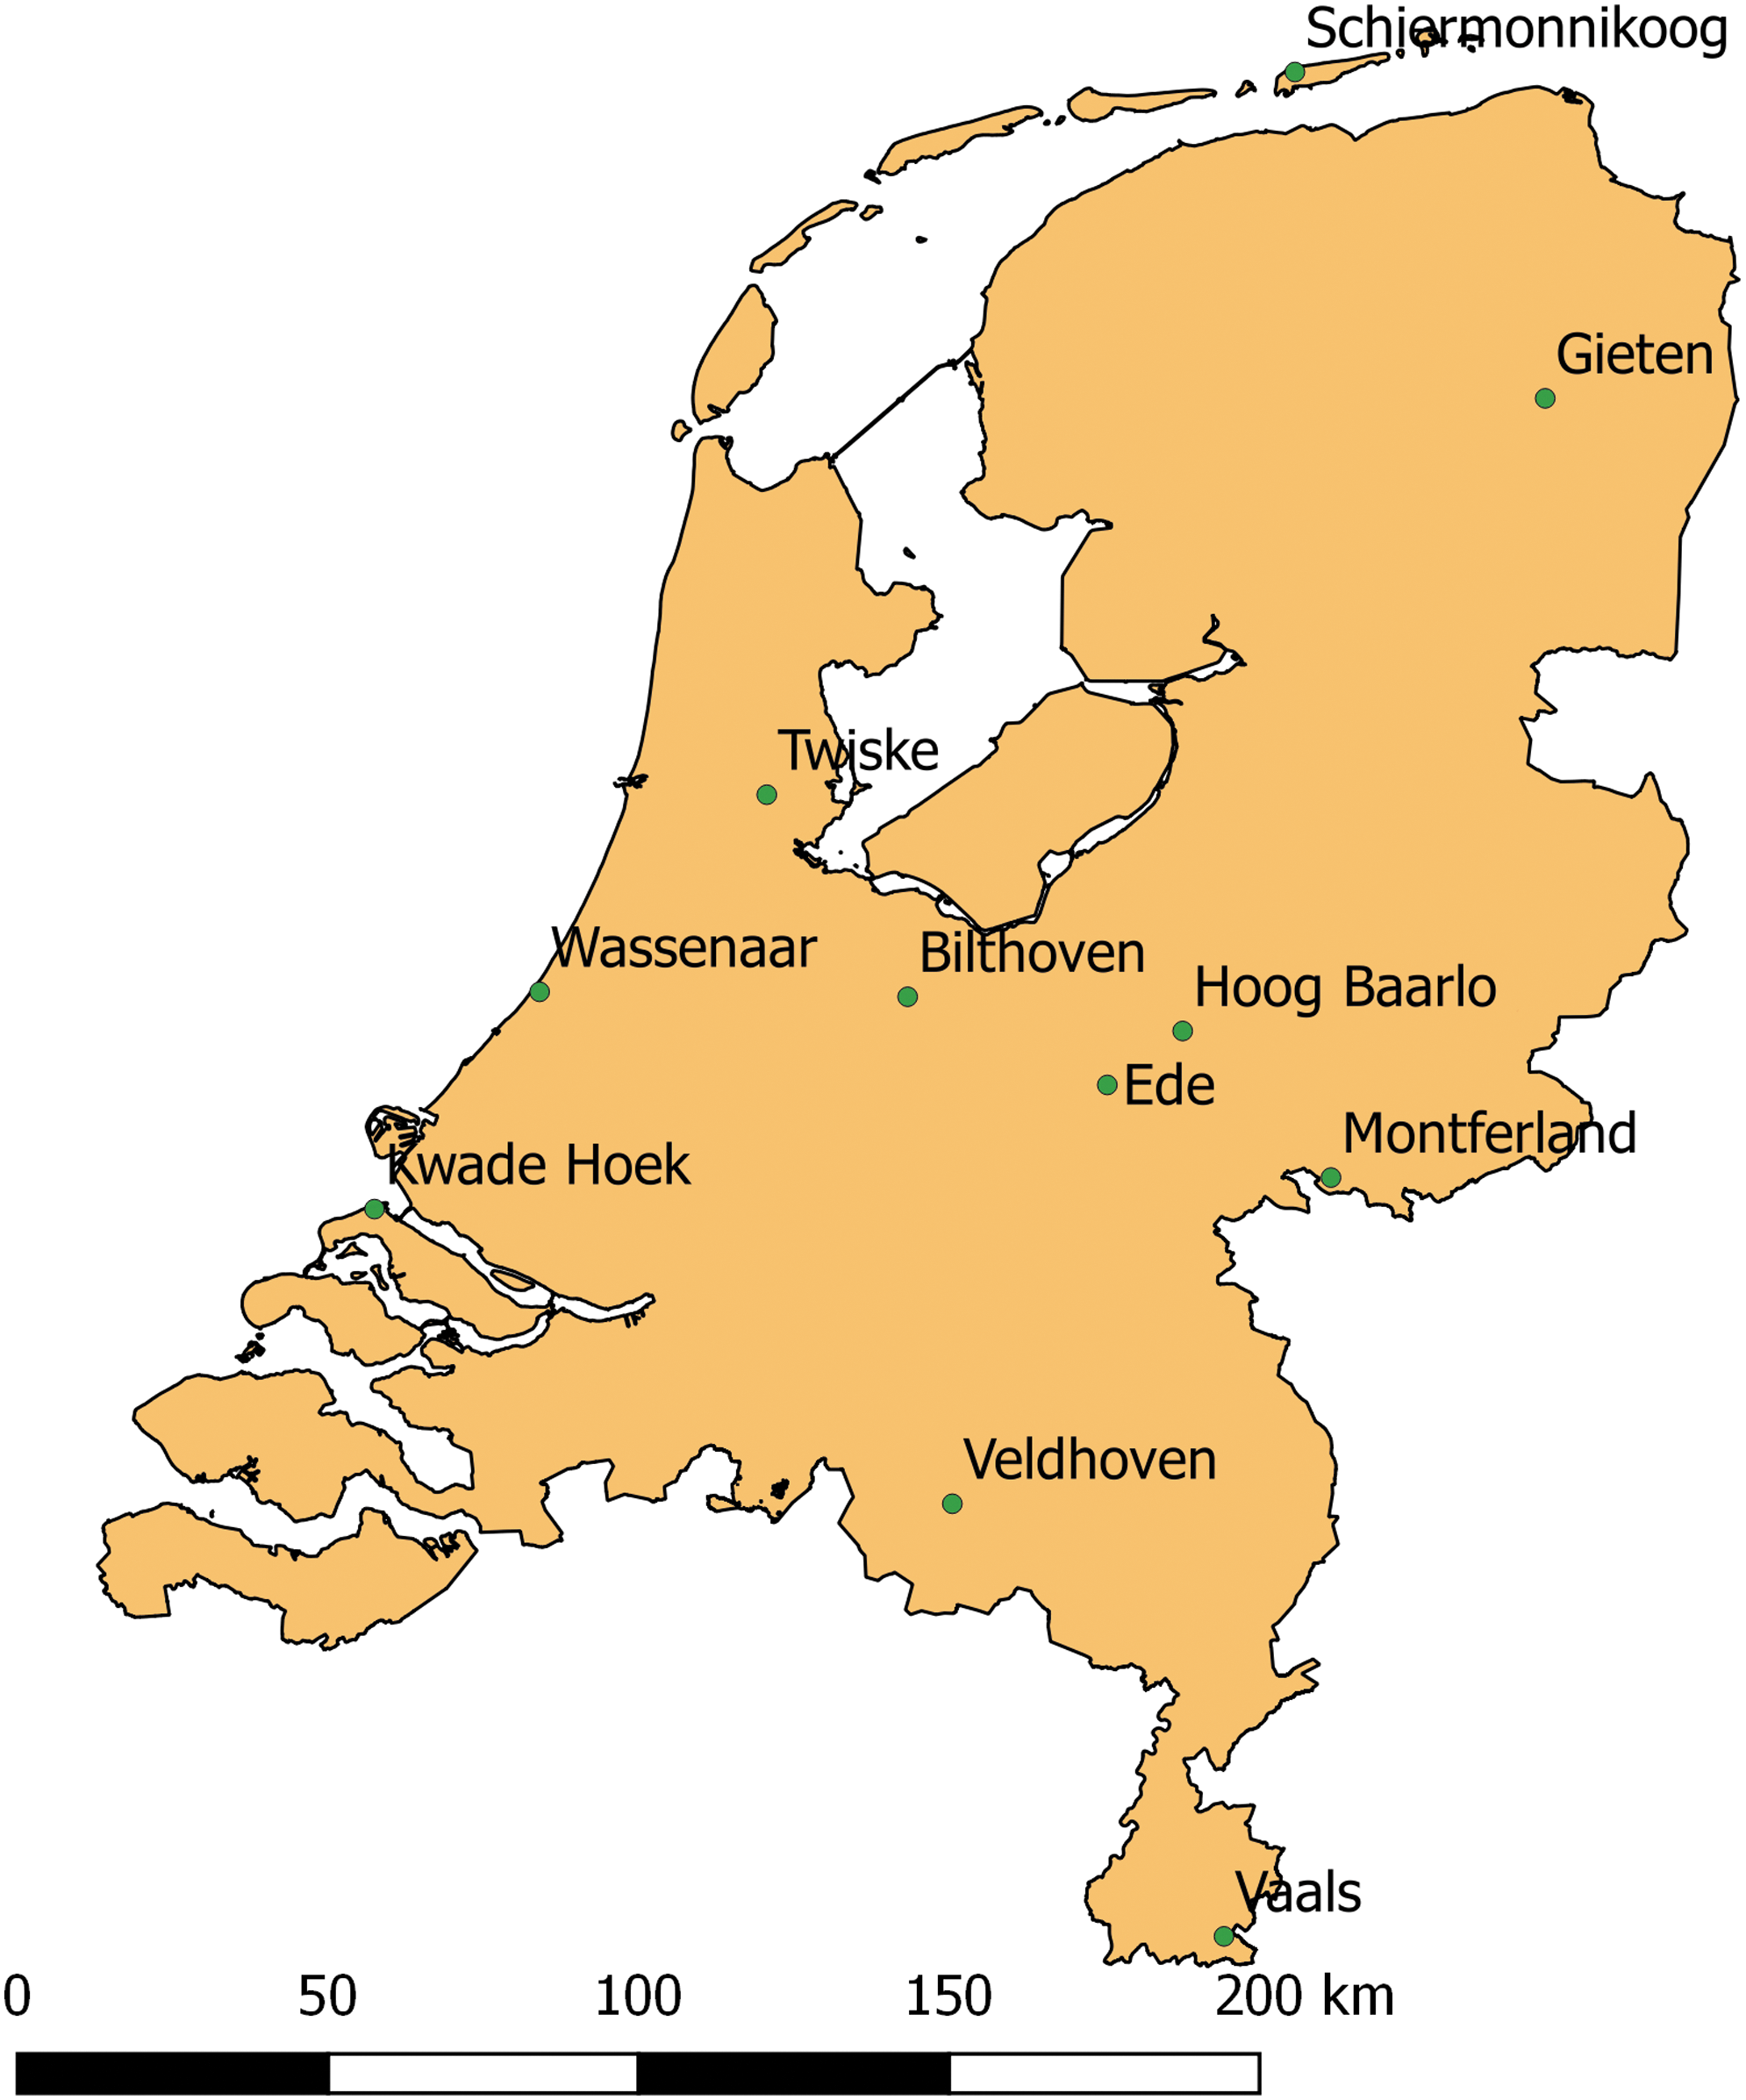
Map of the Netherlands with the sampling locations.
Locations were selected based on the availability of volunteers and (suspected) suitability of the habitat for I. ricinus. Selection of transects within the location was not standardized; in some locations, the two transects were very similar in composition and structure of vegetation, whereas in other locations, they were not. Therefore, vegetation and soil characteristics were measured at transect level. Wildlife presence was assessed based on information from terrain managers and observations by the volunteers and researchers, and is assumed to be the same for both transects. Roe deer is present in all locations, except for Schiermonnikoog and Twiske. Red deer is only present in Hoog Baarlo. Wood mice and bank voles occur in all locations, except for Kwade Hoek, where voles are absent. More details on the locations, their coordinates, and specific characteristics are provided in Supplementary Table S1. The total number of opportunities for sampling was 1320 (12 monthly measurements per year, 10 years and 11 locations.
In total, 44 of the 1320 planned collections were not performed. In January 2010 and February 2012, there was snow and frost in the designated weekend for sampling and 12 collections were skipped. We assume that no ticks would have been collected by blanket dragging on those days, and therefore, we set the number of collected ticks for those occasions to zero. In 32 other occasions, no collection was done due to other reasons and these are considered missing values.
Weather data
Weather data were obtained from the data center of the Royal Netherlands Meteorological Institute (KNMI).* Daily values for minimum and maximum temperature and relative humidity, based on interpolated data from 34 automatic weather stations, were extracted for each of the 11 locations. The mean temperature was calculated from the minimum and maximum temperature. From the mean temperature and relative humidity, we calculated the saturation deficit according to Randolph and Storey (1999):
Monthly mean values of each weather variable were calculated for each sampling location. Climatic variables at different temporal scales (for the month of sampling, as well as for other months and periods in that year or the year before) were matched to the sampling session based on location and date. Temperature and saturation deficit values for each season are presented in Table 1.
Average Mean Temperatures (in Degrees Celsius) and Saturation Deficits for Each Season of the Study Period (Winter: December–February, Spring: March–May, Summer: June–August, and Autumn: September–December)
Average is taken over the months and over the 11 locations.
Derived from De Bilt values.
Habitat data
Vegetation surveys were performed in 2014 by an expert (Frans Jacobs). The abundance and coverage of all trees, shrubs, and herbs were scored using the Braun-Blanquet method, adjusted by van der Maarel (1979) and Braun-Blanquet (1964). This gives a measure for abundance (on a scale of 1–9), which was used as explanatory variable. Species included in the analysis were as follows: Vaccinium myrtillus (European blueberry), moss (not determined at species level), Molinia caerulea, Deschampsia flexuosa, Rubus fruticosus, Betula pendula, Quercus robur, Quercus petraea, Quercus rubra, Pinus sylvestris, Pinus nigra (combined in one variable Pinus), and Fagus sylvatica. Thickness of the litter layer (leaves, twigs, and dead grass) and humus layer (organic material, consisting of hardly or not recognizable plant parts) was measured for every 25 meter of each transect, and the average value (in cm) per transect was used in the analysis.
Mast data
Mast data were obtained from various sources, and were transformed to a common 5-point scale: (0) no mast, (1) very low mast production, (2) low mast production, (3) normal mast production, (4) abundant mast production, and (5) very abundant mast production (Swart et al. 2017). Mast scores always refer to the mast in the previous year (since the effect of higher mast by increase in survival of rodents is thought to occur in the year after the mast).
Statistical analysis
In this analysis, we focus on the variation between years and between locations. We consider two outcomes: (1) the total number of ticks collected in a year per location and per year (since these are proxies for the tick densities in that year and location, we will use both terms, density and numbers, interchangeably) and (2) the onset of tick activity. All analyses were performed in R version 3.2.5 (R Core Team 2016). In our design, the repeated samplings for locations and years required the inclusion of year and location as (crossed) random effects. Also, count data, such as tick numbers, are non-normally distributed. Therefore, we used generalized linear mixed models (GLMMs), because these models can handle non-normally distributed data as well as (multiple) random effects. More specifically, we used the glmmADMB package (Bolker et al. 2009), which handles negative binomial distributions as well as crossed and nested random effects. Based on the Akaike Information Criterion values, the best-fitting distribution for the response variables was determined. For the total number of ticks per year per location, the best-fitting distribution was the negative binomial distribution, with a log link function. For the onset of tick activity, a normal distribution fitted best. All analyses were performed separately for each life stage.
Temporal and spatial variation in the total number of ticks per year
The data are presented in Supplementary Table S2. For the analyses on numbers per year, we excluded the years 2006 and 2016, in which ticks had only been collected for 6 months. We analyzed the trend in time by including the (absolute) year as a fixed explanatory variable in a GLMM with location and year as crossed random effects. We plotted the interannual and intra-annual variation in numbers of ticks (Figs. 2 and 3). Temporal (between year) variation was investigated by performing pairwise comparisons between years (with Tukey p value adjustment) based on the outcomes of the GLMM with year (as factor) as fixed effect and location and year as random effect, using the Emmeans package. Spatial (between location) variation was investigated by similar pairwise comparisons based on the outcomes of the GLMM with location as fixed effect and location and year as random effect. In the plot of the total numbers of ticks per location (Fig. 4), the letters indicate the significant differences between locations in the pairwise comparison of the number of ticks per year.
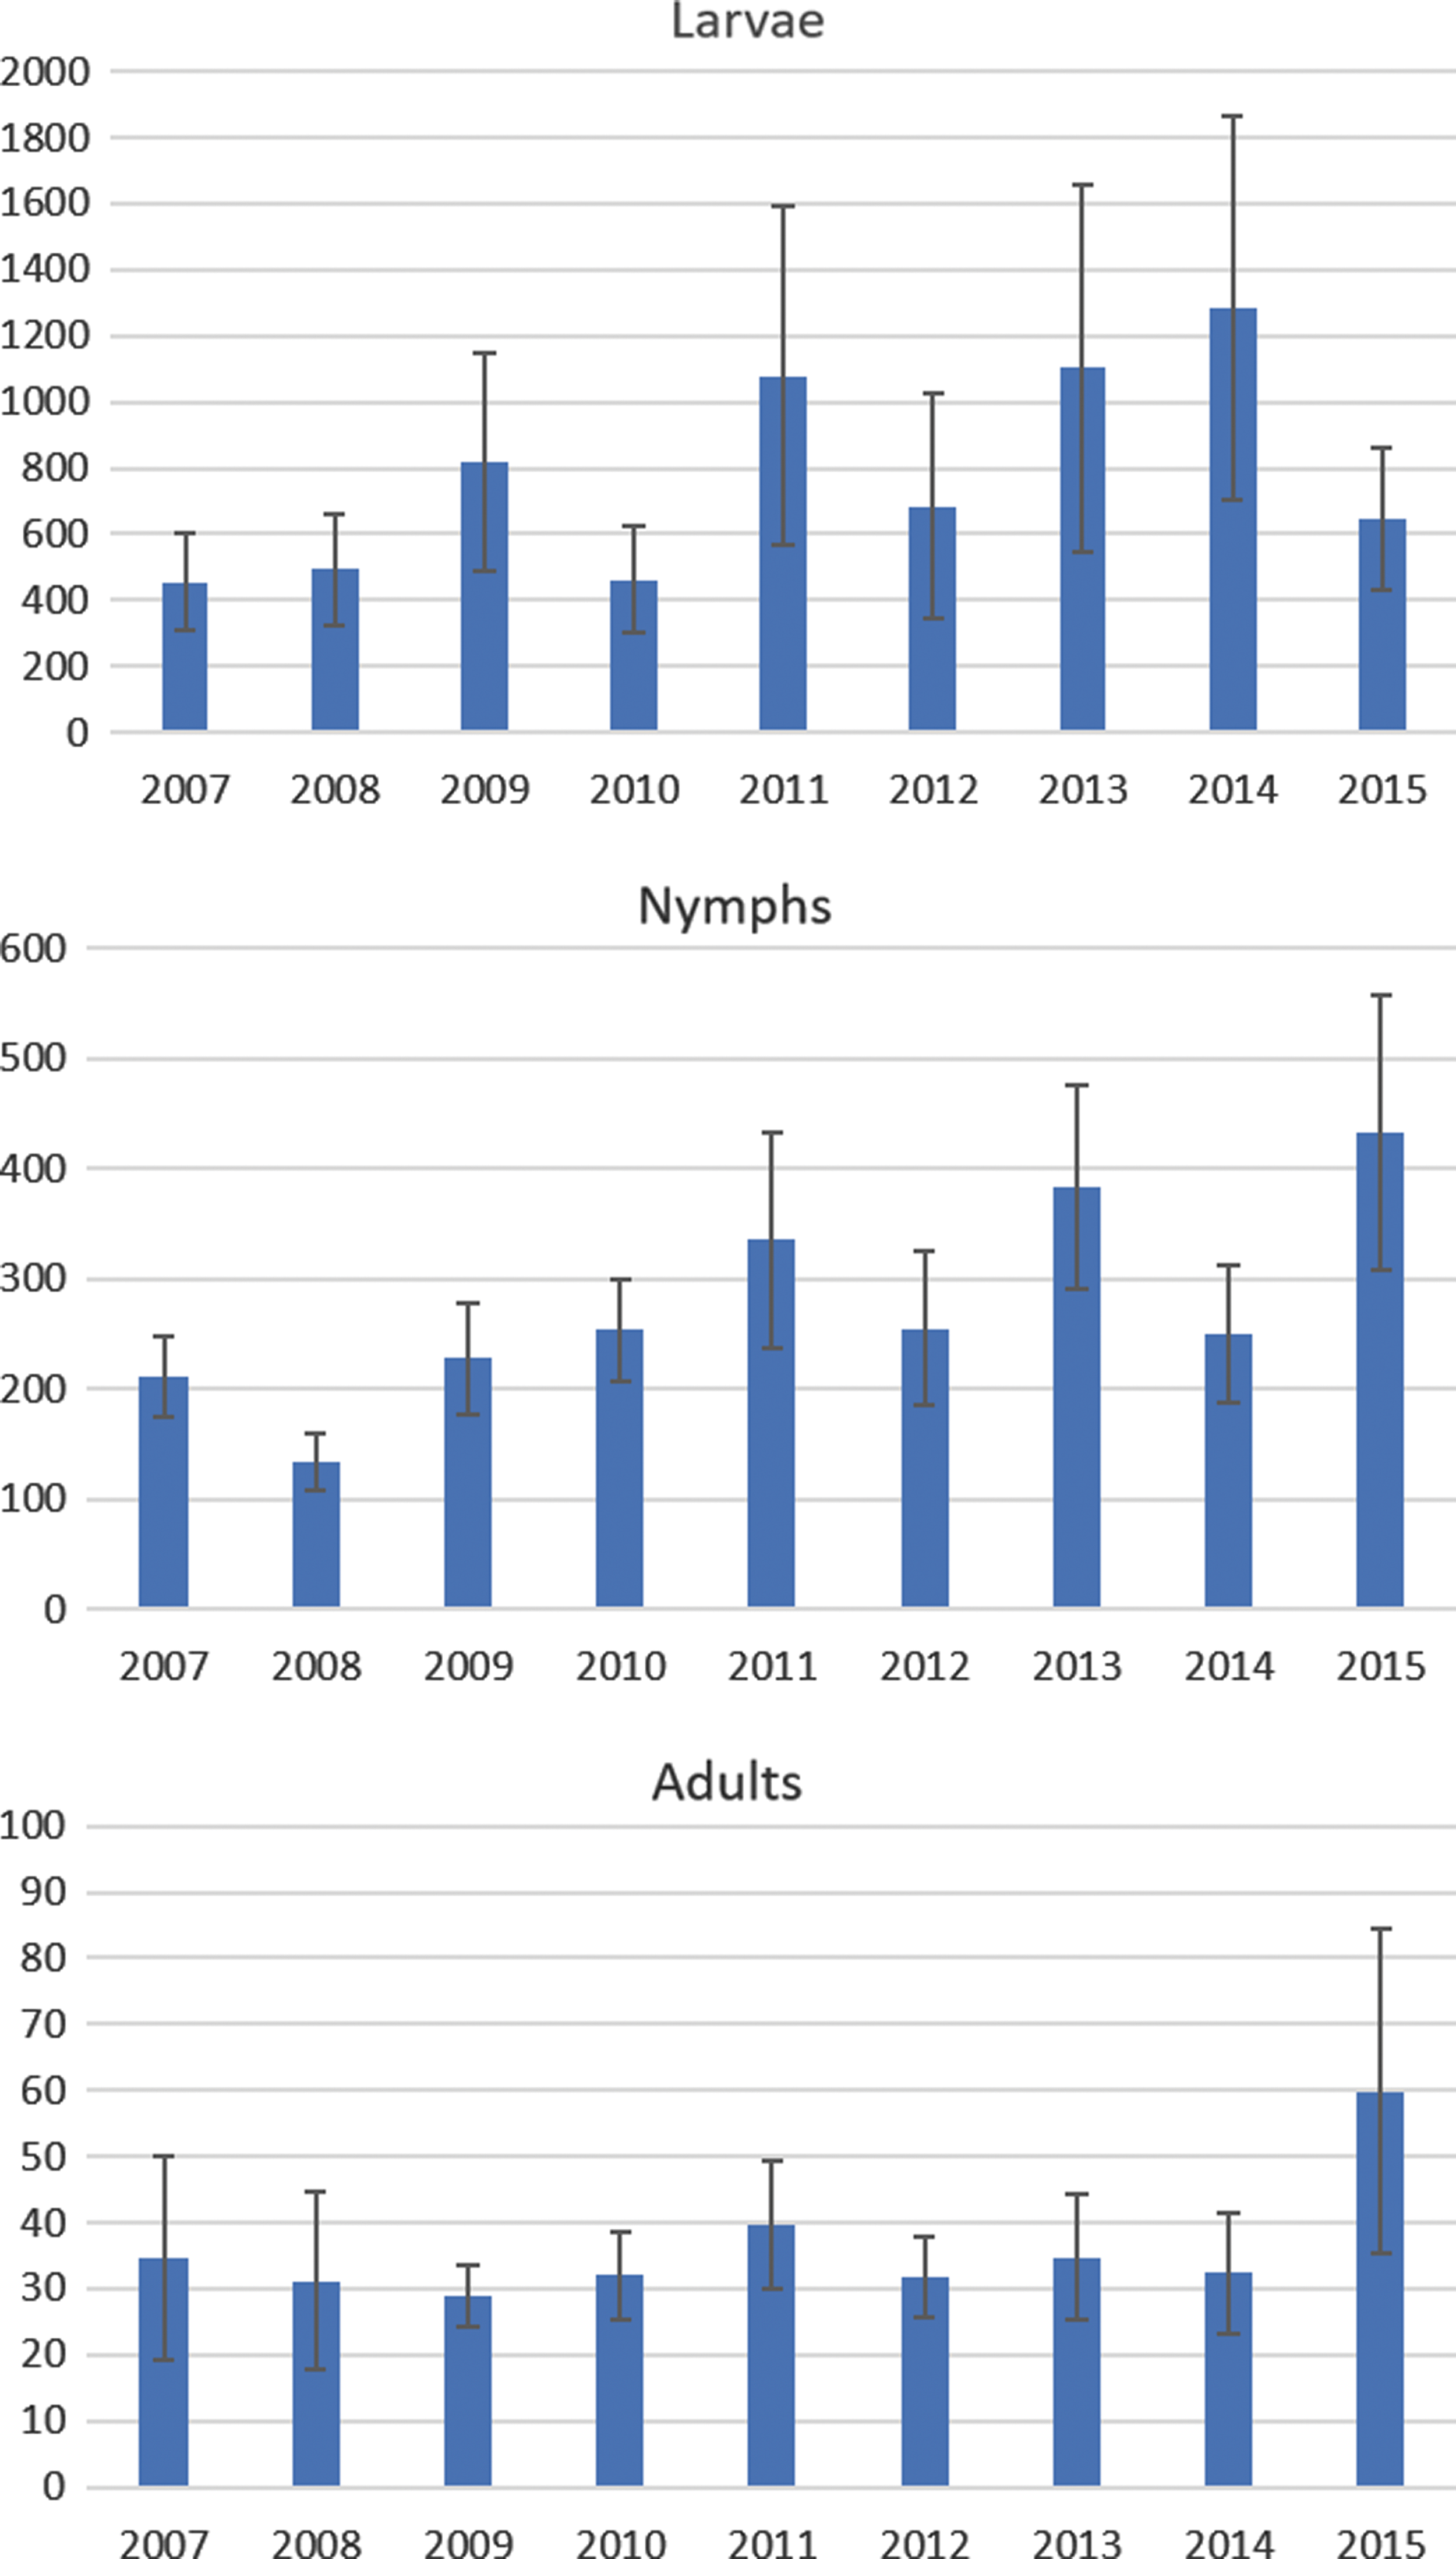
The mean (bars) and standard error (error bars) of the number of ticks collected per location for each year.
The total numbers of
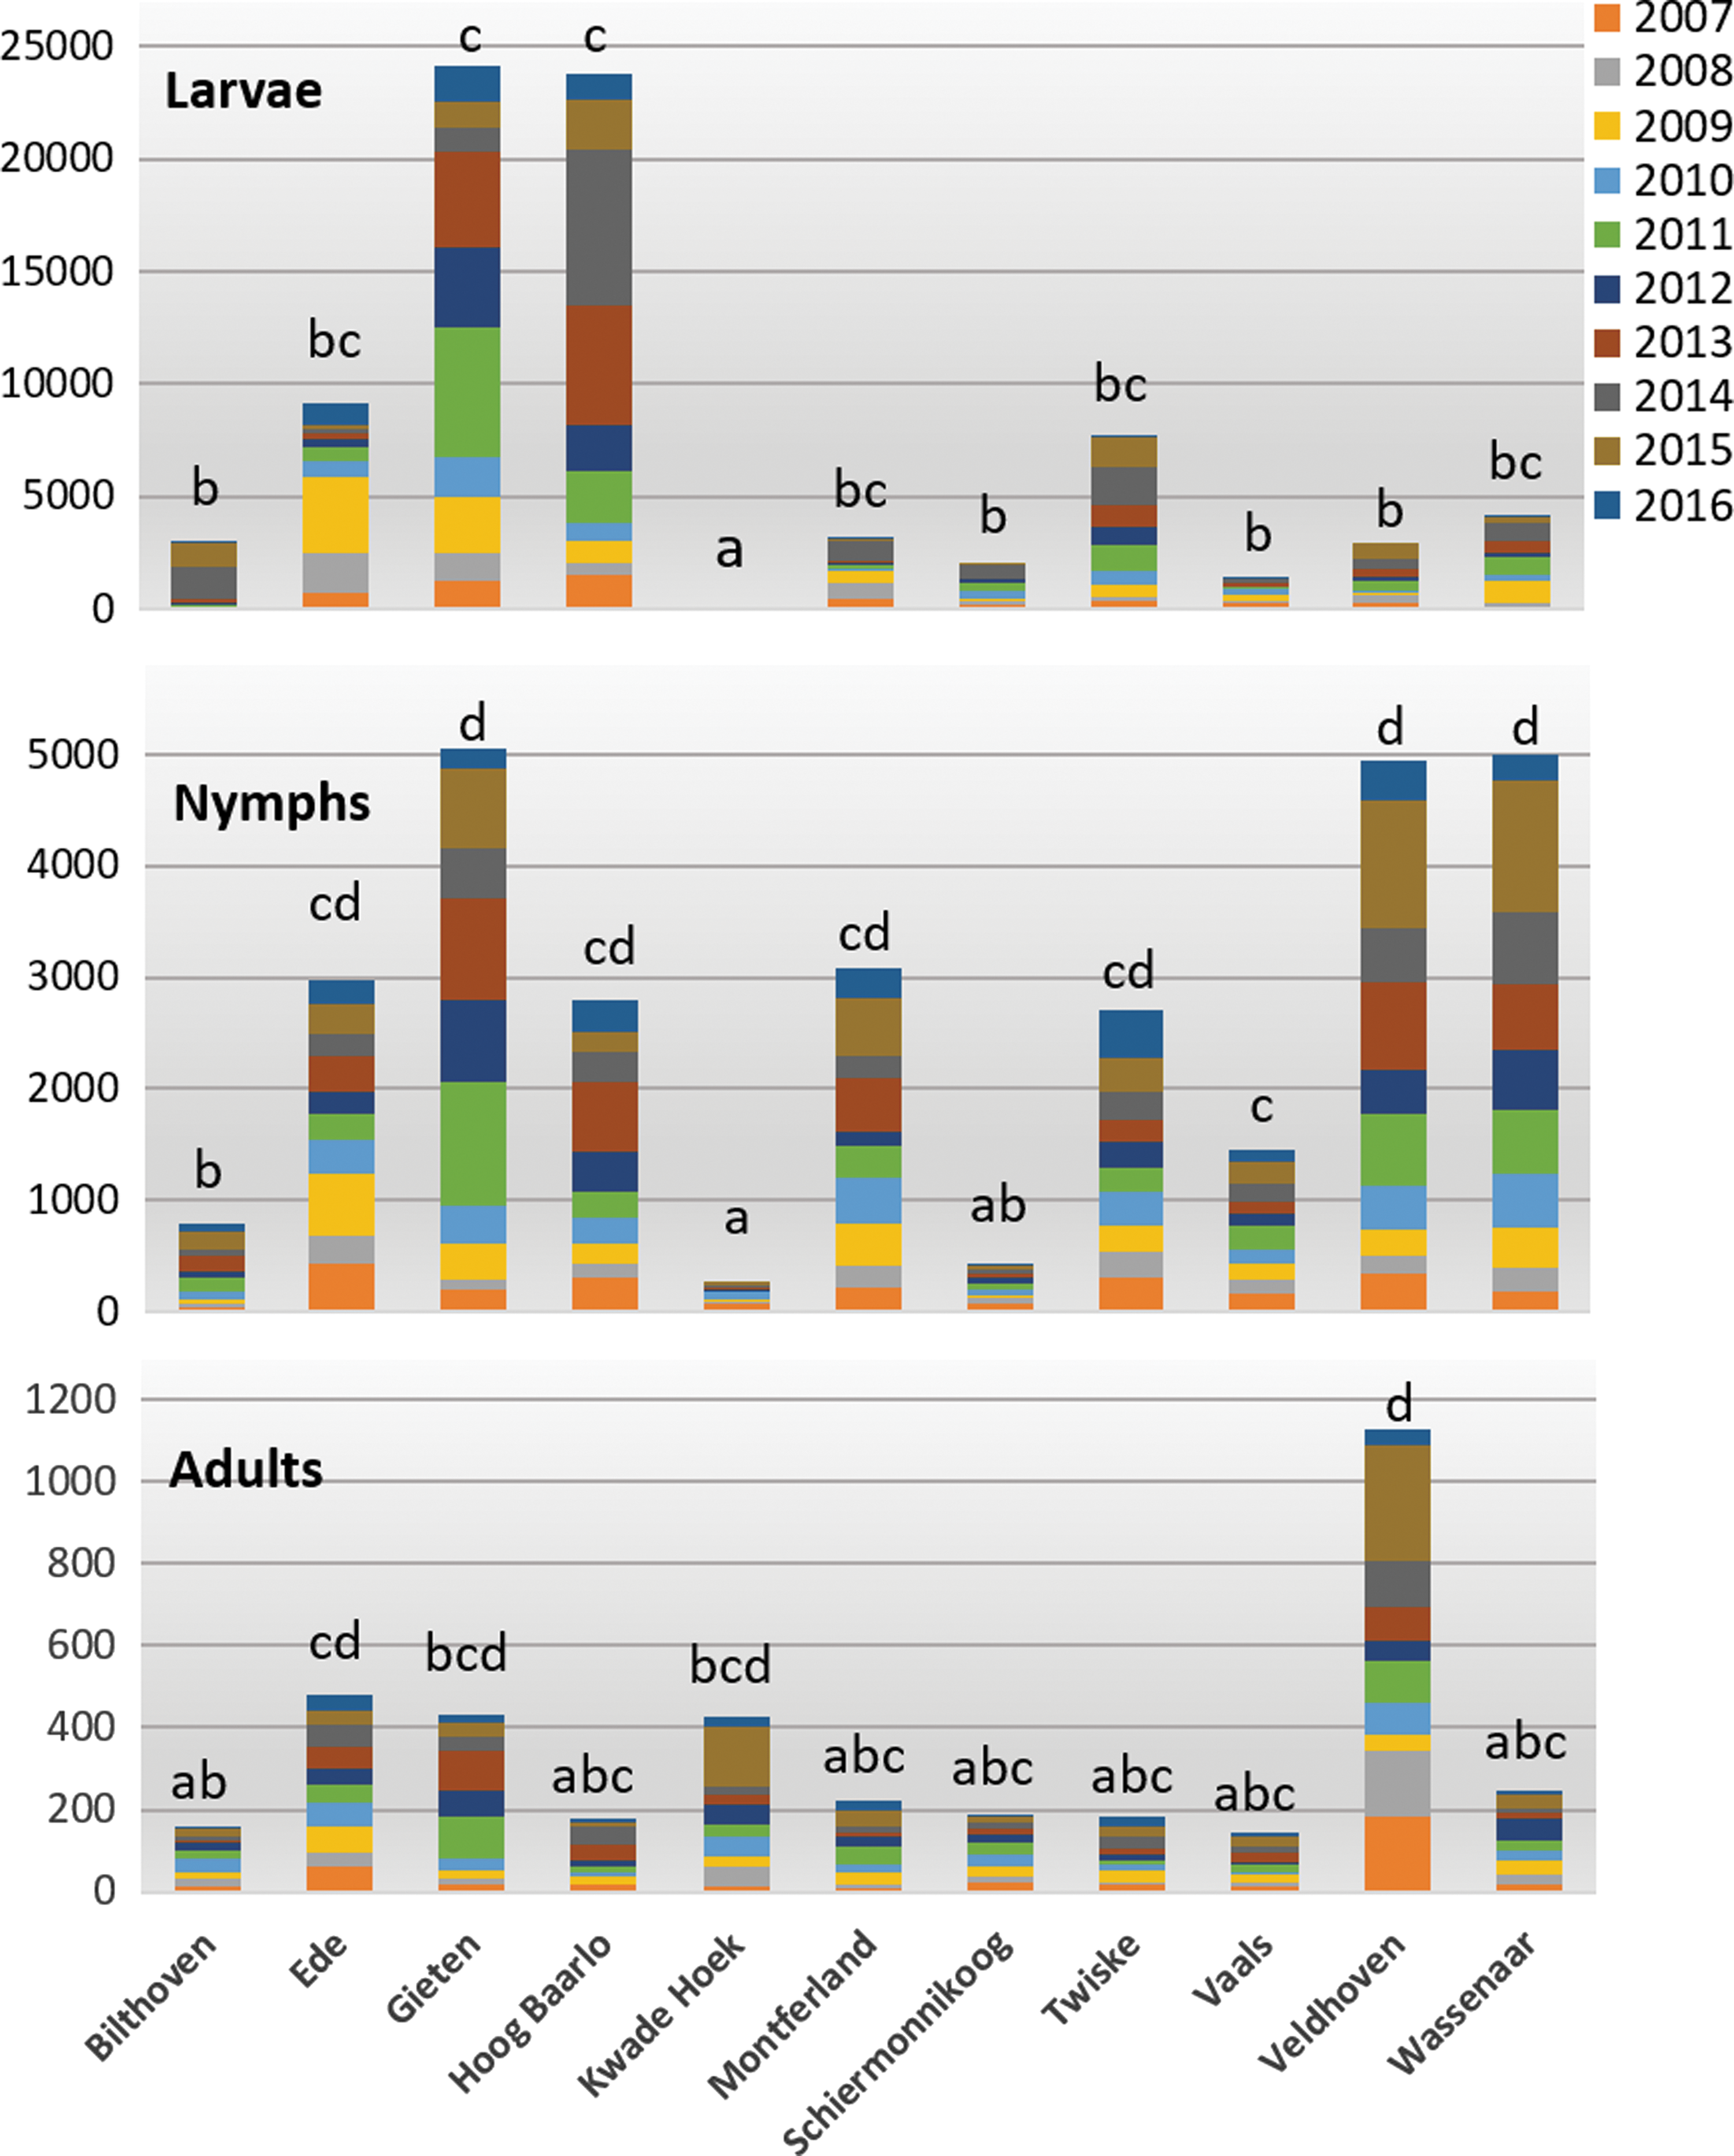
Bars represent the total numbers of ticks collected per location, colors indicate the years. Different letters above the bars indicate significant differences between the locations in pairwise comparisons of the number of ticks collected per year (α = 0.05).
Then, we investigated the factors that could potentially explain the between-year and between-location variation. We used GLMMs to find associations between tick densities and (1) weather variables (such as the temperature and saturation deficit in specific months), (2) mast variables, and (3) habitat variables (such as the thickness of the litter and humus layer, the coverage of moss, blueberries, grass, and tree species). Because some locations have different vegetation types in each transect, the analysis of the impact of vegetation variables was performed at the transect level. For reasons of consistency, we performed the analysis for the climatic and mast variables at the transect level as well. The random effects in these analyses were year and transect nested within location, and the number of observations is 196 (198 based on the 9 full years and 11 locations with 2 transects each, −2 missing values, for a transect in Vaals, from which we have no data after 2013).
Onset of tick activity
Onset of tick activity was defined as the number of the first month in which ticks were active, with February (the coldest month in the Netherlands) as the starting point. That is, when activity is observed in February, the value for onset is 2, and this is the lowest value possible. The onset could only be determined for 10 years (2007–2016), since sampling in 2006 started in July. The number of observations is thus 110 (10 years and 11 locations) for nymphs and adults. For larva, for which the onset of activity could not be determined for Kwade Hoek (where larva were found in only 2 out of 120 sampling occasions), Vaals (where larval presence was highly irregular, also in summer) in all years, and in 2014 for Bilthoven (due to missing observations), we excluded these data points from the analysis.
Using a GLMM, assuming a normal distribution for onset and incorporating year and location as random effects, we investigated the effect of temperatures in winter and spring months on the onset of questing activity. We also plotted the overall spring and winter temperatures (averaged over all locations) against the average onset.
Results
Numbers of ticks per year and location
In total, 118,171 ticks were collected: 83,757 larvae, 30,508 nymphs, and 3906 adults. The numbers of collected ticks of each life stage are presented for each year (Table 2) and for each location (Table 3). The total numbers in 2006 and 2016 are for 6 months only and cannot be compared to the other years. The highest numbers of ticks were observed in 2011, 2013, and 2014. There are substantial differences between locations, with Gieten and Hoog Baarlo having the highest total number of ticks. Kwade Hoek is exceptional both in the low total number of ticks collected (only 865) and in the composition of sampled ticks in terms of life stage: few larvae and an unusually high proportion of adults (50%). Most locations have less than 10% adults (Veldhoven being the other exception, with 13% adults). Details on the numbers collected per year and per location can be found in the Supplementary Table S2.
Total Number of Ticks of Each Life Stage Collected per Year
Note that for 2006 and 2016, collections were made in 6 months instead of 12.
Total Numbers of Ticks of Each Life Stage Collected per Location
Trend
The annual total number of ticks shows a slight increase with time for all stages (Fig. 2). It also shows that there is large variation between the years (height of the bars) and between locations (error bars indicate the standard error (SE) for the average over the 11 locations). A GLMM model for the trend in time (using year [scale] as fixed effect) indicated a positive trend for all stages, although not significant for nymphs (p = 0.035 for larvae, 0.079 for nymphs, and 0.016 for adults). For adults, the trend is caused by the observations in 2015, notably the ones in Veldhoven and Kwade Hoek; excluding the adult ticks from Veldhoven in 2015 leads to a loss of significance of the trend (p = 0.06), and the same applies to Kwade Hoek (p = 0.08).
For larvae and adults, none of the pairwise comparisons between years was significant. For nymphs, only the difference between 2008 and 2015 was significant (p = 0.014), and 2008–2013 was almost significant (p = 0.056). In short, the numbers seem to increase slightly over time, but given the large variation between years and between locations, we cannot determine whether there is a continuous upward trend.
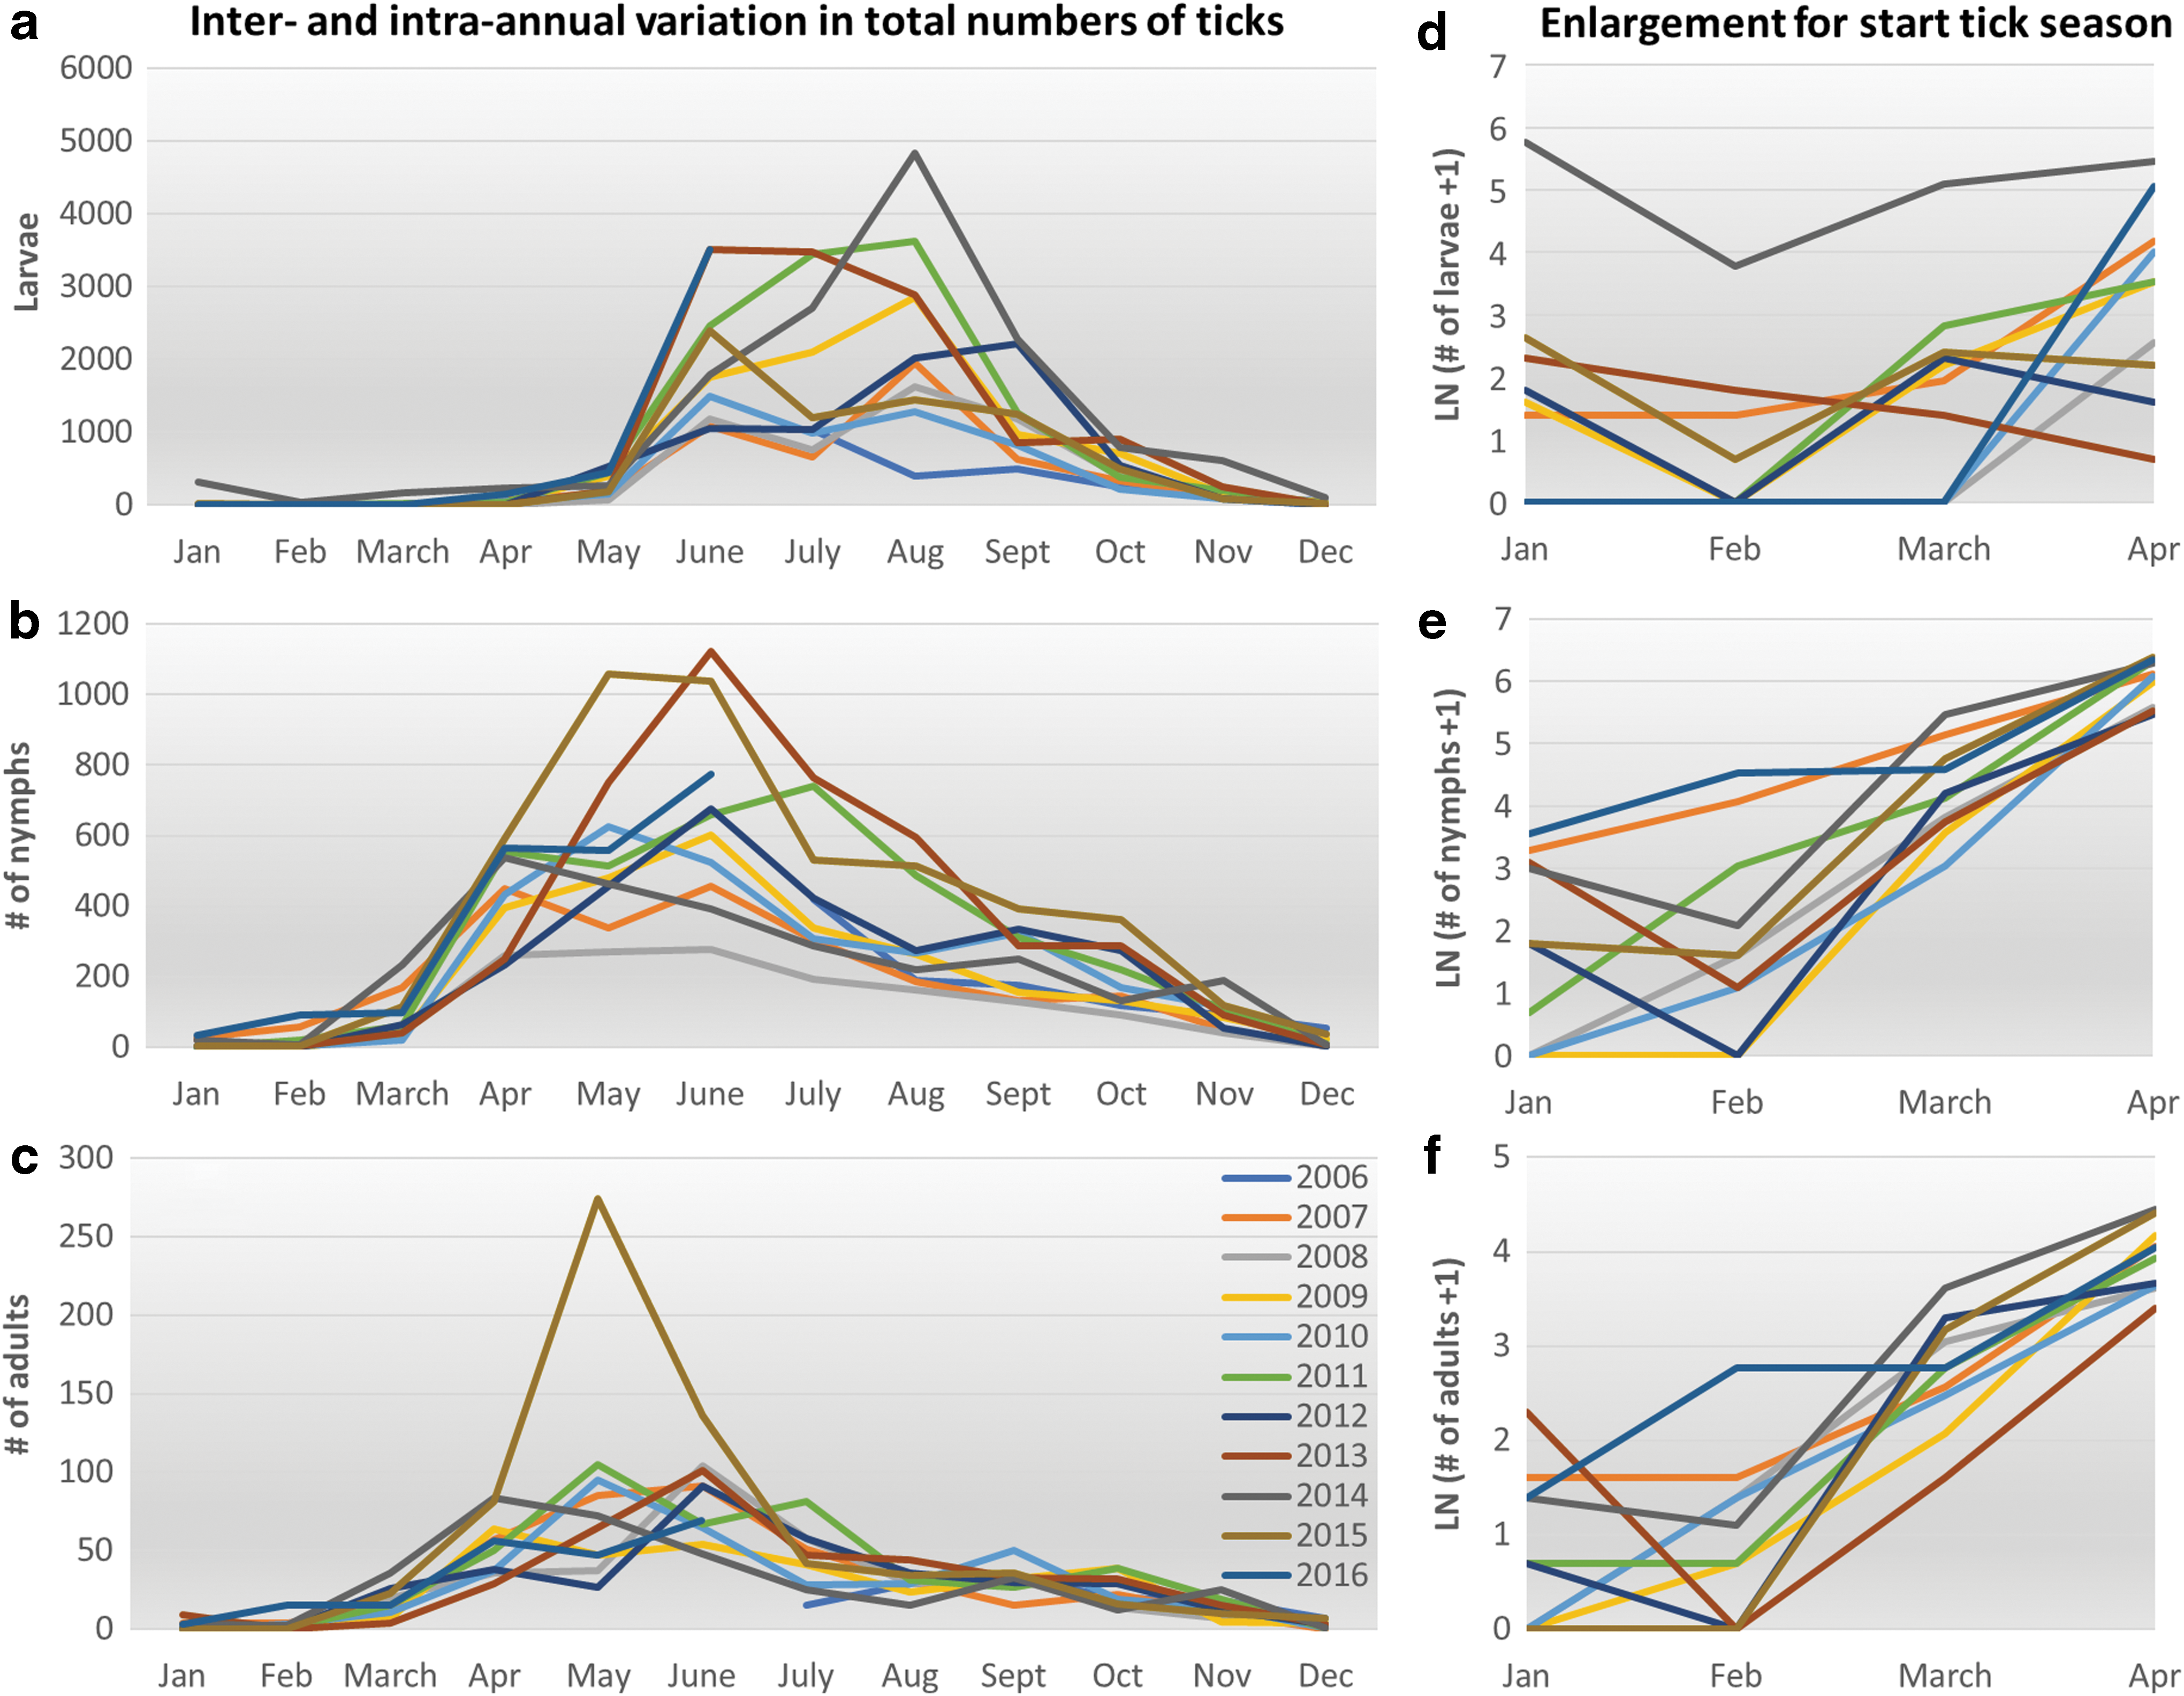
Temporal variation
The between- and within-year variation in density for each of the three life stages is shown in Fig. 3. Larvae show a clear seasonal pattern; the first questing larvae are usually observed in May, highest densities are observed between June and September, and low numbers of larvae remain active in autumn (Fig. 3a). February has the lowest activity of larvae. There is substantial variation between years; in 2007, 2008, and 2010, about 5000 larvae were collected per year, whereas in 2011, 2013, and 2014, the number was more than twice as high (Table 2).
For nymphs (Fig. 3b), the onset and peak of activity are earlier; the first nymphs are usually collected in March and the peak is between April and July. Between-year variation is again substantial, with three times more nymphs collected in 2015 than in the year with the lowest numbers, 2008.
In adult ticks (Fig. 3c), seasonality is slightly less pronounced; the highest densities are observed between April and July, but activity is more constant throughout the year. Between-year variation is low compared to the other life stages, the total number ranges between 318 and 437, with the exception of the 659 adults collected in 2015. This peak, in May 2015, is due to high number of adults collected in Veldhoven and Kwade Hoek in that month.
The start of the tick activity season is shown in more detail, at a log scale (Fig. 3d–f), to enable a closer look at the differences between years in tick activity early in the season. Whereas the absolute numbers of ticks collected in those months may be low compared to the peak of activity, the fact that the risk of acquiring a tick bite is not zero, is relevant for risk communication. In years with higher temperatures in winter and early spring, such as 2007 (in orange), 2014 (in dark gray), and 2016 (in steel blue), ticks of all stages are collected in February, whereas in colder years (e.g., 2010, in light blue), no larvae are collected until April.
Spatial variation
The total number of ticks collected varied substantially between the locations (Fig. 4). Larval densities were highest in Gieten and Hoog Baarlo, ∼10 times higher than in most other locations. Larva were almost absent in Kwade Hoek. Densities of nymphs were highest in Gieten, where larvae were also high, but also in two locations where larval densities were low: Veldhoven and Wassenaar. Total adult density in Veldhoven was much higher than in the other locations.
The patterns in variation between locations differ between the three life stages; locations with the highest numbers of larvae are not always the locations with the highest number of nymphs or adults. The link with the habitat or vegetation type is also not very straightforward. For instance, five very similar forests with oak, beech, and birch (Ede, Gieten, Hoog Baarlo, Montferland, and Veldhoven) show different patterns, with high numbers of larvae being found in Gieten and Hoog Baarlo and with extraordinary high number of adults being found in Veldhoven. Similarly, the three coastal locations (Kwade Hoek, Schiermonnikoog, and Wassenaar, of which the latter two have similar vegetation types) show striking and significant differences in terms of densities. The results of the pairwise comparisons between locations are shown in Supplementary Table S3.
Factors explaining the variation
Climatic factors and mast
Except for two variables (temperature in November for larvae and in May for nymphs), none of the climatic factors was significant at α = 0.05 level (Supplementary Table S4). The mast score in common oak seemed to have a negative effect on densities of nymphs and adults. When the analysis was restricted to transects in which the relevant tree species was present, a negative association between beech mast and larvae and nymphs was also found. For American oak mast, we found a positive association with nymph densities.
Habitat factors
Using the GLMM model, we tested the associations between single habitat factors and the total number of ticks collected per transect per year (Supplementary Table S5). We found that the density of ticks was positively associated with the thickness of the humus layer for all three life stages. The regression coefficients for larvae, nymphs, and adults were 0.63 (p = 9.1 × 10⁻⁸), 0.25 (p = 7.2 × 10⁻⁶), and 0.12 (p = 0.034). The coefficients are on a log scale, which means that for every cm of increase in humus layer, the expected number of ticks was 1.88, 1.28, and 1.13 times higher, respectively.
Density of larvae and nymphs was positively associated with abundance of European blueberry (V. myrtillus L.). For larvae, the regression coefficient was 0.45 (p = 3.7 × 10⁻⁵) and for nymphs 0.16 (p = 1.2 × 10⁻³). For larvae, significant positive associations were also found for moss layer thickness (regression coefficient 0.45, p = 6.0 × 10⁻⁴) and the abundance of blackberry (R. fruticosus) (regression coefficient 0.40, p = 6.0 × 10⁻⁴). Adult tick density was positively associated with the abundance of grass species M. caerulea (regression coefficient 0.20, p = 7.7 × 10⁻⁵) and a trend (p = 0.076) was observed for D. flexuosa. No significant effects (at 0.05 confidence level) were found for the thickness of the litter layer.
Onset of questing behavior and the link with temperature
Even in winter time, the number of captured ticks rarely goes down to zero when we consider all locations simultaneously (Fig. 3d–f), which makes it hard to determine an overall timing of the onset. Still, for individual locations, it was possible to define an onset of questing activity for each year. A table with the onset per location and per year can be found in Supplementary Table S6.
The average onset of activity was in March for nymphs (mean value of onset was 3.0, SE = 0.13) and April/May for larva (mean value 4.54, SE = 0.087, excluding Kwade Hoek and Vaals). For adult ticks, the overall average was mid-March (mean of onset was 3.63, SE = 0.09).
For each stage, onset was modeled as a function of the mean temperature in a specific month or in a period of three months in winter or spring (Supplementary Table S7). The temperature variables all refer to average mean temperatures. Relevant variables for the onset were the temperatures in March and April for larvae, and in January and February for nymphs. The expected onset of larval activity had a significant negative association with the mean temperatures in March (p = 0.010) and April (p = 0.011), but not with other temperatures. The estimated effect was −0.15 and −0.16 on linear scale, which means that the expected onset was 0.15 months earlier per degree Celsius increase in temperature. In nymphs, a similarly sized effect was observed; in this case for the temperature in January and February.
The effect of temperature on the onset of questing activity is illustrated in Fig. 5, where the mean onset (averaged over all locations) is plotted against the mean winter and spring temperatures (also averaged over all locations) for the years 2007–2016.
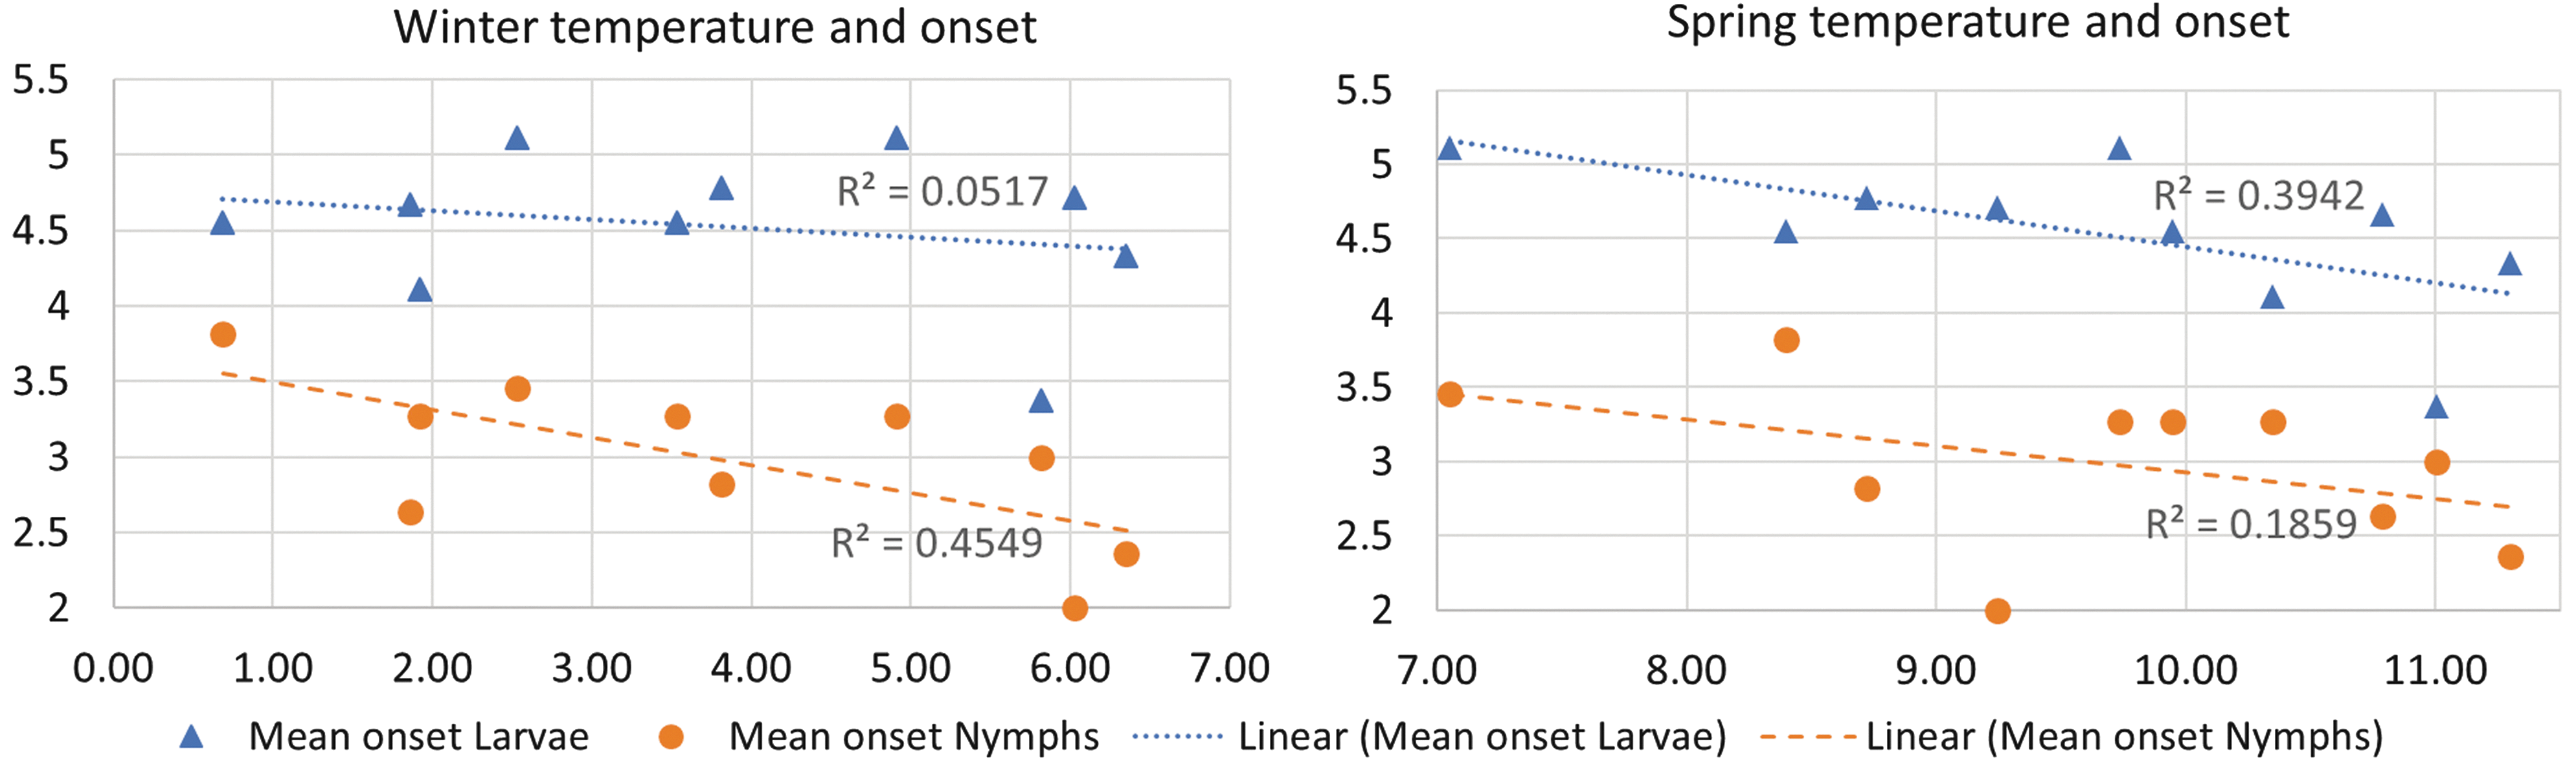
The mean onset (averaged over all locations) is plotted against the mean winter temperature (left panel, mean temperature in December–February) and against the mean spring temperatures (right panel, mean temperature in March–May). Both onset and mean temperature values are averaged over all locations, to obtain one value per year. Years range from 2007 to 2016, since the onset in 2006 was before the start of the study.
Discussion and Conclusions
To our knowledge, this is the first time that a large number of locations are monitored monthly for all mobile tick life stages for a 10-year period. Most longitudinal studies focus on nymphs (but see Tack et al. 2012, Alonso-Carné et al. 2016, Ehrmann et al. 2017) and/or sample only in the peak season (Hubálek et al. 2003, Cayol et al. 2017). Studies that monitored throughout the year usually considered one or few sites, for example, two sites in northern Spain (Alonso-Carné et al. 2016) and a single site in Switzerland (Hauser et al. 2018); the latter only sampled nymphs. The results of this long-term study on the densities of questing ticks provide important insights in temporal and spatial variation in tick phenology and tick densities in the Netherlands.
The phenology of ticks in the Netherlands shows a unimodal pattern, with average onset of activity in March (nymphs and adults) and April–May (larvae). Due to the mild climate in the Netherland, winter activity was regularly observed, but at low densities. Questing tick density peaks in summer (June–September) for larvae and in late spring and early summer (April–June) for nymphs and adults, after which the numbers steadily decline. Not surprisingly, our observed seasonal pattern shows similarities to the one found in a study in neighboring country Belgium, with a similar climate (Tack et al. 2012). In this study, ticks of all stages were collected in between April and October 2008–2010. They observed a peak in summer for larvae and in spring for adults. Contrary to our findings, they did not observe a clear peak for nymphs. In terms of the ratios of the difference life stages, they found similar ratios.
The observed phenology in our study, with the larval activity peak generally 1 or 2 months after the peaks in adult and nymphal activity, and with activity of all three mobile life stages throughout the summer, could be favorable for transmission of pathogens between the life stages (since rodents that are infected by nymphs during early spring, can infect large numbers of larvae a couple of weeks later, in the peak of the larval activity). This may contribute to the comparatively high Borrelia infection prevalence in ticks as found in the Netherlands (Takken et al. 2017). Whether or not the timing of onset and peak activity influences the prevalence of pathogens remains to be studied.
In this study, we did not attempt to explain the seasonal patterns with climatic variables, but it is clear that more ticks are active in the warmer periods of the year. Instead, we focused on the variation between years and between locations, both in tick densities and in onset of tick activity. Substantial differences were observed between years and, especially, between locations. Ratios between life stages also vary greatly between locations.
In terms of temporal variation, we observed a slightly upward trend in tick density over time, but this trend was not observed in all locations, and variation between locations was large. In adults, the trend could be attributed to high numbers in May 2015 in two locations only; otherwise, there was no clear trend in adults. The pairwise comparison between years showed only a significant difference between 2008 and 2015. This does not mean that there is no between-year variation (as can be seen from Fig. 3 and Supplementary Table S2), but rather that the variation between locations is too large to obtain significant results for the between-year differences.
The GLMM was used to identify the temporally varying explanatory variables (climatic and mast-related variables) that could be drivers for the variation between years. The results indicated that climatic factors, such as mean temperature and saturation deficit in specific months, did not have significant effects on the total annual densities. The absence of evidence for effects of climatic variables on tick densities may be due to several reasons.
First, climate data from nearby meteorological stations are not always a good proxy for the microclimates used by ticks (in the understory of forest, or in the litter layer) (Boehnke et al. 2017). To minimize the error, we used interpolated climate data rather than just the data from the nearest meteorological station, but the problem of microhabitats having different climatic conditions remains. However, it is likely that extended periods of unusually high or low temperatures, such as the exceptionally warm springs of 2007 and 2014 and the cold winter of 2010, will impact the climatic conditions in the microhabitat.
Second, variation due to other (unobserved) factors may be more important, thus masking the effect of climatic variables. For instance, we found very different (interannual) temporal dynamics in tick densities in two very similar locations in close proximity to each other, Ede (where densities were highest in 2009) and Hoog Baarlo (where densities were highest in 2013–2014). This suggests that other factors than vegetation and climate play a role in modulating tick populations. Especially, the composition and abundance of wildlife are likely to have had a strong impact on tick populations (Mannelli et al. 2012, Sprong et al. 2012, Paul et al. 2016;), but detailed information on (fluctuations in) wildlife densities was not available in this study.
Finally, it may be that climate does not affect total tick densities, only the timing of tick activity. The mild and moderate climate in the Netherlands are generally very suitable for I. ricinus and extreme climatological circumstances that are detrimental for ticks, such as extreme drought and very high or very low temperatures, are unlikely to play a role here (Table 1). The fact that I. ricinus, and especially the larvae, which are very vulnerable for desiccation (Randolph and Storey 1999), are active throughout the summer, suggests that relative humidity is rarely a limiting factor in the Netherlands. The typical bimodal pattern observed in some other countries (Estrada‐Peña et al. 2004, Cayol et al. 2017) is not found in our study.
Contrary to the annual densities, for which we did not find an association with climatic factors, the onset of questing activity was clearly affected by temperature. Onset was associated with winter temperature for nymphs and early spring temperature for larvae; in years with higher temperatures, the onset was earlier.
Regarding the mast variables (i.e., the mast scores in the previous year), we found significant negative associations between densities of larvae and nymphs and beech mast, as well as between nymph and adult densities and common oak mast. American oak mast, on the contrary, showed a significant positive association with density of nymphs. A high mast score in the previous year is thought to increase rodent winter survival (Clement et al. 2009) and hence rodent densities (Ostfeld et al. 1996, Clotfelter et al. 2007). High rodent densities increase the chance of larvae and nymphs finding a host, which in turn increases the survival rates into the next stages, that is, nymphs or adults. On the other hand, high rodent densities could result in a higher removal of larvae and nymphs from the vegetation, resulting in a shorter questing time and a lower number of ticks available for cloth dragging (Dobson 2014). Both effects could play a role here. Since location-specific information on mast was not available, we had to assume that mast varied between years in the same way for all locations, which may not be the case. More research and the availability of local mast data are needed before we can draw conclusions on the effect of mast on tick densities.
Given the sampling design, which comprised very different habitats (dune/coastal area, marsh area, and several types of temperate forest), it is not surprising that we found significant differences in densities between locations. However, we did not find straightforward links between tick densities and habitat types. Between the coastal locations, we found differences, not only in the sense that Kwade Hoek had a remarkably low number of larvae but also in terms of differences in nymphal densities between the sites in Wassenaar and Schiermonnikoog, which have similar vegetation types and climate. Even between locations at close proximity and with very similar (forest) habitats, like Ede and Hoog Baarlo, we found large differences in numbers of questing ticks (with Hoog Baarlo having 2.5 times more larvae and 2.5 times fewer adults than Ede).
All habitat variables that were found to be associated with tick densities can be linked to the biology of I. ricinus. Thickness of the humus layer and abundance of moss are likely to have a positive effect on the survival of larvae. Blueberries are food for rodents and might be an indicator of higher rodent densities. Molinia may provide a questing spot for adults, but it should be noted that Molina was found only in Veldhoven, so these results only indicate that Veldhoven has a high number of adult I. ricinus, not necessarily that Molinia has an effect on ticks. More generally, due to the design of the study (no replicates, vegetation type, and location are always linked) and due to the fact that we tested a large number of explanatory variables on the same data set, we need to be cautious with the interpretation of the p values; at α = 0.05 level, 1 in 20 variables is expected to be “significant” due to chance alone. We should therefore regard all significant results as indications rather than as proof that the factor plays a role. Results from this type of observational research lead to new hypotheses, which should then be tested in a more experimental setup, that is, keeping other factors constant as much as possible. If we for instance want to know whether the relationship with blueberry abundance is real or a confounder, similar forest plots with only the blueberry abundance varying should be investigated.
Even though we found significant results for some habitat factors, much of the variation could not be explained. As mentioned before, differences between locations and between years in terms of (large) wildlife may have been very important in determining the densities of ticks. For example, in our study, Hoog Baarlo was the only location where red deer were present, while elsewhere in the Netherlands, roe deer is found. Both deer species are important hosts for adult ticks, and differences in abundance can affect tick densities considerably (Hofmeester et al. 2016). Future research projects on tick dynamics should include estimates of wildlife densities, for example, by camera trapping methods, or assessing the presence of deer beds, as was done in Tack et al. (2012).
Our results are in agreement with several other studies that indicate that I. ricinus seems to thrive under a wide range of different circumstances and that local factors, including microhabitat and local fauna, are likely to be important drivers of tick population dynamics.
A recent study on the effect of climate and land use on the spatiotemporal variability of tick-borne bacteria in five European countries did not find any association between climatic or land use categories and tick abundance, except for Normalized Difference Vegetation Index (NDVI) (Rosà et al. 2018), indicating that it is difficult to find straightforward relationships between tick densities and climatic and vegetation factors. Hauser et al. (2018) investigated the influence of climatic factors on I. ricinus nymphal abundance and phenology in a study with monthly observations over a 15-year period in Switzerland (2000–2014). They found that, even though temperature and saturation deficit are important determinants of nymph activity on the short term, global trends in these variables failed to explain the observed decline in nymphs. A study in Germany also found a limited effect of macroclimate, and more of the variation in tick abundance explained by functional (micro-) habitat characteristics, such as understory vegetation and leaf litter (Ehrmann et al. 2017).
The study is an important step in improving our understanding of the phenology of ticks in the Netherlands. It comprised all life stages, which enables us to investigate the role that different climatic and habitat factors have on the different stages. The long time series allowed for an analysis of the role of climatic variables on tick densities and on the onset of tick activity. We conclude that climatic variables do not have a straightforward association with tick density in the Netherlands, but that winter and spring temperatures influence the onset of tick activity. Several habitat factors, such as abundance of blueberries and thickness of litter layer, seem to be associated with tick densities.
Footnotes
Acknowledgments
This study was funded by Wageningen University and Research, the National Institute for Public Health and the Environment, and the Netherlands innovation programme “Ruimte voor Geo-informatie.” The contributions of R.Z.-M. and I.G.-M. were supported by internal funds of the Faculty ITC of the University of Twente. The authors are highly appreciative of the monthly tick collections done by the group of volunteers. We thank the managers of several nature reserves for permission to collect ticks in often closed areas, which has greatly facilitated the work presented. Also, we would like to thank Gerrit Gort for advice on the statistical analysis.
Author Disclosure Statement
No conflicting financial interests exist.
Supplementary Material
Supplementary Table 1
Supplementary Table 2
Supplementary Table 3
Supplementary Table 4
Supplementary Table 5
Supplementary Table 6
Supplementary Table 7
*
References
Supplementary Material
Please find the following supplemental material available below.
For Open Access articles published under a Creative Commons License, all supplemental material carries the same license as the article it is associated with.
For non-Open Access articles published, all supplemental material carries a non-exclusive license, and permission requests for re-use of supplemental material or any part of supplemental material shall be sent directly to the copyright owner as specified in the copyright notice associated with the article.