
Abstract
The interruption of vector-borne transmission of Chagas disease was certified in Chile in 1999. Our goal was to determine the effects of the interruption of vector transmission on the age and spatial distributions of the risk of Chagas disease. We analyzed cases of Chagas disease by age and sex between 1989 and 2017, from notified disease reports of the Ministry of Health. Bayesian risk maps were constructed using the Besag–York–Mollie model. The reported cases of Chagas disease had a mean age of 45.9 ± 17.6 years. Small changes in the age distribution were found among different periods (χ2 15 = 602.4, p < 0.001). These were explained mainly by numbers lower than those expected in age groups 0–39 years in the 2011–2017 period. Part of the observed reduction in the proportion of individuals in the lower strata could be explained by the aging of the Chilean population. An increase of reported cases was detected after the interruption of vector-borne transmission (F 1,327 = 4.24, p < 0.04), with regional differences (F 14,1308 = 4.35, p < 0.001). The regions of the north-central area that have the highest burden of Chagas tended to decrease the relative risk, while the regions of the south tended to increase and small risk areas appear in zones where there are no insect vectors. There is still no clear evidence of a reduction in the reported cases in Chile. This could be explained mainly by an improvement in the detection of cases, but it cannot be ruled out that vector transmission still exists. The changes in distribution suggest potential impact from human internal migration and blood transfusion. This study provides strong evidence supporting the idea that entomological surveillance and long-term follow-up of Chagas disease need to be maintained after certification of interruption in endemic countries.
Introduction
Chagas disease, a vector-borne disease caused by the protozoan Trypanosoma cruzi, is one of the most prevalent and neglected disease (Hotez et al. 2012). It is mainly observed in Central and South America, but due to an increase in human migration in recent years a considerable number of cases have been described in countries in Europe, Asia, and North America (MINSAL 2014). Chagas disease is considered an emerging disease that affects ∼6 million people, with 14,000 deaths per year and 70 million people at risk (Hotez et al. 2012, Cucunubá et al. 2016, PAHO 2020).
Several types of T. cruzi transmission have been reported: vector borne, vertical, blood transfusion, oral transmission, and organ transplantation; in Latin America the transmission is mainly by hematophagous insects (Triatominae) (Moncayo and Silveira 2010). In Chile the main vector is Triatoma infestans, which is responsible for the domestic cycle that includes humans and peridomestic animals (Canals et al. 2018). It occurs mainly in rural dwellings in which vectors live and multiply in cracks in walls, holes, etc. The peridomestic cycle is the link between the sylvatic and domestic cycles; it involves mammals such as rodents, cats, and dogs, and sylvatic triatomines attracted to homes by light and food (Guhl 2009). The sylvatic vectors in Chile are Mepraia spinolai, Mepraia Gajardoi, and Mepraia parapatrica. Previous studies assessed a low impact of M. spinolai on Chagas prevalence (Canals et al. 1993, 1999), but new studies are necessary to estimate its current importance (Frías-Lasserre et al. 2017, Canals et al. 2018).
The interruption of vector transmission of Chagas disease by T. infestans was certified in Chile in 1999, and ratified in 2016 by INCOSUR and PAHO experts (Canals et al. 2018). The certification was defined according to the agreement of the control initiatives for the interruption of systematic and sustained transmission of T. cruzi by the vector T. infestans. This was based on the existence of a sustained surveillance system and on entomological criteria that demonstrate the decrease in the level of infestation, the density, and dispersion of T. infestans in the areas with entomological surveillance and complemented by seroprevalence studies of T. cruzi in children <5 years living in the areas under the program.
Despite the certification of interruption of vector-borne transmission, it is currently estimated that there are ∼100,000 people with Chagas disease and ∼900,000 people at risk in Chile (Canals et al. 2018), with a prevalence of 1.2% (MINSAL 2018). The annual mortality is 0.36 ± 0.55 per 105 inhabitants. The annual reported cases showed an increase from an average of 2.7 ± 1.3 per 105 inhabitants to 7.3 ± 2.0 per 105 inhabitants before 2009, with a tendency toward stabilization after this date. Household infestation by T. infestans has decreased from ∼28% to 0.5% in 2000 and to 0.047% in 2015 (Parra et al. 2016). Trypano-triatomine indices have also remained high in vector species: 41.8% ± 13.3% in T. infestans and 20.9% ± 11.5% in M. spinolai (Canals et al. 2017).
The rates of increasing reported cases contrast with the assumption that vector-borne transmission was interrupted, motiving the study of the changes in the dynamics of the spatial distribution of Chagas disease. Questions have arisen about the process of certification of the interruption of vector transmission, since complete interruption is considered improbable; it has been suggested that this certification, which implies freezing funds and weakening surveillance, reinforces the idea that transmission will no longer occur giving a false sense of security (Rojas de Arias 2016).
The objective of this study was to determine the changes in the age distribution and the risk of Chagas disease in Chile in the period 1989–2017, comparing the periods before and after certification of interruption of vector-borne transmission.
Materials and Methods
We work with data on patients positive for Chagas disease confirmed through serological tests in the Instituto de Salud Pública of Chile and in blood banks, obtained from mandatory reports of Chagas disease from Ministry of Health, a long-term record of patients in Chile. Chile is administratively divided into units called regions; each region is composed of a variable number of communes. The database used was a file with number of cases, locality (commune and region) (Supplementary Data) and age, without personal data of the patient. A smaller part of the data is provided by people who are referred to the program by clinical health services. Most of the data come from cases detected by active search, which consists of doing the laboratory test (ELISA) to the risk groups of people (MINSAL 2014). The data include patients notified as being in the determinate and indeterminate phases of Chagas disease. Serological testing will not identify those exposed but not infected, or those treated but cleared of the parasite, therefore it does not distinguish between those currently infected and those exposed and recovered. The research was approved by the ethics committee of the Faculty of Medicine of Universidad de Chile.
Descriptive statistics of age and sex and comparisons of the distribution frequency of age groups were performed with chi-square tests with post hoc comparisons implemented (R software).
We analyzed the absolute risk (reported cases/105 inhabitants) and the relative risk. We compared five periods of 5–6 years, Q1: 1989–1994, Q2: 1995–1999, Q3: 2000–2005, Q4: 2006–2010, and Q5: 2011–2017. Since Chile has a nearly linear geography from North to South, to control for the spatial covariation of absolute risk among communes, the geometric center of each commune was georeferenced using geographic latitude from Datum WGS 84 (World Geodetic System). Then, the reported cases were compared with repeated-measures two-way covariance analysis, considering regions and periods (Q1–Q5) as the factors with repeated measures and the data of communes as the response variable, with latitude as the covariable (STATA 14). Logarithmic transformation was performed to meet the normality assumption. The sphericity assumption was studied with the Mauchsley test (Girden 1992). Multiple comparisons were made with Tukey's test. Planned contrasts of (preinterruption:Q1–Q2) versus (postinterruption: Q3–Q4–Q5) were performed.
Bayesian risk maps were constructed using the Besag–York–Mollie (BYM) model (Besag et al. 1991), using WinBUGS and ArcGIS software. Relative risk measures the observed cases compared with those expected by population size and spatial and random effects. The BYM model assumes that the number of cases (Oit ) in area i and period t follows a Poisson distribution with mean μit = eit × rit , with rit = relative risk and eit = expected number of cases. That is, log (μit ) = log (eit ) + α + θit , where α is the constant parameter (global rate), and θit = Sit + Uit . Uit represents the nonspatial random fluctuation, with a normal (0, σv 2) distribution, and Sit is the spatially structured variability modeled with a Conditional Autoregressive distribution whose joint distribution is ∼N (0, σU 2 Q-), where Q is the matrix that defines the neighborhood structure (Besag et al. 1991, Sakar et al. 2010). Finally, the relative risk is given as rit = eitα + θit . The expected number of cases was estimated as eit = PitIt , where Pit is the total population of the locality and It is the average reported cases per 100 thousand inhabitants. The population sizes of each locality and time were obtained from the National Institute of Statistics of Chile (INE), and the annual reported cases per 105 inhabitants from the Notifiable Disease Registry.
Results
The mean age of reported cases was 45.9 ± 17.6 years (mean ± standard deviation) with 55.35% females and 44.65% males, with differences between sex (Table 1). There were differences in the age distribution among different periods (χ2 15 = 602.4, p < 0.001). The differences were explained mainly by numbers lower than those expected in age groups 0–4, 5–19, and 20–39 years in the Q5 period (2011–2017); numbers lower than those expected in age group >60 years in Q1 and numbers higher than those expected in age group >60 years in Q5 (Fig. 1).
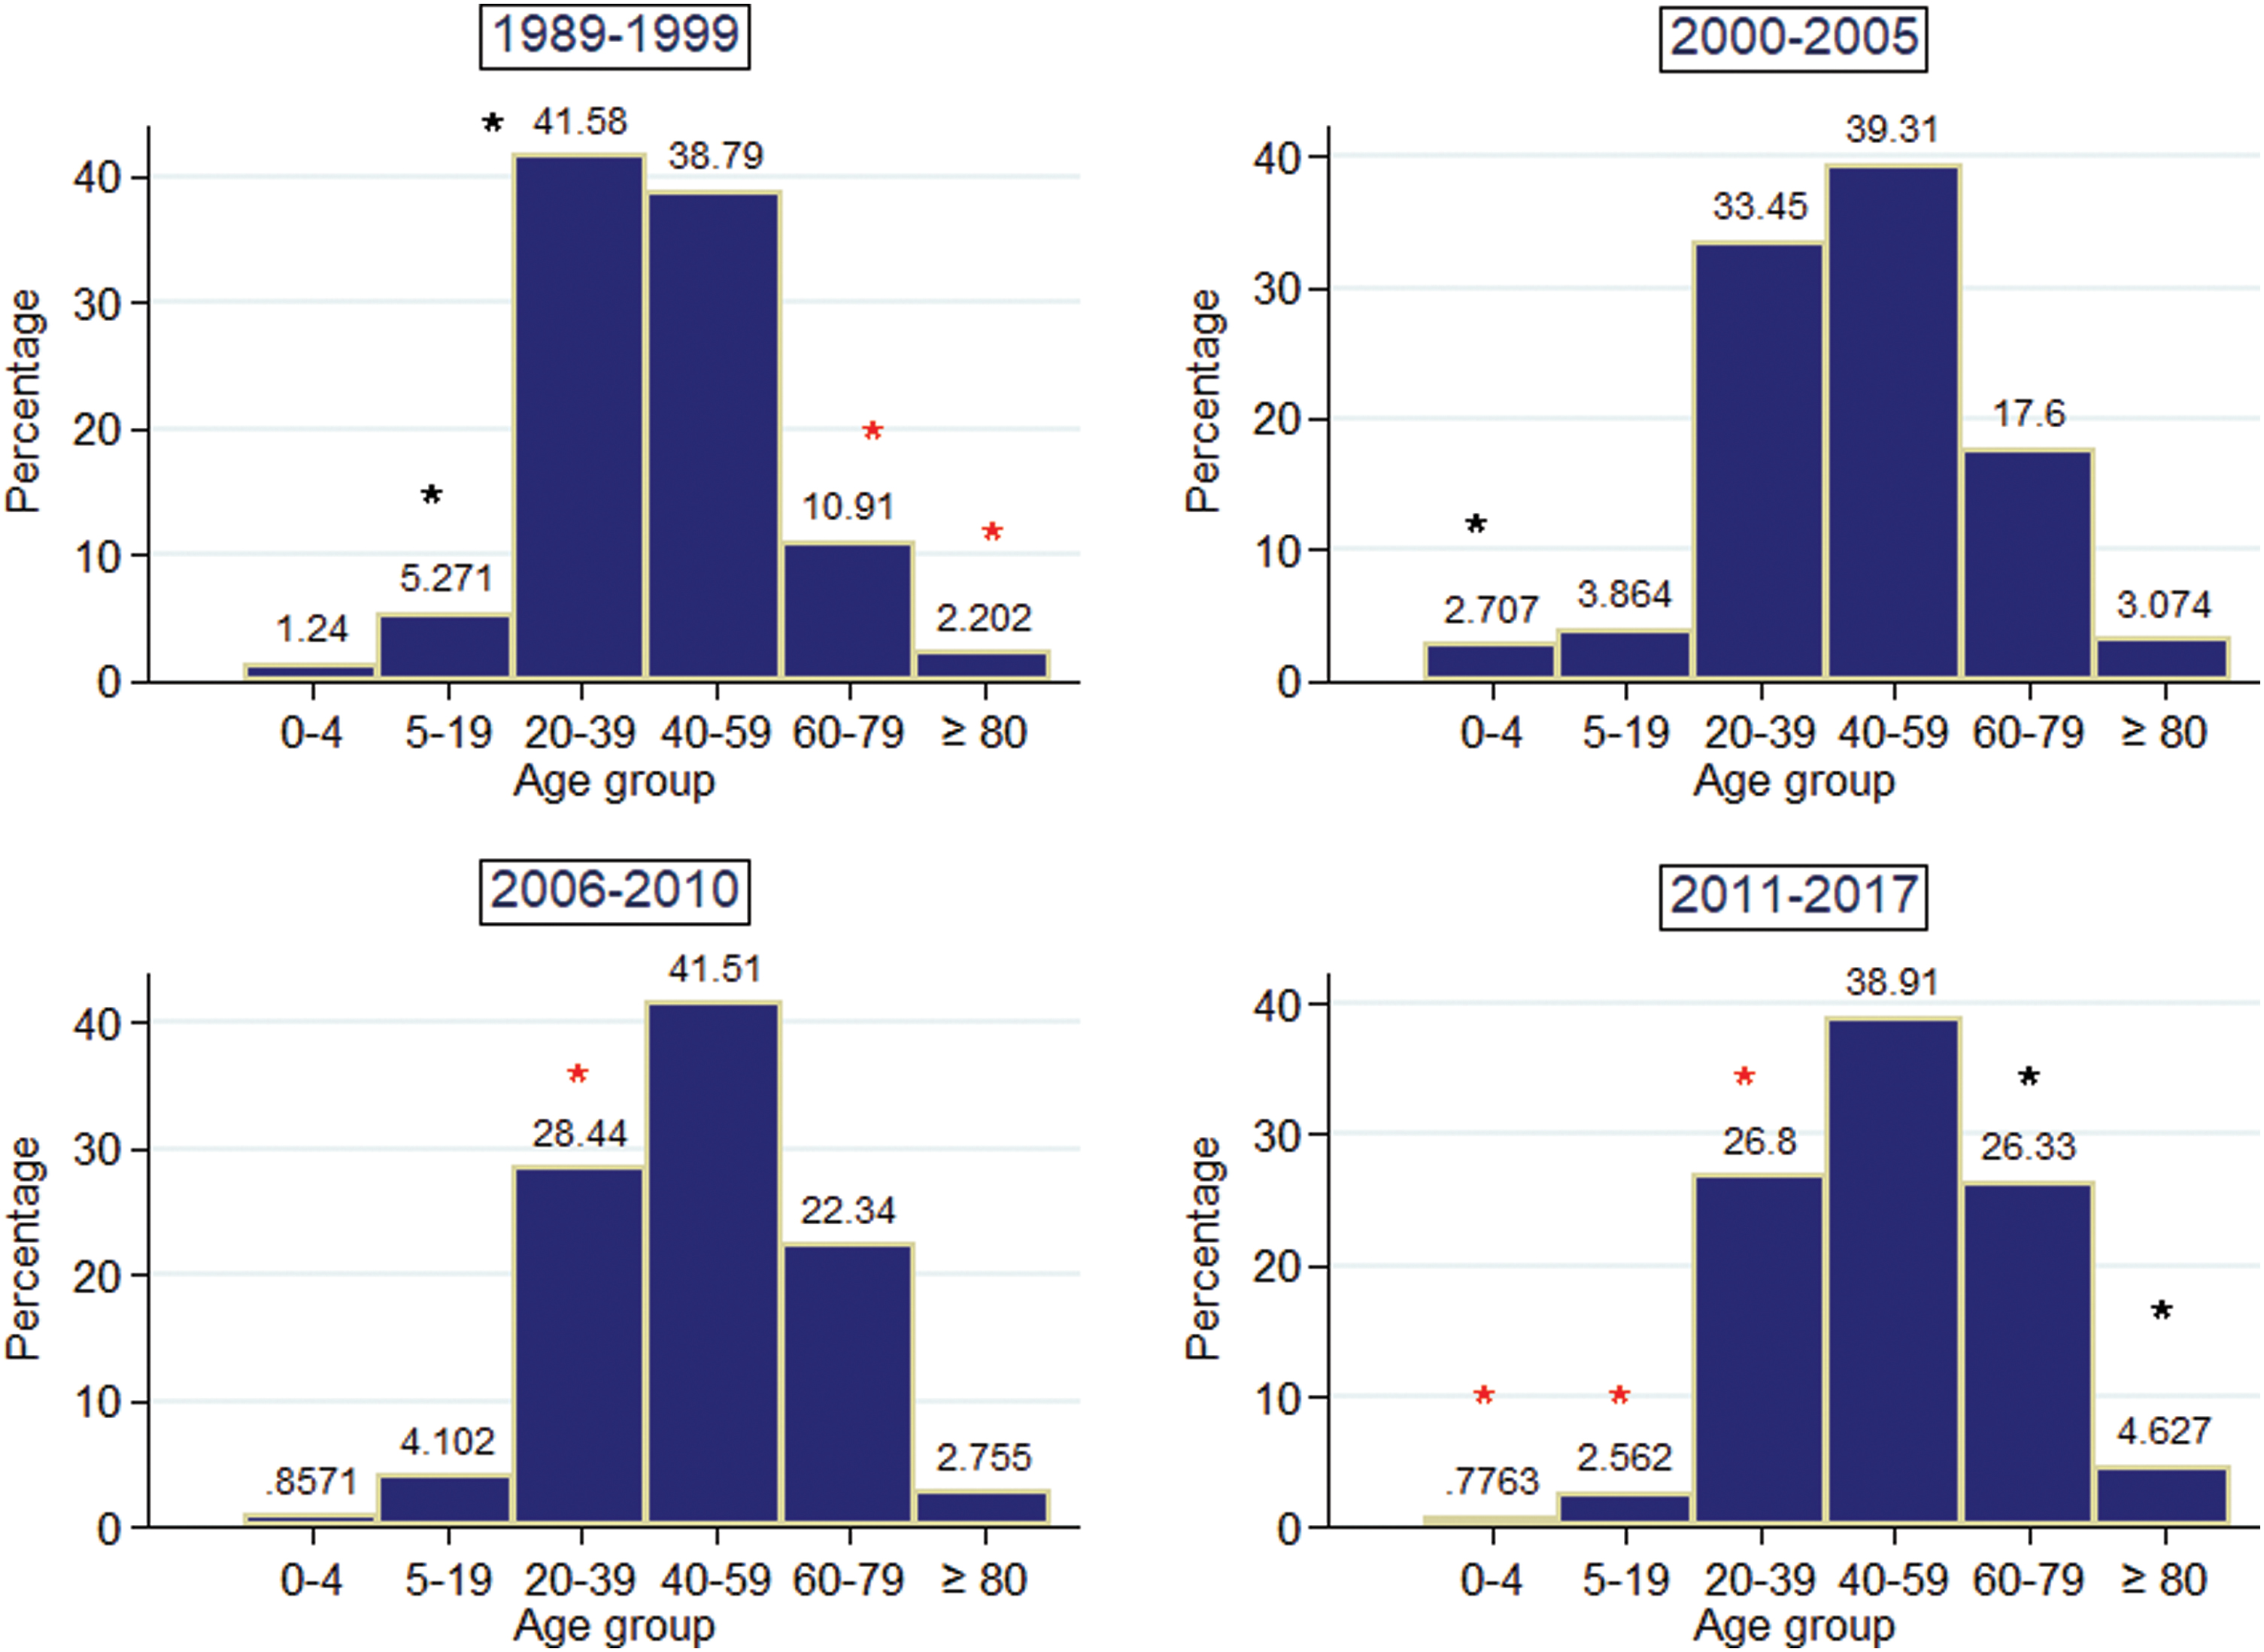
Frequency distribution of age intervals of reported cases of Chagas disease in Chile in different time periods. Black asterisks indicate observed values higher than those expected, and red asterisks indicate observed values lower than those expected, significant at α = 0.05 in post hoc χ2 test. Color images are available online.
Mean Age and Standard Deviation of Reported Cases of Chagas Disease in Chile by Sex and Year Periods
Men/women differences (t = 9.4, p < 0.05).
The reported cases per 105 inhabitants by period were not different (F 2,739 = 0.48, p = 0.75), but the interaction between 5-year periods and regions was different (F 31,739 = 2.80, p < 0.001), indicating that not all regions changed their reported cases in a similar way. In the planned contrasts an increase of reported cases was detected in the period after the certification of interruption of vector-borne transmission of Chagas disease (F 1,327 = 4.24, p < 0.04). Differences among the regions (F 14,1308 = 4.35, p < 0.001) were also found. While Arica y Parinacota, Atacama, Coquimbo, and Valparaiso regions increased the number of reported cases, this number decreased in Antofagasta, and the rest of the regions maintained the number of cases. Differences between Q1 and all other periods were found in Tukey's post hoc comparisons. Q1 had the lowest rate of reported cases (p < 0.001 in all cases), whereas Q2 and Q5 had the highest rates (Table 2). The reported cases per 105 inhabitants before and after the certification of interruption of vector-borne transmission of Chagas disease are indicated in maps showing zones with the relative risk of Chagas disease outside of the distribution area of sylvatic and domestic vectors in the postinterruption period (Fig. 2).

Left. Maps of annual notified cases/105 habitants of Chagas disease in Chile in periods before
Average Reported Cases per 105 Inhabitants per Year of Chagas Disease in Chile by Administrative Regions by Five-Year Periods (Q1–Q5), by Pre- and Postcertification of Interruption of Vector-Borne Transmission (Preint. and Postint., Respectively) and Over All the Analyzed Period (Total)
Regions are listed from North to South: AYP, Arica y Parinacota; T, Tarapacá, A, Antofagasta; AT, Atacama; C, Coquimbo; V, Valparaíso; M, Metropolitana; O, O'Higgins; MA, Maule; BB, Bío Bío; AR, La Araucanía; LR, Los Ríos; LL, Los Lagos; AY, Aysén; MG, Magallanes. Different letters in parentheses indicate differences in Tukey's a posteriori comparisons at α = 0.05. The symbols α and β indicate differences in planned contrasts between Preint. and Postint. periods.
The regions of the north-central area that have the highest burden of Chagas tended to decrease the relative risk, while the regions of the south tended to increase it (Fig. 3) with small risk areas appearing in zones where there are no insect vectors. However this effect was not homogeneous, with some northern regions such as Tarapacá and Valparaiso increasing their relative risk.
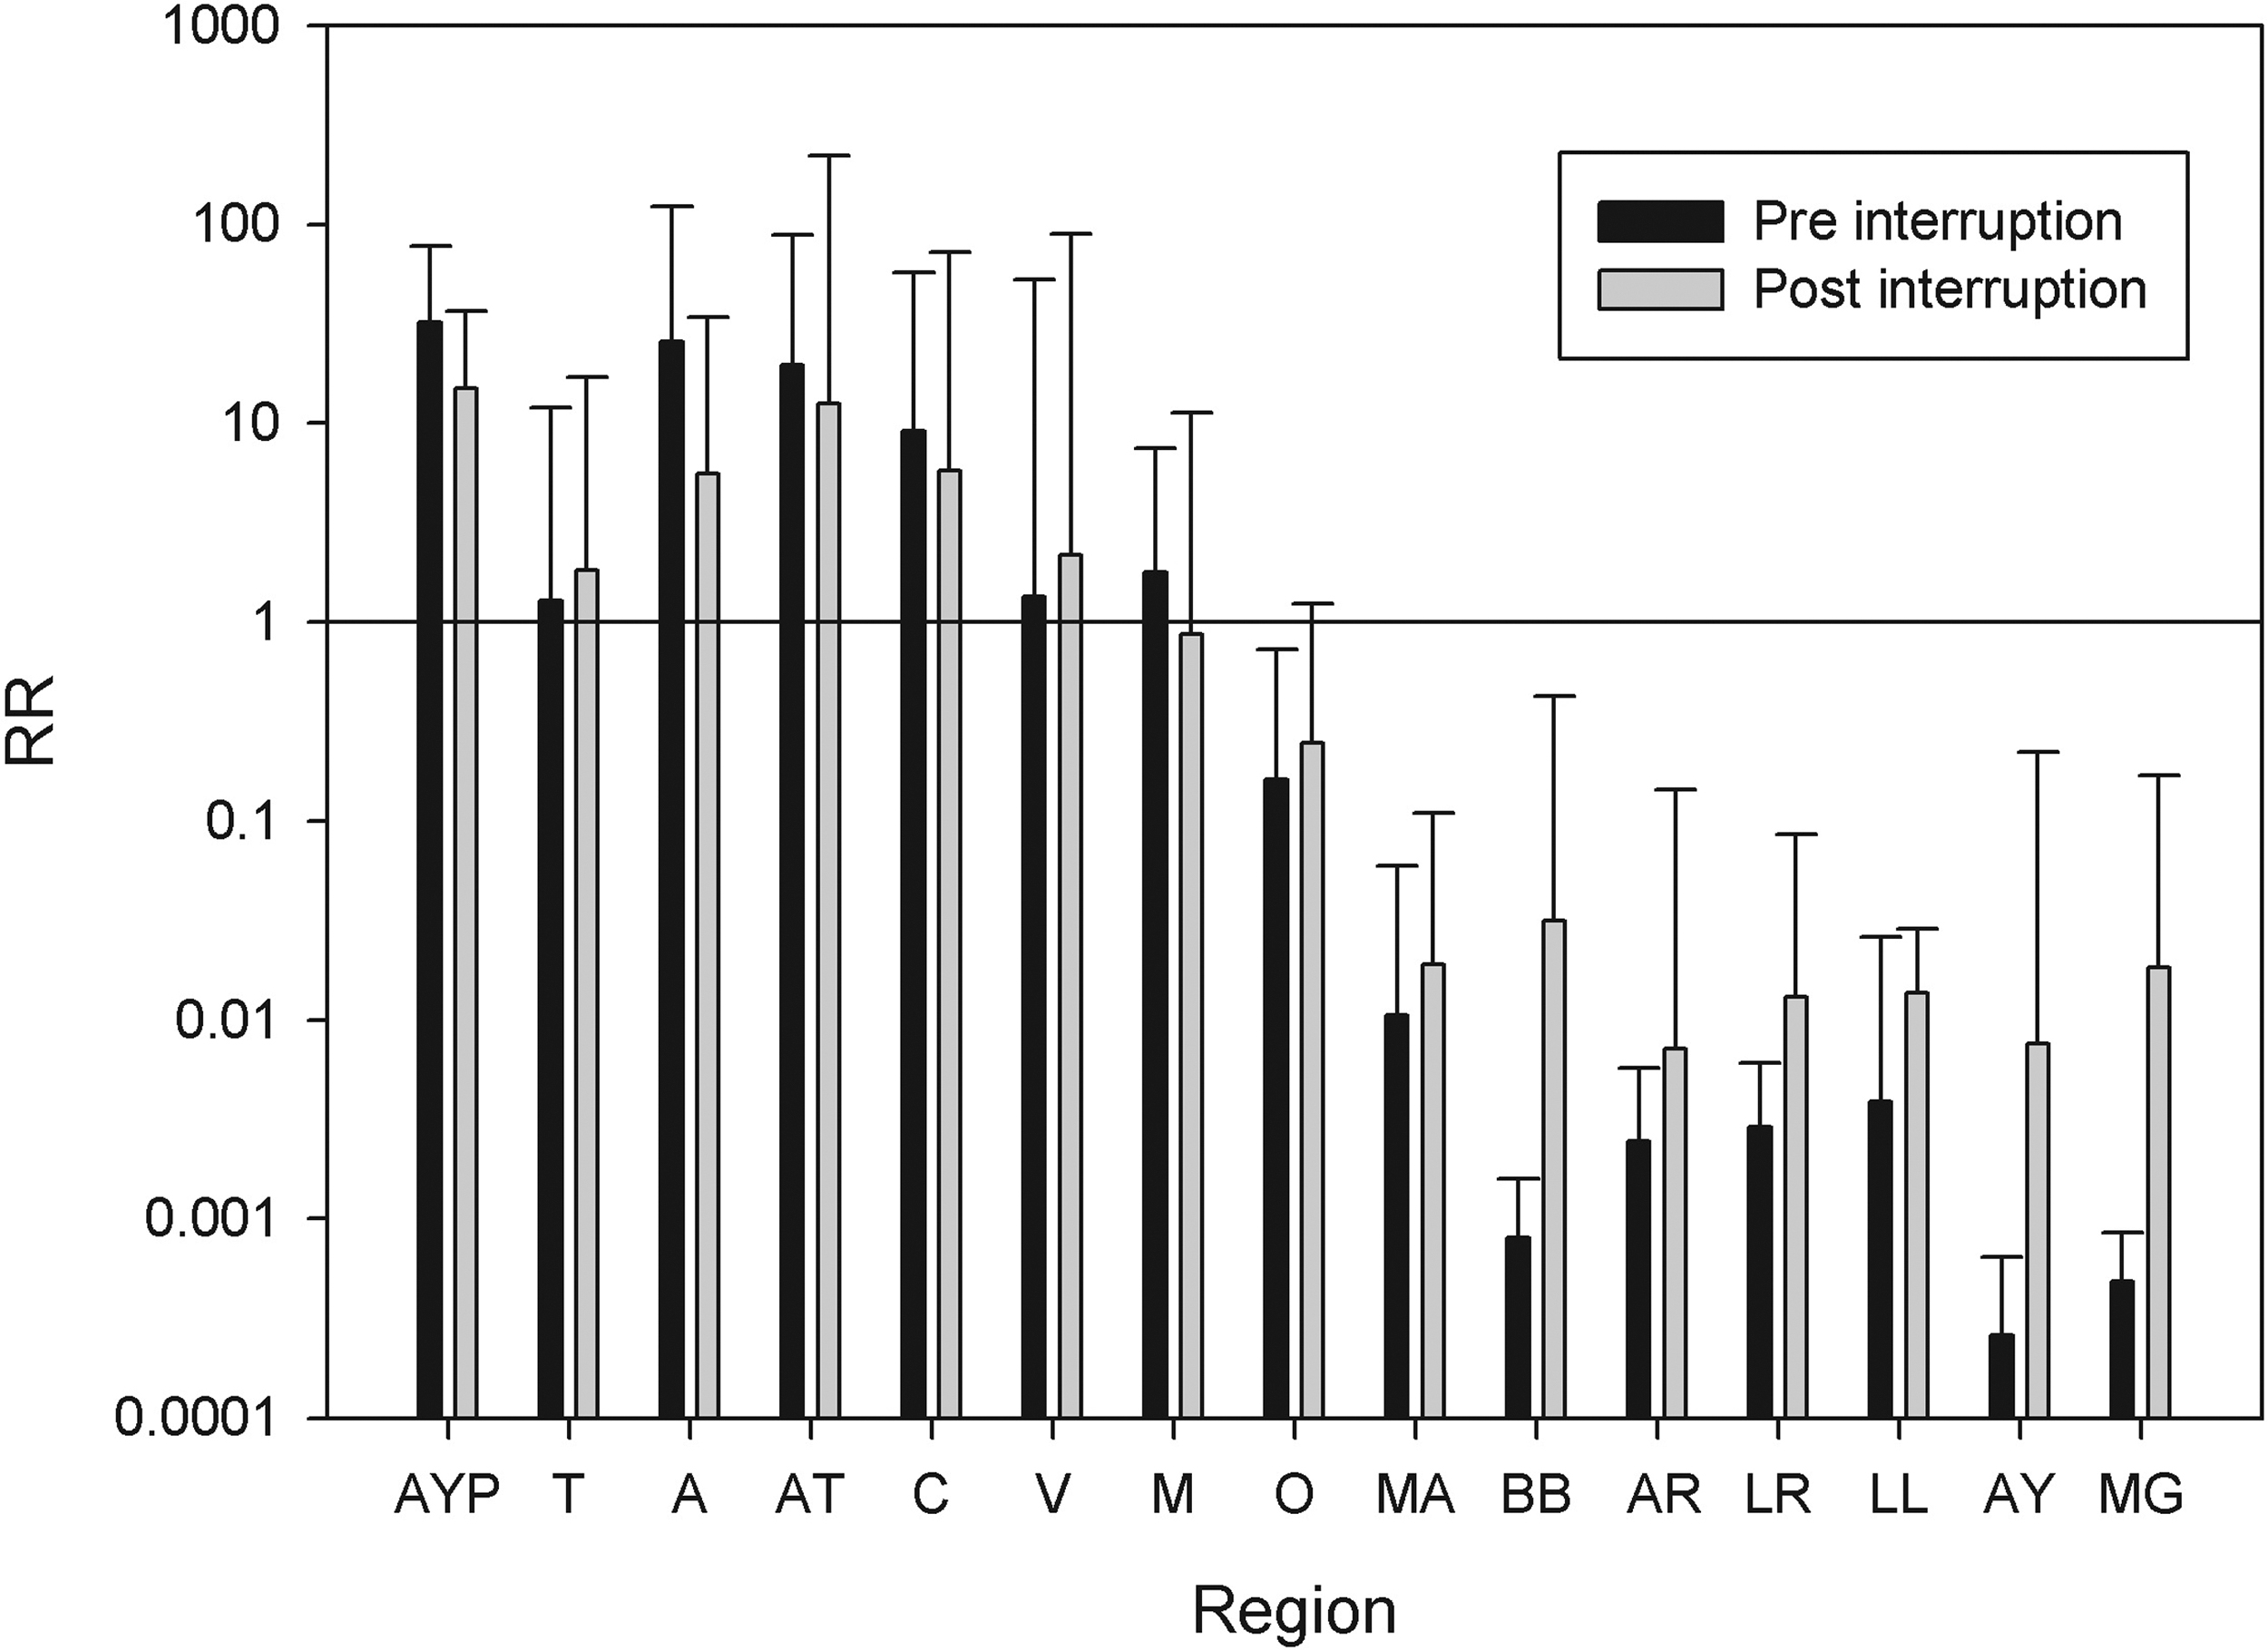
Distribution of the relative risk of Chagas disease in Chile in periods before (RRpre) and after (RRpost) the certification of interruption of the domestic vector-borne transmission of Trypanosoma cruzi, from northern (AYP) to southern administrative regions (MG).
Discussion
The average age of reported cases of Chagas disease in Chile has been increasing. This increase can be explained in part by the increase in life expectancy at birth of the Chilean population, which in the period from 1990 to 2017 increased from 75.6 years in women and 68.9 years in men to 82.1 years and 77.3 years, representing increases of 8.6% and 12.2%, respectively (INE 2020). The increases in the average age of the reported cases of Chagas disease were 15.5% in women and 27.7% in men. The proportion of individuals in the age group 0–4 years showed a reduction in the period 2011–2017 (Q5). The proportion of cases reported in children <5 years in the preinterruption period was 1.24% and 0.78% in 2017 (37% reduction). This stratum is used as an indicator of interruption of the vector transmission of the disease. However, the Chilean population has aged in recent times, decreasing the proportion of individuals in this stratum by ∼34%; so that the observed reduction in the proportion of individuals in the lower strata could be explained in part by a decrease in the offer of human hosts. However, the seroprevalence for T. cruzi in children <5 years decreased from 5.4% in 1982 to 1.12% in 1994, 0.4% in 1999 (Lorca et al. 2001) and 0.47% between 2005 and 2015 (n = 7068) (MINSAL 2016). The last values <2% are considered as one of the base indicators for interruption of vector transmission (Salvatella et al. 2014). The sexual differences in the reporting age are probably explained by a greater cultural reluctance of men in Chile to consult and take tests.
The distribution of Chagas disease was mainly restricted to the northern zone of Chile between the Arica and Parinacota region (18°30′S) and the O'Higgins region (34°36′S), which coincides with the potential niche of the domestic vector T. infestans and with the risk maps estimated from mapping the basic reproductive number of the disease (Tapia-Garay et al. 2018; Ayala et al. 2019).
The reported cases show heterogeneous changes, increasing in some regions and decreasing in others, without a change attributable to the certification of the interruption in the vector-borne transmission. There may be a change attributable to the improvement in the surveillance that occurred in 2008; there has been progressive improvement in the notification, attributable to better preparation of personnel and a better notification system. Recently the cases reported correspond mainly to asymptomatic individuals with positive serology for Chagas disease (MINSAL 2014). Reported cases probably do not represent what happens at a given moment, because the time between infection and reporting is unknown and Chagas disease can be asymptomatic for years. However, our study involved 28 years, and we expected differences to be detected among 5-year periods; for example, the comparison between Q1 and Q5 represents the changes in reported cases in 22 years (on average), which makes them unlikely to be cases that had not been captured (under-recording) in the previous periods. A limitation is that the number of cases detected by T. cruzi screening may have been affected over time by changes in public policies that have occurred since 2008 throughout the national territory (MINSAL 2014). The improvement in the reporting system may affect mainly the absolute reported cases but not the relative risk, which depends on the distribution of the cases within a period. In addition, there is under-reporting of Chagas disease that has not been estimated. We expected these factors to be distributed randomly over all the geographic area, buffering spatially induced biases. However some areas may have better surveillance than others, which is a possible limitation of this study. Despite these problems, the temporal and spatial variation in the number of reported cases is a proxy of the variation in the risk of incident Chagas.
Another factor that could explain the increase in the number of cases in some areas is that vector transmission has not been interrupted, and that there is domestic transmission. Although T. infestans maintains trypano-triatomine index ∼42%, home infestation is <0.05% (Canals et al. 2017). However, in Chile wild foci of this species have been detected (Bacigalupo et al. 2010). M. spinolai has trypano-triatomine index of 21%, and human blood constitutes ∼10% of its diet (Canals et al. 2001), and recently this species has been reported in human dwellings, mainly in adult males (Frías-Lasserre et al. 2017), so it may play an important role in the transmission of Chagas disease. Although the other Mepraia species are also vectors of Chagas, they have a more restricted and coastal distribution so their participation is improbable.
Relative risk represents the cases above those expected in a locality by population size in the period. Thus variation in relative risk between periods in one locality represents variation in the relative participation in the reported Chagas burden of this locality, reflecting changes in the distribution of the risk. We found a tendency to reduce risk in the area with greater burden of Chagas and also an emergence of relative risk foci in areas where the vector is not found. The overall reduction of the risk in the northern regions was not homogeneous, with two regions increasing the relative risk.
An area of greater relative risk in the Los Angeles commune in the Bio-Bio region is evident. This may be explained by internal migrations of infected people from endemic areas to areas where there are no vectors. Chile has intense internal migration by Latin American and even by world standards (20% among regions), probably due to a greater propensity to migrate in the framework of an accelerated process of urbanization, rural transformation, and economic and social change. The Metropolitan region has changed from an attractive region to a repulsive one, and the southern regions show strong immigration (Rodriguez 2019). The presence of patients with Chagas disease in areas where there are no vectors could turn these regions into risk areas of congenital transmission, as long as there are infected people of reproductive age.
Another explanation for distribution changes could be southward migration of vectors; however in Chile, the southern limit of the distribution of vectors is the O'Higgins region (34°36′S), with no change of this limit in >60 years and with latitudinal change (Tapia-Garay et al. 2018). The northern sylvatic vector M. gajardoi is distributed from Arica and Parinacota (18°S) to Copiapó (25°S) and M. parapatrica is only found in Copiapó. Both species are found in coastal areas, and are associated mainly with small rodents, some birds and reptiles, and some coastal low-density human populations. However, M. spinolai is distributed from Copiapó to the O'Higgins region (33°S), coinciding approximately with the southern distribution limit of T. infestans. Changes in risk distribution attributable to these vectors are improbable because the models used to predict the change in the distribution of the vectors under climate change do not suggest migration to the south of the O'Higgins region (Canals et al. 1993, 1999, Tapia-Garay et al. 2018, Ayala et al. 2019, Garrido et al. 2019).
Blood transfusion was in the past an important way of transmission in Latin America, and transfusion transmission by infected migrants from rural to urban areas shaped the disease distribution (Moraes-Souza and Bordin 1996, Schmunis 1999). This factor might be relevant only in the period preinterruption of the vectorial transmission of Chagas because blood transmission of T. cruzi was interrupted in 1997 in Chile (Hontebeyrie et al. 2010). Also, the seroprevalence of T. cruzi in blood donors is low in Chile; 0.5% (2000), 1.6% (2005), and 0.4% in 2008 (Apt et al. 2008). The influence of congenital Chagas in our results of risk distribution is probably low because the rate of congenital infection had been estimated between 2.5% and 4.7% (Apt et al. 2013, Howard et al. 2014), and the proportion of people <5 years old in our sample is <5.4%.
In summary, there is still no numerical evidence of a reduction in reported cases of Chagas disease in Chile. Despite a reduction in the proportion of infected children there are only small changes in the percentage of Chagas-infected people <5 years old. A change in the distribution of relative risk is evident, with a small but not homogeneous reduction in the relative risk in the endemic zone. The appearance of zones with unusual risk of Chagas disease in southern Chile could be explained by internal human migration of Chagas-infected people.
Footnotes
Authors' Contributions
M.C. and A.C. conceived the study. M.C., A.C., S.Ay., and D.C. designed the study; J.B., M.C., A.C., and
Acknowledgments
We thank Lafayette Eaton for language review and critical and editorial review of the draft.
Ethical Approval
The research was approved by the ethics committee of the Faculty of Medicine of Universidad de Chile (CBA 0742).
Author Disclosure Statement
The authors declare that they have no conflicts of interest with the contents of this article.
Funding Information
This study was supported by Regular Fondecyt Project 1150514 (MCL).
Supplementary Material
Supplementary Data
References
Supplementary Material
Please find the following supplemental material available below.
For Open Access articles published under a Creative Commons License, all supplemental material carries the same license as the article it is associated with.
For non-Open Access articles published, all supplemental material carries a non-exclusive license, and permission requests for re-use of supplemental material or any part of supplemental material shall be sent directly to the copyright owner as specified in the copyright notice associated with the article.