




Abstract
Background:
The life cycles of zoonotic and vector-borne diseases can be complex. This complexity makes it challenging to identify factors that confound the association between an exposure of interest and infection in one of the susceptible hosts. In epidemiology, directed acyclic graphs (DAGs) can be used to visualize the relationships between exposures and outcomes and also to identify which factors confound the association between exposure and the outcome of interest. However, DAGs can only be used in situations where no cycle exists in the causal relationships being represented. This is problematic for infectious agents that cycle between hosts. Zoonoses and vector-borne diseases pose additional challenges with DAG construction since multiple required or optional hosts of different species may be part of the cycle.
Methods:
We review the existing examples of DAGs created for nonzoonotic infectious agents. We then demonstrate how to cut the transmission cycle to create DAGs where infection of a specific host species is the outcome of interest. We adapt our method to create DAGs using examples of transmission and host characteristics common to many zoonotic and vector-borne infectious agents.
Results:
We demonstrate our method using the transmission cycle of West Nile virus to create a simple transmission DAG that lacks a cycle.
Conclusions:
Using our work, investigators can create DAGs to help identify confounders of the relationships between modifiable risk factors and infection. Ultimately, a better understanding and control of confounding in measuring the impact of such risk factors can be used to inform health policy, guide public health and animal health interventions, and uncover gaps needing further research attention.
Introduction
Observational studies are useful for identifying modifiable risk factors for zoonotic infections that could be acted upon to reduce their spread. However, observational studies include the challenge of determining whether any observed associations are true effects or the result of unknown or unmeasured third variables, known as confounders (Hammer et al, 2009). When confounding is present, the study should be designed to measure such confounders to obtain an adjusted estimate of the effect of the predictor on infection and/or to identify which unmeasured confounders should be accounted for in the analyses (Shahn, 2017; VanderWeele and Ding, 2017). Thus, identifying confounders to measure during the planning phase of the study is one of the keys of good study design.
Directed acyclic graphs (DAGs) are tools that were originally developed in computer sciences (Greenland et al, 1999). They have since been adapted by epidemiologists to identify confounders in observational studies [see Shrier and Platt (2008) for an overview]. These causal DAGs qualitatively show causation by connecting putative causes and effects (shown in the figures as nodes) with unidirectional arrows (arcs) pointing from the cause node to the effect node (Greenland et al, 1999). These networks help investigators to control for confounding, while avoiding overadjustment and collider-stratification bias (a form of selection bias), when designing studies or analyzing data (Schisterman et al, 2009).
Investigators can use specific rules to identify confounders in a DAG [see Greenland et al (1999) for further explanation]. Most infectious agents cycle between living hosts to replicate (Hubalek, 2003), making it impossible to construct DAGs directly from a transmission cycle since the acyclic aspect of the DAG would be violated.
In noncommunicable disease fields of study, investigators have managed cyclic variables by splitting them into two nodes set at different times (Howards et al, 2007, Robins et al, 2000, Staplin et al, 2017). This approach has rarely been used in infectious disease cases and never before in zoonotic and vector-borne infectious agents where interspecies transmission is a concern. DAGs in infectious disease epidemiology have focused on communicable nonzoonotic diseases; examples include demonstrating the theory of determining causation in social networks (Ogburn et al, 2020), visualizing conditional dependencies between related diseases (HIV, tuberculosis, and hepatitis B) (Twumasi et al, 2019), and finding predictors to guide treatment for COVID-19 (Fowler et al, 2020).
A commonality of the above studies is that they do not consider infection as the outcome of interest or they consider infection in very specific high-risk settings. The few studies that have explored infection as an outcome include identifying potential confounders for complex infection syndromes without a specific communicable infectious agent (e.g., bovine respiratory disease) (Hay et al, 2014), finding new symptomatic cases of a communicable disease with only one required host (e.g., human pulmonary tuberculosis) (Arnedo-Pena et al, 2019), or mapping transmission of an HIV infectious agent from one partner to another within a couple (Cassels et al, 2014). It is difficult to extrapolate from these studies alone how to split a transmission cycle to create a DAG when considering complex cycles of infectious agents with multiple optional or required hosts.
The goal of this article is to demonstrate how time-specific nodes can be applied to the development and use of DAGs for zoonotic and vector-borne infectious agents with complicated multihost cycles. This can be done by simplifying the different infectious stages involved in their transmission. We demonstrate this approach by developing simplified DAGs for multiple theoretical infectious agents, followed by a simplified DAG of the transmission cycle for West Nile virus (WNV), a zoonotic vector-borne virus. In doing this, we demonstrate how our method can be generalized for use with any other zoonotic or vector-borne agent.
Materials and Methods
No institutional IRB or IACUC approval for this study was sought as our work did not use human or animal data.
DAG terminology
We use the following definitions in our work, adapted from the study by Greenland et al (1999). Each of these is visually demonstrated in Fig. 1.
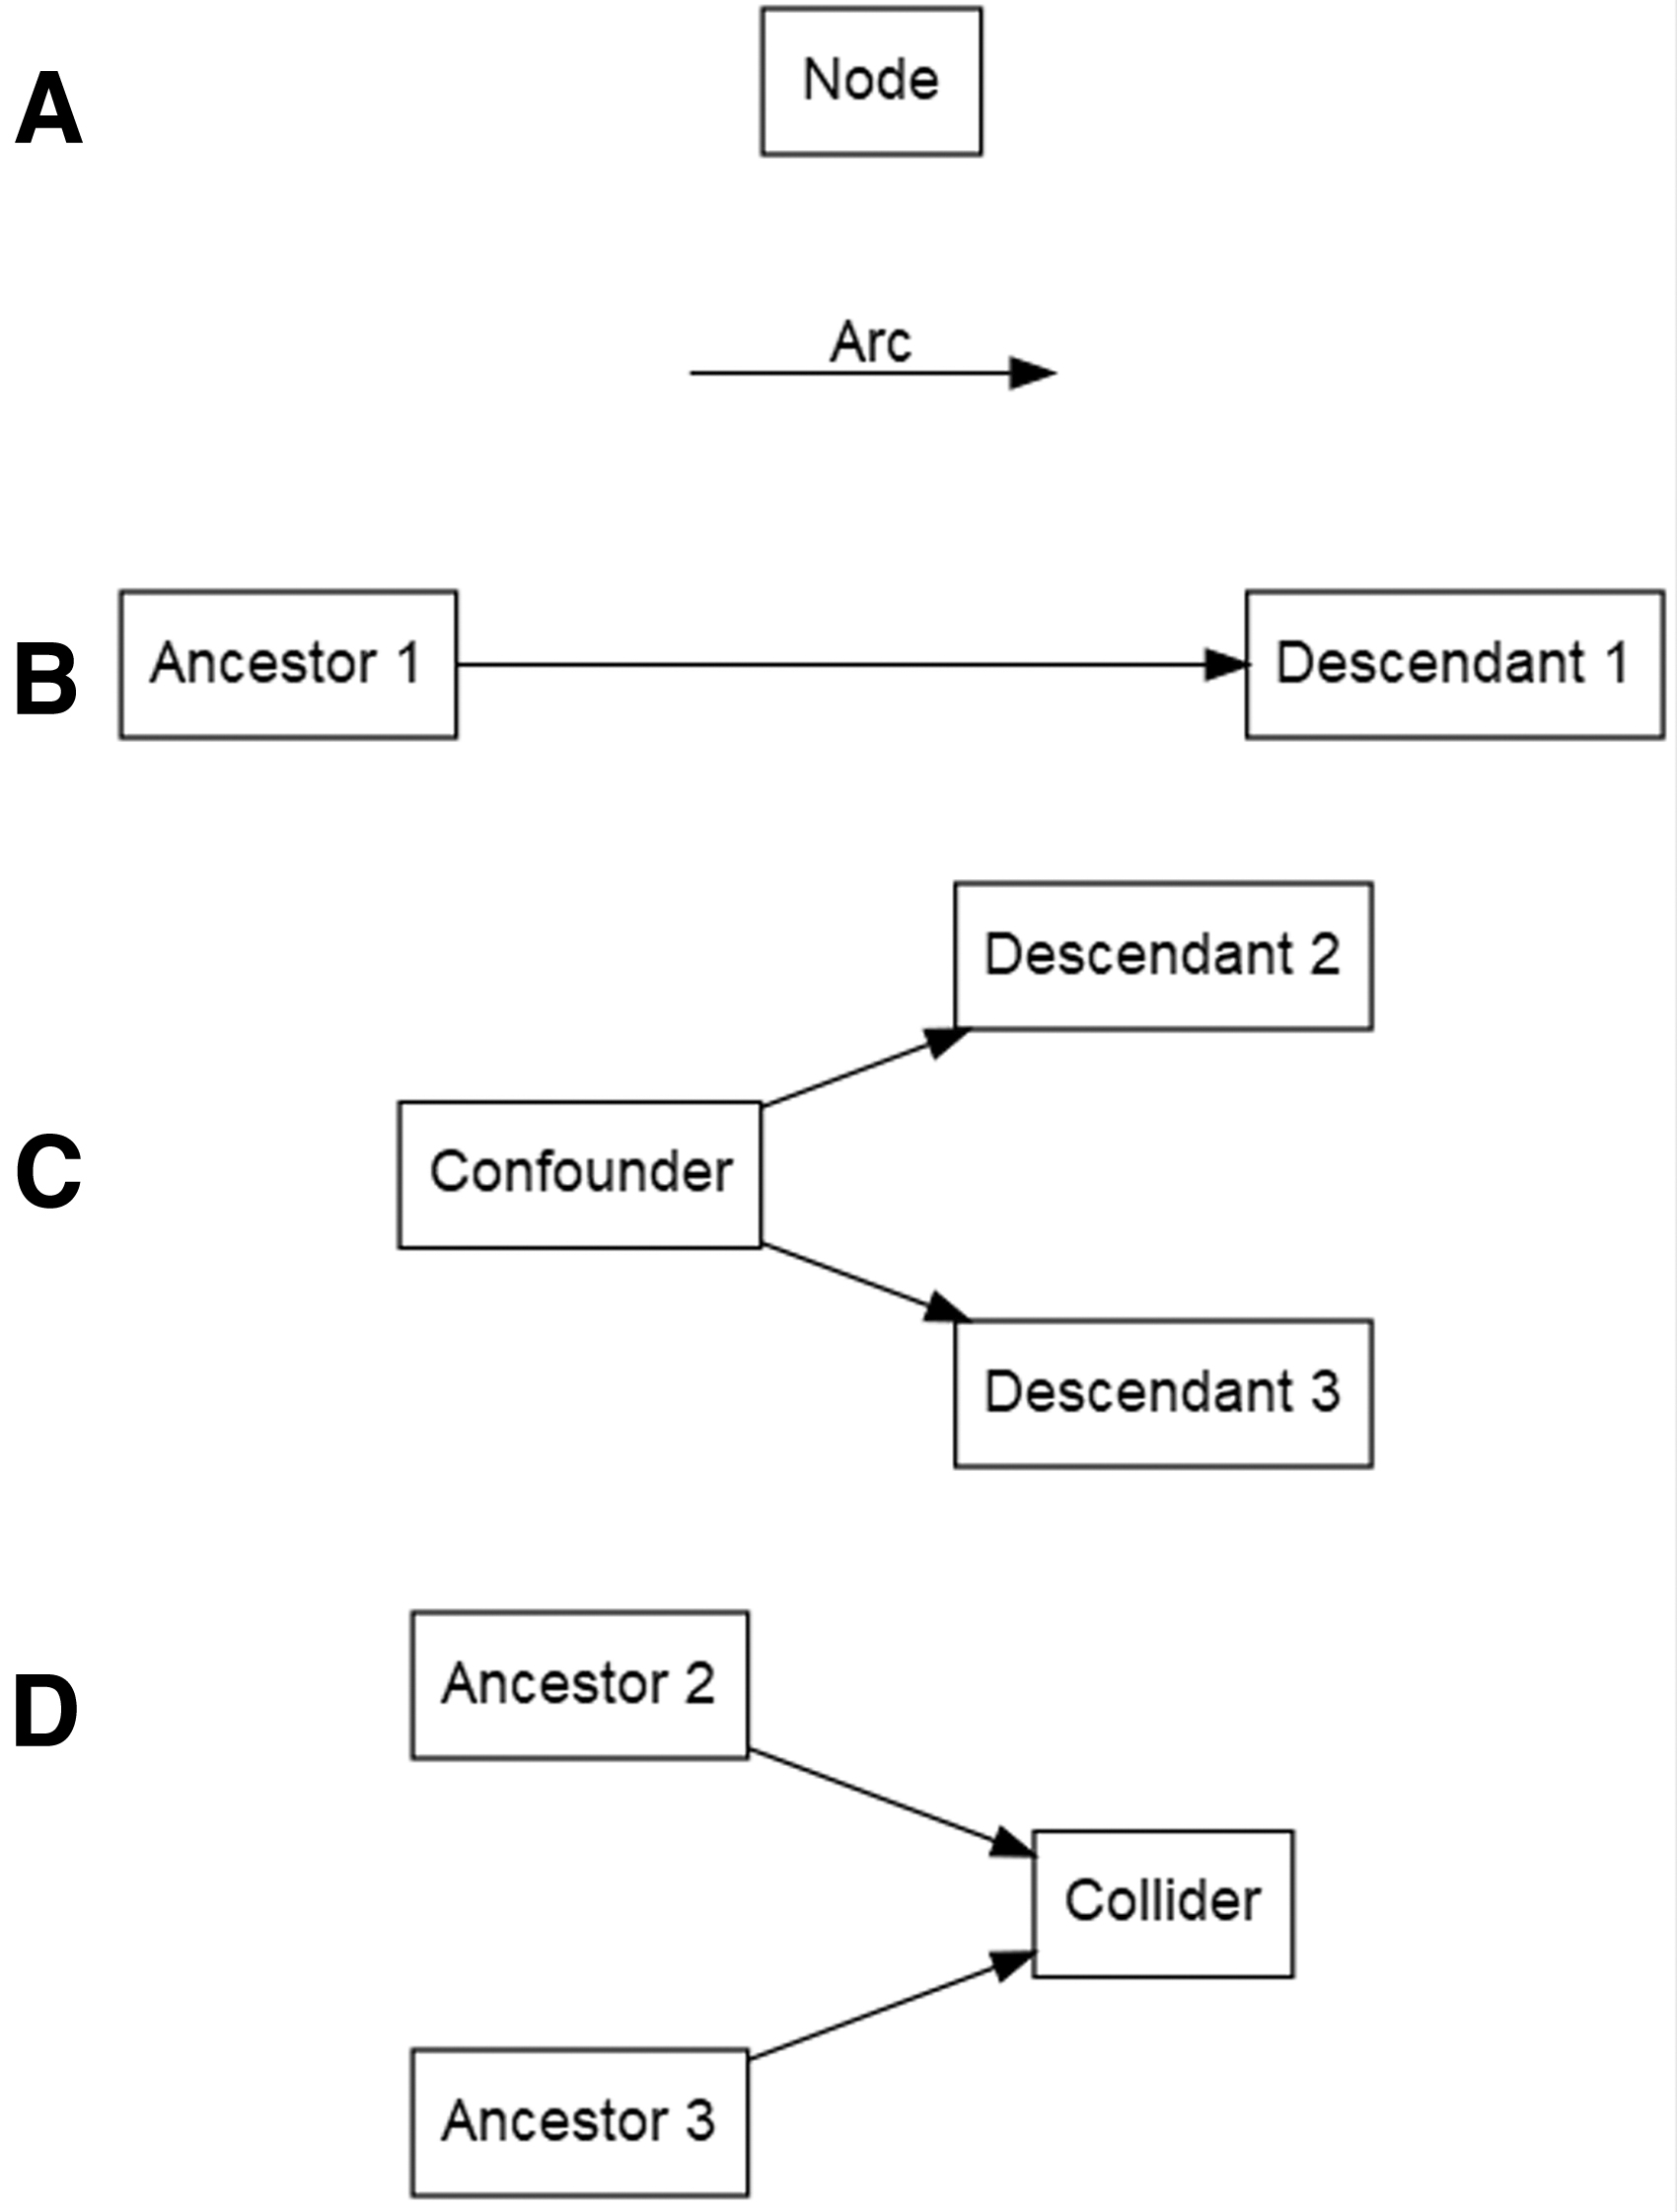
Sample DAG components, including nodes, arcs, ancestors, descendants, and colliders. (
Node
A node represents a shape that represents a variable in a population.
Ancestor
An ancestor represents a node that is a cause of another node. Direct ancestors are unmediated causes of another node. Indirect ancestors have at least one node between them and the effect of interest.
Descendant
A descendant represents a node that is the effect of another node. Direct descendants are caused by another node by an unmediated mechanism. Indirect descendants have at least one node between them and the cause of interest.
Arc
An arc represents a unidirectional arrow that points from a node to its direct descendant. Arcs show the direction between a cause and its effect.
Causal path
The causal path represents a series of arcs (and nodes along the arcs) that lie between two nodes, following the direction of the arc(s). The causal path may consist of a single arc or may involve multiple nodes with several arcs connecting them.
Backdoor path (relative to exposure)
The backdoor path represents a series of arcs (and nodes along the arcs) that lie between two nodes, with a path leading into the node representing the exposure. Backdoor paths between an exposure of interest and the outcome indicate a path for confounding to occur.
Confounder
A confounder represents a node that is an ancestor of two descendants of interest (exposure and outcome). Confounders can only be defined relative to the descendants of interest; the same node may be a confounder of one exposure–outcome relationship, but not a confounder of a different exposure–outcome relationship in the same DAG.
Collider
A collider represents a node that is a descendant of two immediate ancestors (i.e., a node with two arcs pointing toward it). Potential causal and backdoor paths between two nodes are blocked if they pass through the collider and thus do not represent possible confounding paths. Colliders need to be identified because adjusting for them alone induces selection bias [for further discussion of collider bias, see Cole et al (2010)].
Breaking the transmission cycle
Every nonopportunistic infectious agent can be considered to have at least one time point when it resides within a host and at least one time point when it infects a new host (at its simplest). Since each of these time points causes the other, it can be visually represented as a life cycle (herein called a transmission cycle since the same principle applies to nonliving infectious agents such as viruses).
Transmission cycles appear visually similar to DAGs, but are cyclic (Fig. 2). When a node exists at two different time points, the standard practice is to split the node into two separate nodes at different time points (Pazzagli et al, 2018). We demonstrate this approach with a simple, hypothetical infectious organism in Fig. 2. For a published example of this type of DAG that illustrates transmission of HIV in a very limited population of stable couples, see Cassels et al (2014).
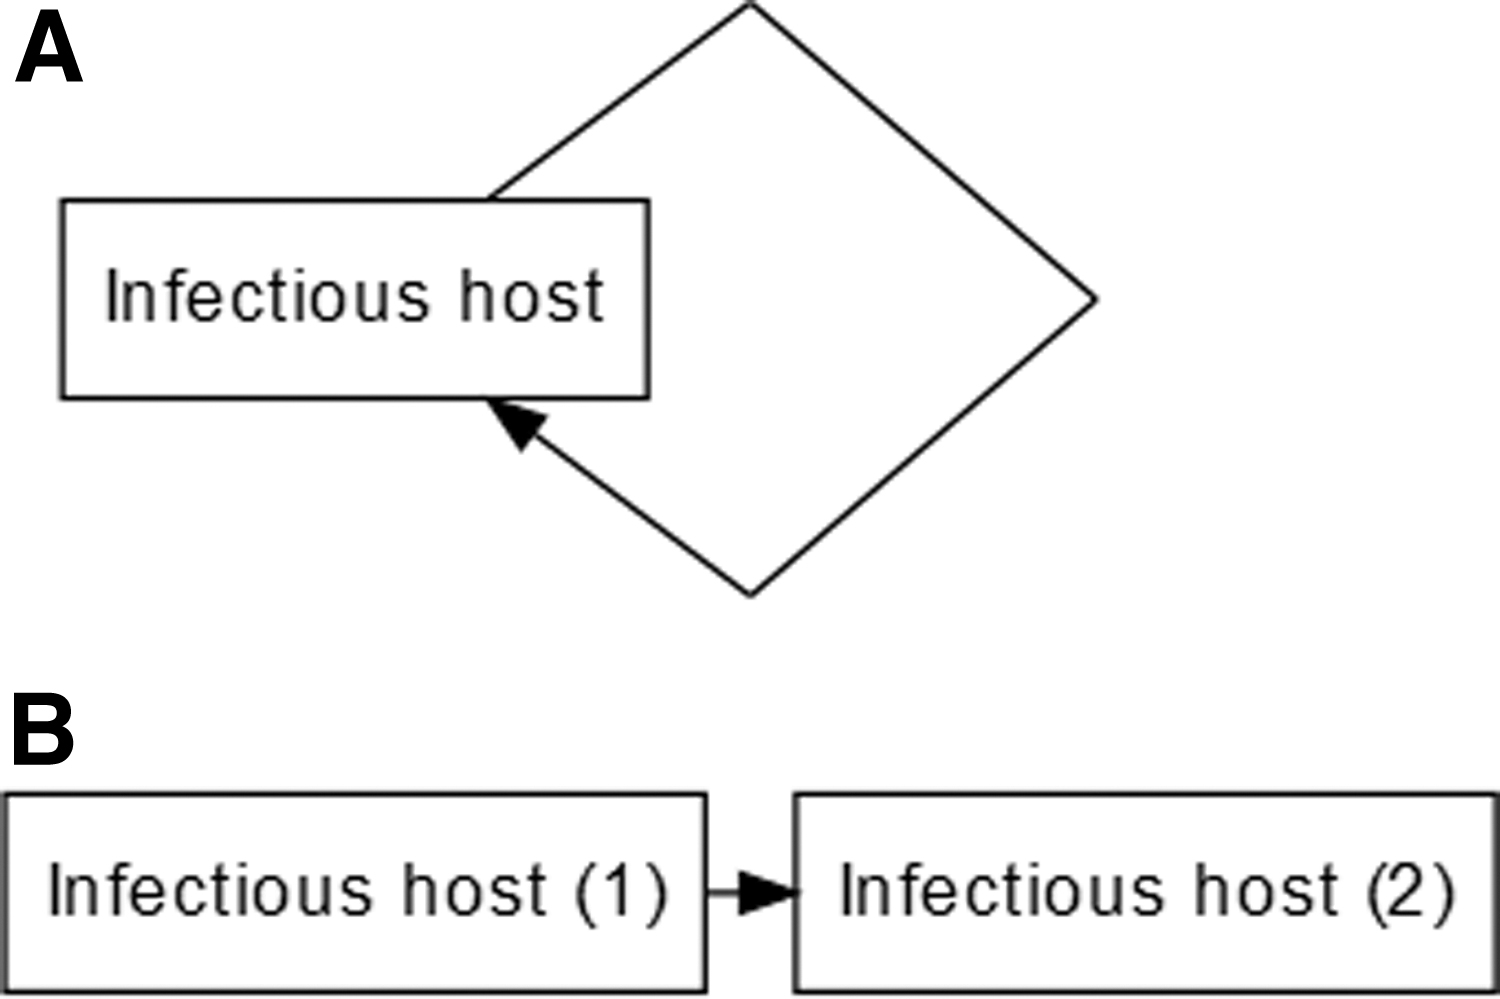
A simple transmission cycle (
Splitting complex transmission cycles
The goal of causal DAGs in epidemiology is to visually show all relevant causal relationships between an exposure of interest and an outcome along with backdoor paths that may be confounders (Greenland et al, 1999). We accomplish this with transmission DAGs by placing one node (e.g., infectious host) at two separate instances, splitting the node by time [e.g., infectious host (1) and infectious host (2) Fig. 2].
The following examples demonstrate how to split transmission cycles for infectious agents with multiple optional or required hosts, as is the case with zoonotic and vector-borne diseases.
Infectious agent with multiple hosts required for completion of its transmission cycle
Multiple places exist where the transmission cycle could be split. However, not every possible split creates a DAG that adequately shows causes of infection. It is important to split on the host that contains the outcome of interest, as splitting at a different node may create a DAG that does not appropriately identify causes of the outcome of interest (see Supplementary Data for more details).
The first step is to determine which species is the infectious host of interest (the outcome of the DAG). The transmission cycle should begin with a node for that infectious host of interest of that species at a generic time when the disease is endemic in the population of interest (the first instance). The cycle should follow through transmission to all other necessary species for one cycle and end with the initial infectious hosts of the species with the outcome of interest at a second instance (Fig. 3B).
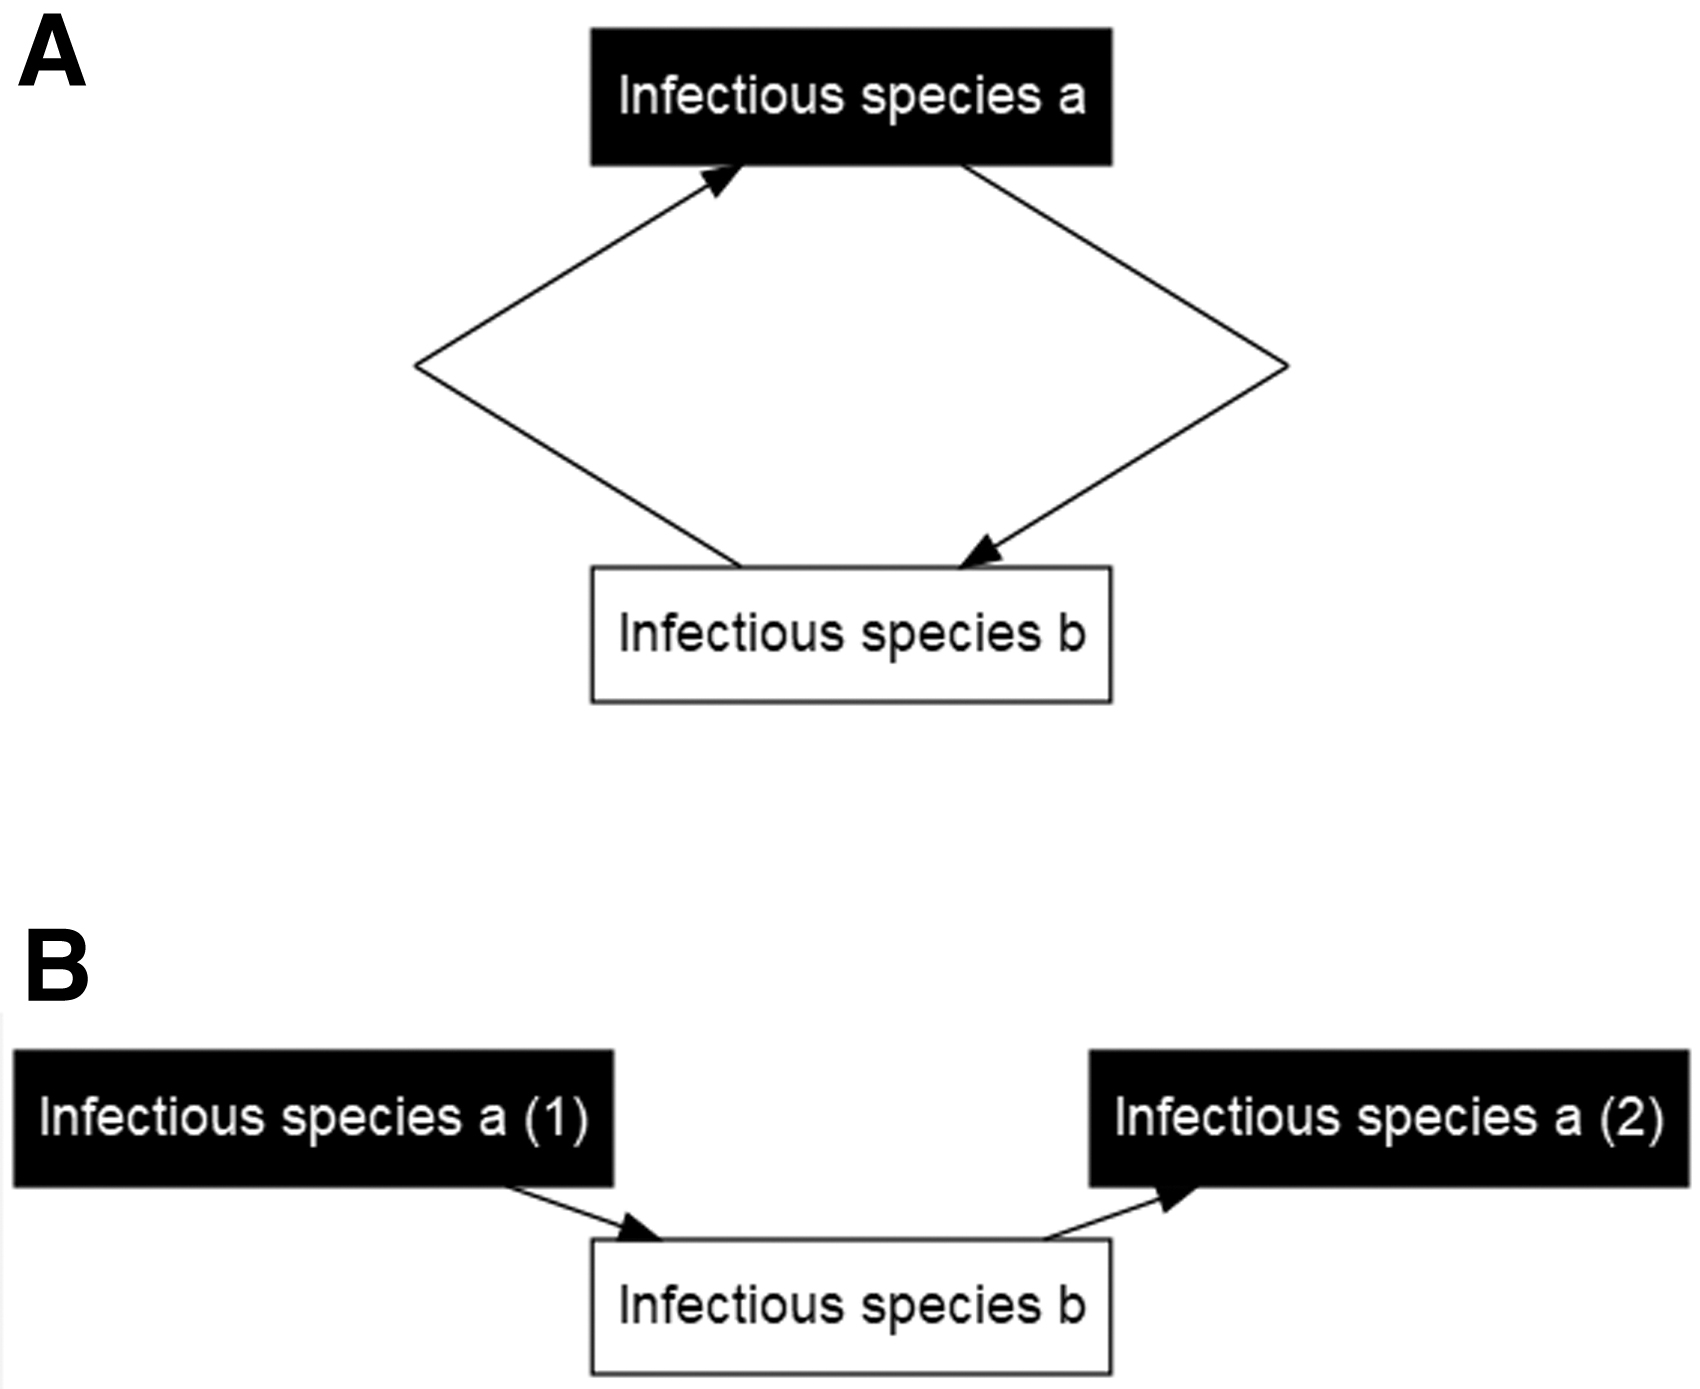
A transmission cycle between two required species a and b. (
If the infectious agent spends a significant part of its transmission cycle in the environment, then the environment should be modeled as if it were a separate host. The DAG would follow the same structure as that for a situation with several necessary hosts (see Supplementary Fig. S2 for an example).
When infection of incidental hosts is the outcome of interest, the split should occur on the host species transmitting the infection to the incidental host. More species involved in the transmission can be added if necessary to visualize one complete cycle before reaching the incidental host node. An example of an infectious agent with both incidental hosts and an environmental stage is Toxocara canis (DAG shown in Supplementary Fig. S2).
Infectious agent can infect multiple species, but infection of other species is not necessary for the transmission cycle
Some infectious agents can complete their transmission cycles entirely within one host species while also being capable of crossing species barriers. As seen in Fig. 4, multiple cycles of transmission occur simultaneously (within species a, between species a and species b, and within species b). Multiple node instances are needed to separate all of these cycles. We accomplish this by splitting the nodes for each infectious species with this transmission pattern.
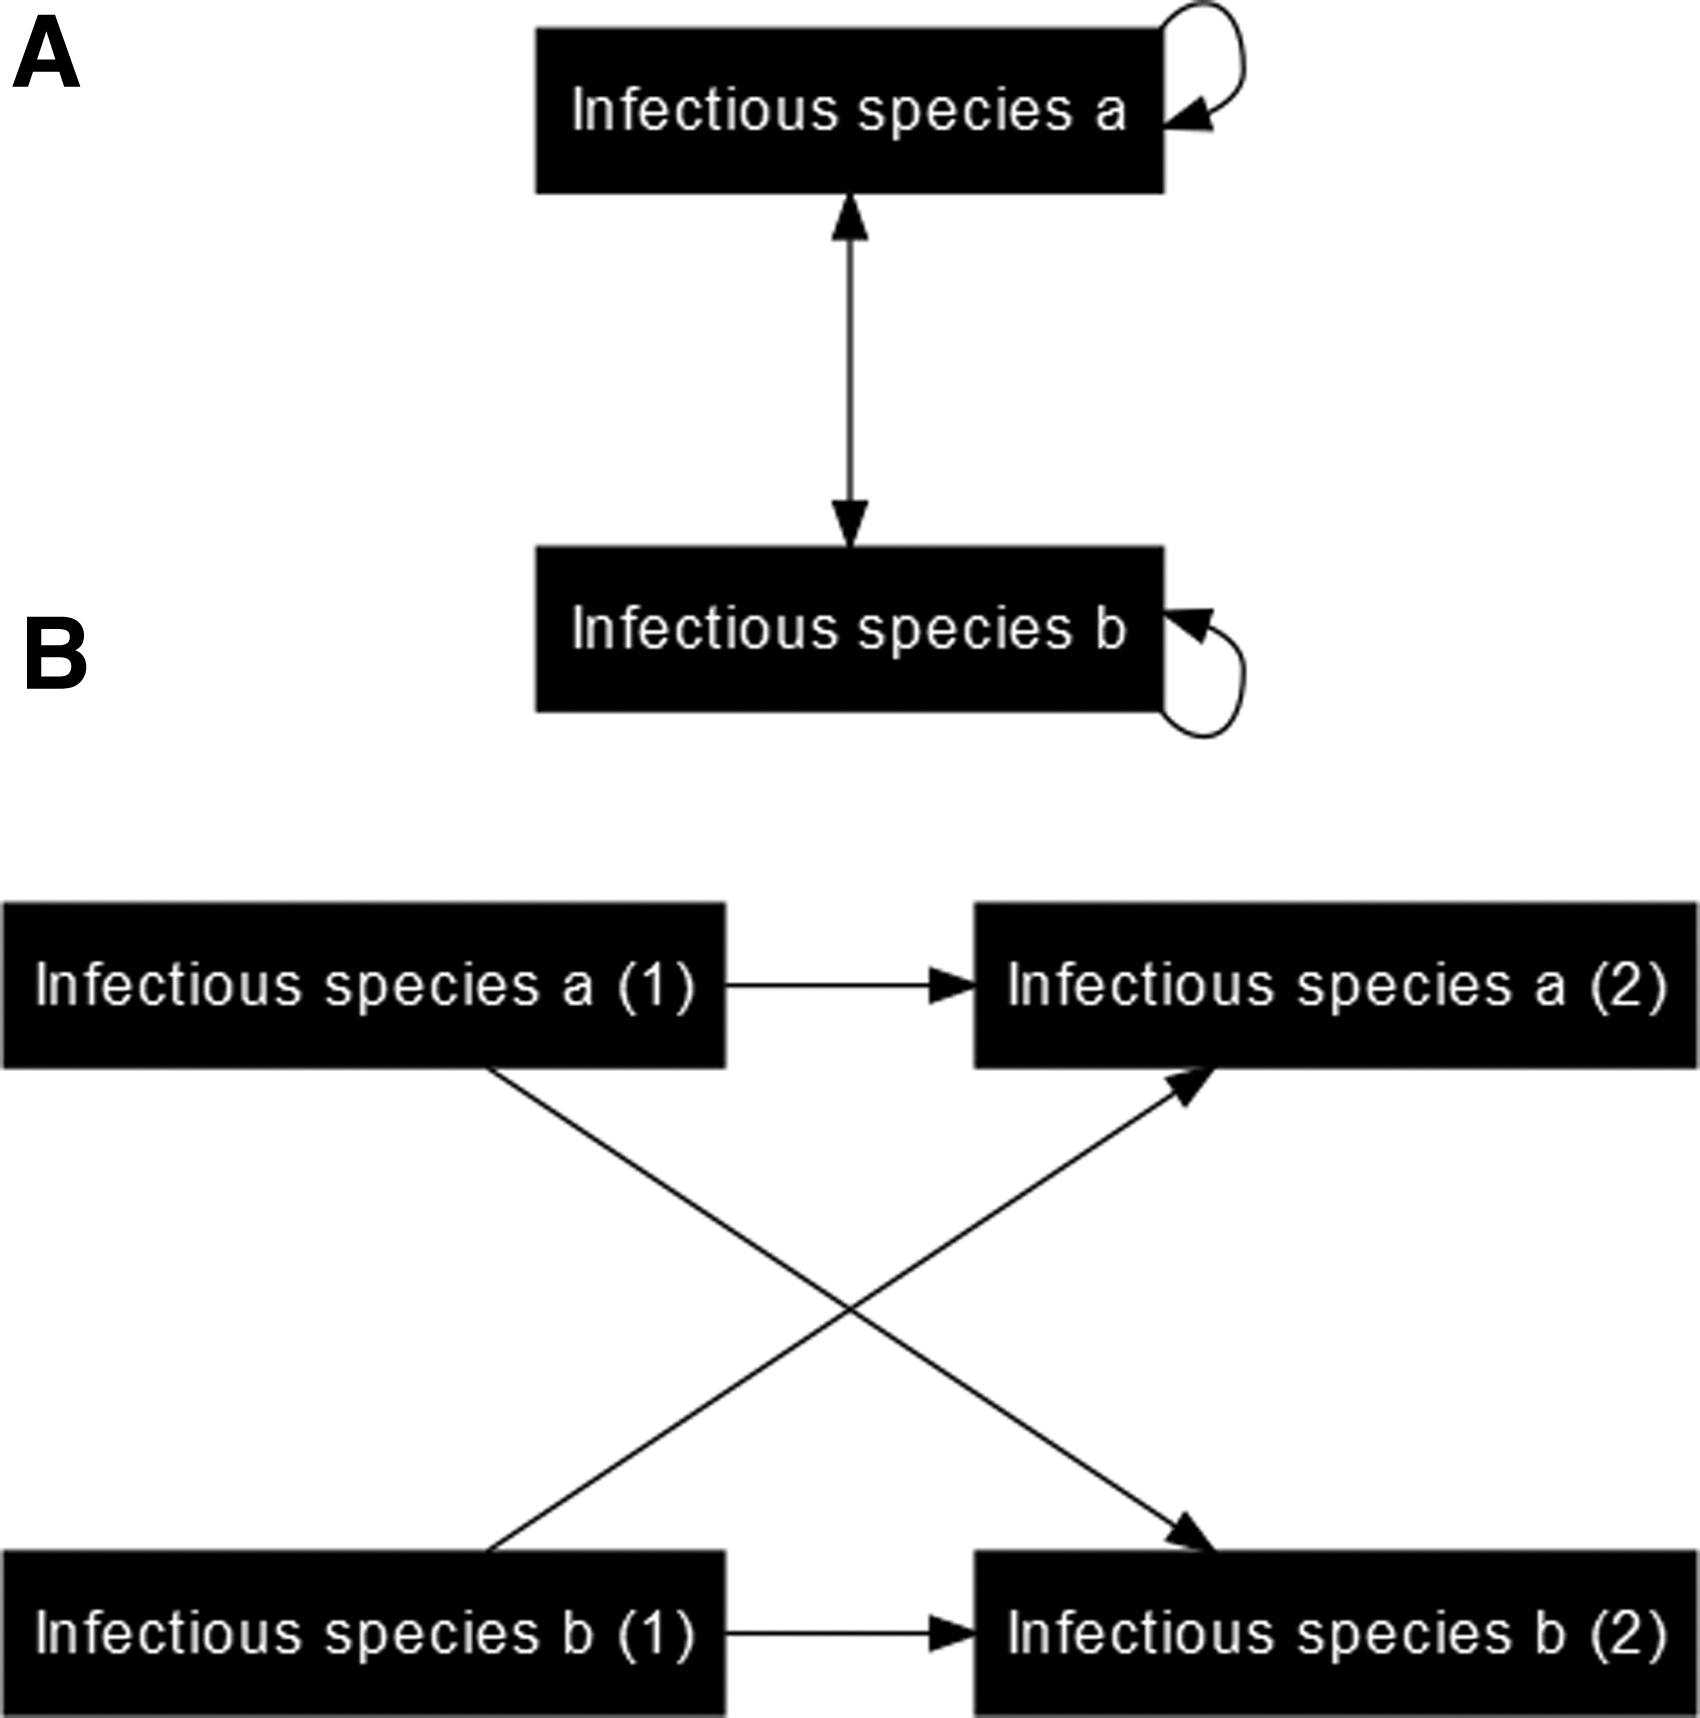
(
In the resulting DAG, each infectious host in its second instance has multiple transmission arcs by which it could have become infected (through contact with an infectious host of its own species or contact with an infectious host of another species). These arcs and their different starting points should be shown together in the same DAG (Fig. 4) so that all infectious hosts can be considered simultaneously.
While Fig. 4 only shows two species, this process can be expanded until the resulting DAG includes all of the host species of interest (demonstrated further in Supplementary Fig. S2). When expanded, each host species should have a causal pathway for transmission within its species and also causal pathways for transmission to other species.
Figure 4 is an example DAG where infections in all host species are the outcome of interest. The following example shows how to simplify DAGs such as Fig. 4 if infections in only one species are the outcome of interest.
Example: West Nile virus
WNV is a zoonotic vector-borne virus of the family Flaviviridae and is endemic worldwide (Chancey et al, 2015). Mortality depends on the species, but certain bird species (crows and blue jays, particularly) experience high mortality. Infected humans may develop inflammatory neurological disease (Chancey et al, 2015). Nearly 3000 cases in humans were reported across the United States in 2018 (McDonald et al, 2019). The true number of human infections with WNV per year is likely much higher since cases of neurological disease represent at most 1 in 50 of all human infections (Carson et al, 2012).
The transmission cycle of WNV is shown in Fig. 5. The virus normally circulates between birds of various species (particularly crows, blue jays, house sparrows, and house finches) and mosquitoes (most often Culex spp.). Once infected, these birds act as amplifying hosts and develop viremia that is strong enough to infect biting mosquitoes. Both horses and humans can be infected by a mosquito bite, but these are considered incidental hosts as they rarely develop strong viremia.
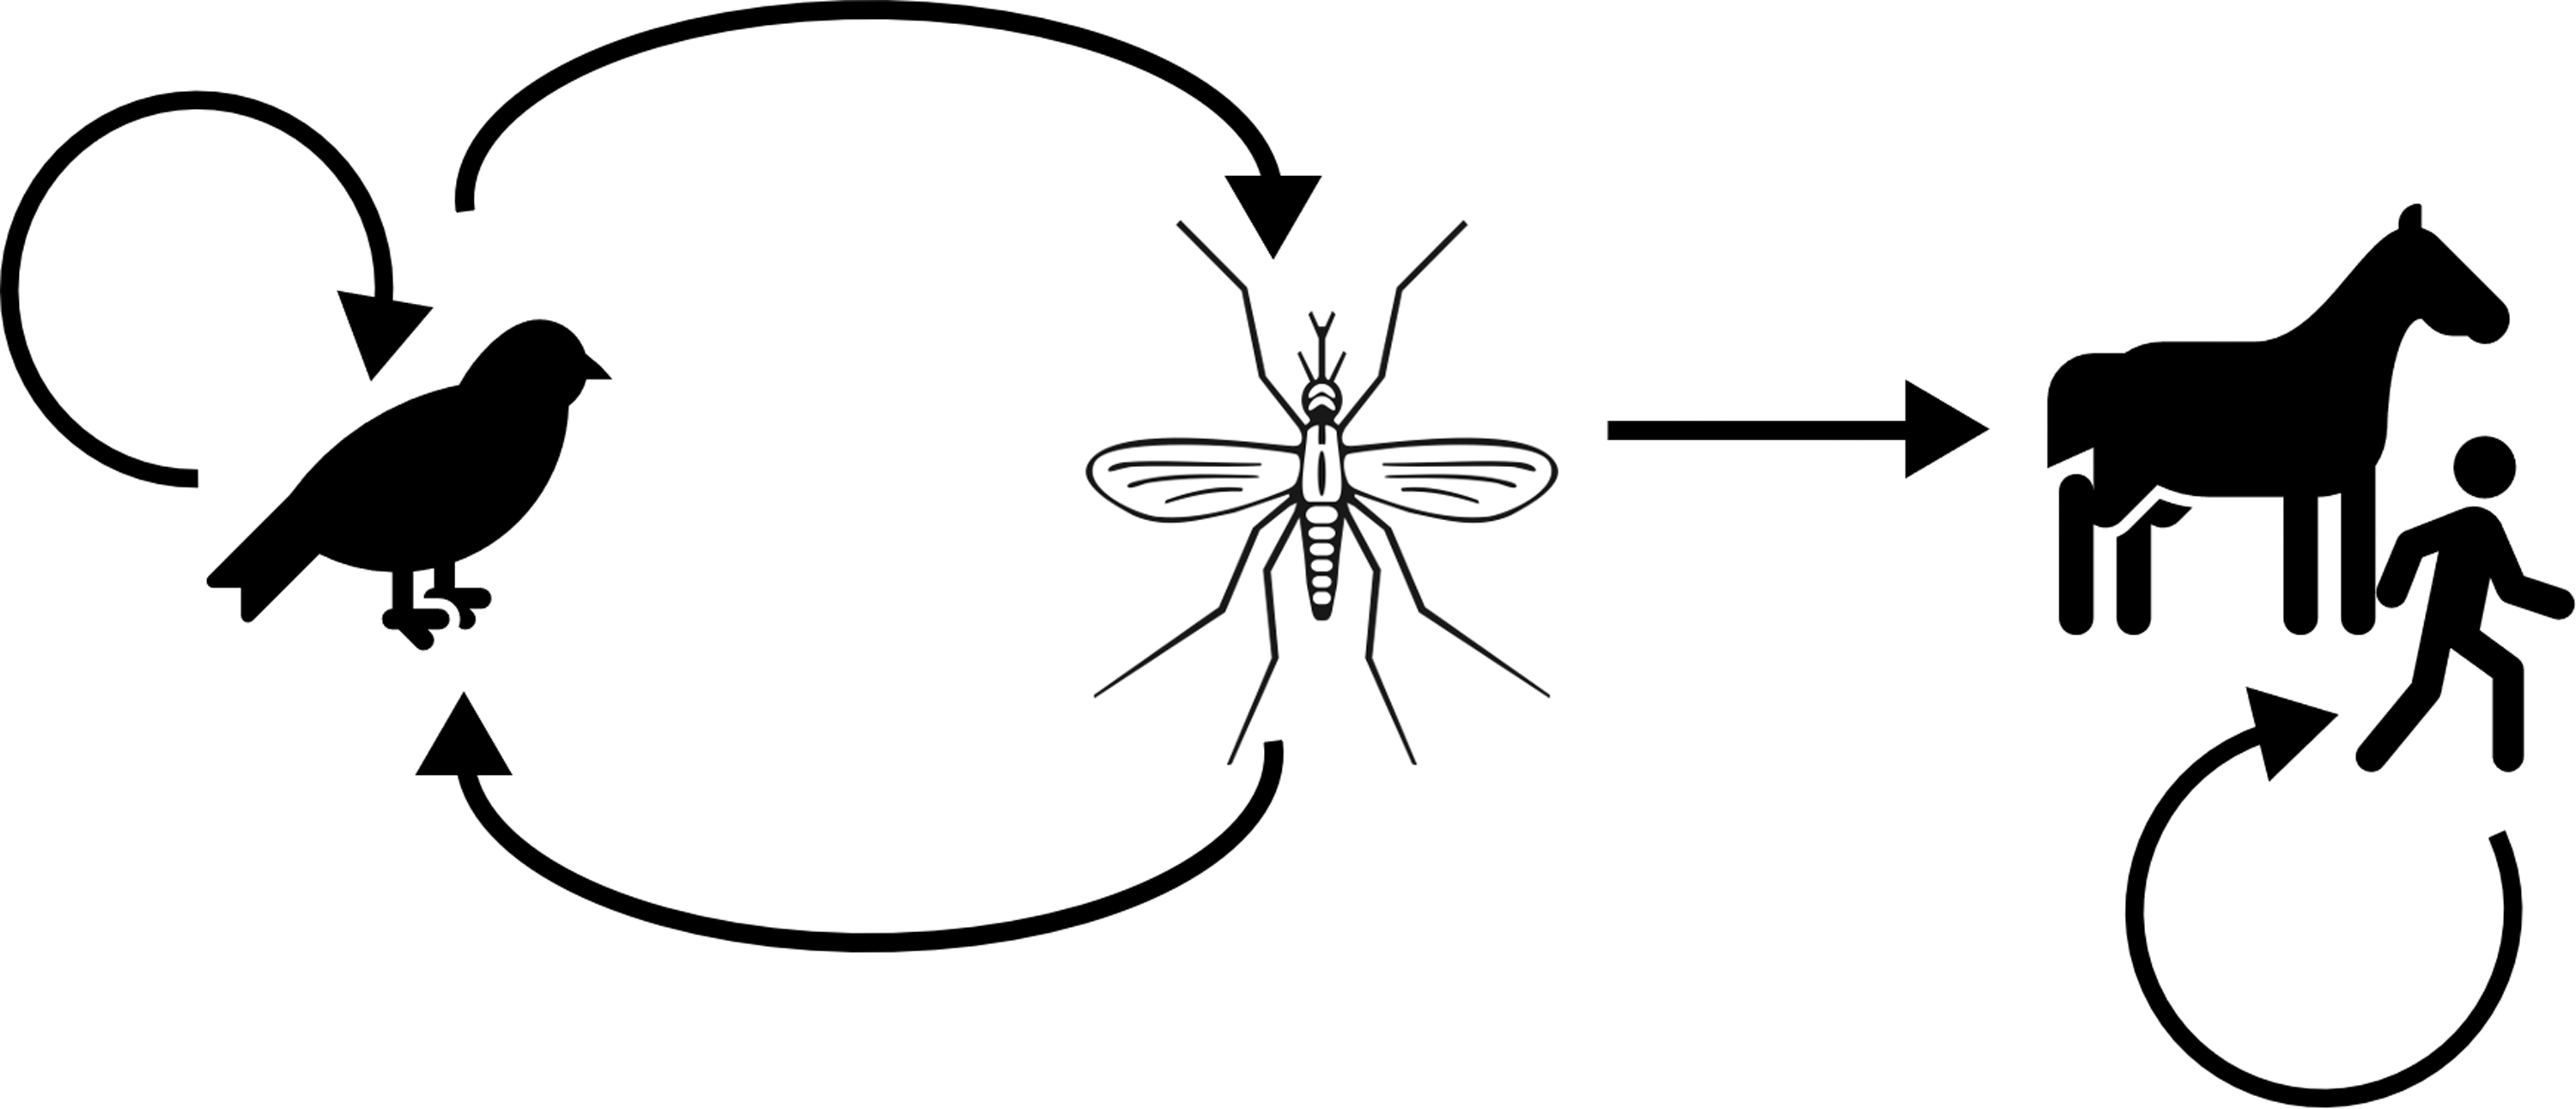
The transmission cycle of West Nile virus, including minor transmission within vertebrate species groups. Transmission is shown by the arrows between different hosts. Mosquitoes become infected when they bite viremic birds, and birds most often become infected when they are bitten by infected mosquitoes. Mosquitoes can infect horses and humans, but horses and humans do not develop enough viremia to infect mosquitoes. Finally, transmission can happen between birds and between humans by transmission of infectious bodily fluids, such as a blood transfusion (humans) or contact with cloacal fluids (birds).
Transmission is possible without mosquito involvement if a susceptible animal is exposed to infected bodily fluids (such as transfusion of contaminated blood in humans, vertical [transplacental] transmission in humans, or contact with cloacal fluids in birds) (Chancey et al, 2015). Nonmosquito transmission of WNV between horses has not been demonstrated. However, one case exists of a human being infected during necropsy of a WNV-infected horse, likely as a result of mucus membrane exposure to nervous tissue aerosol (Venter et al, 2010).
Some small nonavian vertebrates have developed strong viremia after experimental infection (Chancey et al, 2015), but these have been excluded from our presented cycle as their importance as reservoirs is unknown. We also exclude intravertebrate interspecies transmission of West Nile virus (except between birds of different species) as it seems highly unlikely that birds, horses, or humans would routinely come into contact with potentially infectious bodily fluids from species other than their own.
Creating a DAG
Our outcome of interest for this DAG is human infections of WNV. WNV has two primary hosts (bird and mosquito) and two incidental hosts (horses and humans). Mosquitoes must be infected by birds, but birds and humans can infect their own species. Thus, we will use a structure similar to that of Figs. 3B and 4B and Supplementary Fig. S2A to build the DAG.
Figure 6 shows the iterative process of building the DAG. For the purpose of our example, when building our DAG, we will ignore intraspecies transmission as this represents an uncommon source of infections in these species. The DAG has three important interspecies transmission steps needed to create the longest possible nonrepetitive chain of transmission events (mosquito to bird, bird to mosquito, and mosquito to human). We include all possible transmission events that can occur during these steps (such as between birds and mosquitoes) as arcs in the DAG.

A transmission DAG for WNV.
The resulting entire DAG is shown in Fig. 6A. Upon examining this DAG, we see that some nodes are not, and never will be, potential causes of human infection in the last instance. These nodes (infected horses at any instance, infected humans at any instance except the last, infected birds at any instance except the second, and infected mosquitoes at the first and third instances) can be removed from the DAG without interfering with demonstration of the causes of human infection. The resulting DAG (Fig. 6B) is far easier to read.
Discussion
This work demonstrates how the cyclic and complex nature inherent in zoonotic infectious agents such as WNV is not a barrier to creating DAGs. The tools provided here aid investigators in creating a skeleton upon which risk factors and their causes can be added [see Greenland et al (1999) and Suttorp et al (2015) for advice on how to do so]. Investigators can use these DAGs to identify confounding and minimize the potential for overadjustment, unnecessary adjustment, and collider-stratification bias in communicable disease outcomes of interest even when the infectious agent has a complicated, multihost transmission cycle (Schisterman et al, 2009).
Although DAGs of a communicable infectious agent have been developed, which use incident cases as an outcome, they have either used an opportunistic infection that does not require following the transmission of one infectious agent [for example, bovine respiratory disease (Hay et al, 2014)] or considered an infectious agent that affects only one species (Arnedo-Pena et al, 2019; Cassels et al, 2014). None of these studies extended the DAG to infectious agents with multihost transmission cycles. In this study, we demonstrate how to create DAGs that show animal and human infections as well as vector/environmental contamination.
There are several other methods available to control for confounding in infectious disease epidemiology without specifically identifying the relevant confounders. Some study questions can be answered with a randomized controlled trial [see Tiono et al (2013) as an example] in which the randomization, when done properly, will break the causal paths between potential confounders and the exposure/intervention. When randomization is not possible, statistical methods such as propensity scores are available to control for confounding during analysis (VanderWeele, 2019). DAGs provide a method for identifying relevant confounders in observational studies as well as a visual model for explicitly describing the causal relationships between variables.
DAGs are limited by the amount and quality of data available to create them. It is important to identify and minimize sources of information and selection bias when determining which associations are truly causal and worth including in the DAG. Additionally, one should not forget that causes of an outcome may be difficult to identify if the population variability in risk factors is low (Rose, 1985). Thus, the distribution of risk factors in a specific subpopulation may not be variable enough for its results to be generalizable to the population being explored in the DAG.
Finally, it may be difficult to find quality information on causes of transmission when a disease is emerging or when the host species are unknown. While a DAG could be constructed using the information available at the time, the pace at which information is identified and verified creates a risk that the transmission DAG would be obsolete by the time it is completed.
An additional limitation of DAGs is that they are strictly qualitative. DAGs created here are not intended for use in modeling of transmission dynamics. Instead, these DAGs are intended to inform the selection of covariates to be included in statistical analyses of the association between a risk factor and an outcome. DAGs can be developed using evidence from systematic reviews or subject matter experts' opinions on associations between causes and effects (Cortese et al, 2018).
Finally, our transmission DAGs have limitations specific to their use in infectious disease. The first is that these DAGs are best suited for endemic infectious agents. While theoretically a DAG could be created for causal processes during an epidemic, it is likely that efforts made to respond to the epidemic would change the causal network such that any DAG would be outdated as soon as it is made.
An additional limitation is our simplifying assumption that transmission occurs in discrete steps such that there is no time overlap between waves of infection. We recognize that this is a simplifying assumption of our DAGs, but treating transmission as occurring in discrete cycles is a common assumption in many infectious disease models.
Conclusions
DAG is a tool that allows researchers to explicitly state their assumptions about relationships between an exposure, outcome, and covariates. The DAG requires a time investment before the start of an observational study, but reduces the potential for bias if developed properly. Our work demonstrates how the most commonly observed components of complicated transmission cycles can be developed into a DAG, as shown using our example organism of WNV.
Footnotes
Acknowledgments
The authors would like to thank Dr. Geneviève Lefebvre, Dr. Theresa Gyorkos, and Dr. Antionette Ludwig for their contributions to the discussions. They would also like to thank the Centre de recherche en infectiologie porcine et avicole (CRIPA) for their financial support at the start of this process.
Author Disclosure Statement
No competing financial interests exist.
Funding Information
This work was supported by L'Institut de Valorisation des Données (E.J., grant number: PhD-2019a-2683768193) and by the Canada Research Chair in Epidemiology and One Health (H.C., grant number: CRC 950-231857).
Supplementary Material
Supplementary Data
Supplementary Figure S1
Supplementary Figure S2
References
Supplementary Material
Please find the following supplemental material available below.
For Open Access articles published under a Creative Commons License, all supplemental material carries the same license as the article it is associated with.
For non-Open Access articles published, all supplemental material carries a non-exclusive license, and permission requests for re-use of supplemental material or any part of supplemental material shall be sent directly to the copyright owner as specified in the copyright notice associated with the article.
