
Abstract
Background:
Lyme disease (LD) is the most common tick-borne illness in North America. LD is acquired through exposure to the tick vector, Ixodes scapularis, known as the blacklegged tick. In Canada, LD is rapidly emerging, with the establishment of I. scapularis in many newly endemic regions posing a growing risk to local communities. In the Canadian context, many environmental and socioeconomic risk factors for human LD infection are yet to be ascertained and the degree of risk associated with residential and community exposure to ticks is not well known.
Methods:
We conducted a matched case-control study in southeastern Ontario, using LD patient data from provincial laboratory databases and uninfected population controls from 2014 to 2018. We aimed to identify area-level risk factors for LD and associations with residence in environmental risk areas, defined as areas with high model-predicted probability of I. scapularis occurrence, using the neighborhood dissemination area as the unit of analysis.
Results:
Using multivariable conditional logistic regression analysis, we identified that patients with LD had higher odds (odds ratio, OR; 95% confidence interval, CI) of living in neighborhoods with high probability of tick occurrence in the environment (OR = 2.2; 95% CI: 2.0–2.5), low walkability (OR = 1.6; 95% CI: 1.2–2.1), low material deprivation (OR = 1.4; 95% CI: 1.2–1.7), and low ethnic concentration (OR = 8.1; 95% CI: 6.7–9.9). We also found that the odds of LD infection for individuals residing in environmental risk areas was highest for those living in public health units (PHUs) with <250,000 population (OR = 3.0; 95% CI: 2.4–3.9) compared to those living in PHUs with >1,000,000 population (OR = 1.5; 95% CI: 1.1–2.1).
Conclusion:
This study shows that odds of human LD infection in Ontario, Canada is higher in less urbanized areas with higher socioeconomic status and indicates that exposure to ticks around the home residence or neighborhood is linked to increased odds of LD.
Introduction
Lyme disease (LD) is the most common vector-borne illness in North America (Kuehn 2013, Public Health Agency of Canada 2022). In central and eastern North America, LD is transmitted to humans by the tick vector, Ixodes scapularis, also known as the blacklegged tick, which has continued to spread in recent decades due to a warming climate and favorable environmental changes that promote the expansion of tick habitat (Ogden et al. 2008, Clow et al. 2017a). Ixodes scapularis ticks acquire the causative agent of LD, Borrelia burgdorferi sensu stricto, during successful feeding by larvae and nymphs on small- and medium-sized mammals or birds (Kilpatrick et al. 2017). Blacklegged ticks are mostly found in woodland habitats where the density of animal hosts is highest and where the canopy, vegetation, and leaf litter provide protection from desiccation in summer and freezing in winter (Clow et al. 2017b, Talbot et al. 2019, Slatculescu et al. 2020).
Growing changes in land use and forest fragmentation have increased the intersection between ticks and high-human population densities (Tran and Waller 2013). Fragmented forest edges are also associated with higher populations of white-tailed deer (Odocoileus virginianus), which are reproductive hosts for adult I. scapularis; and reduced species diversity that is believed to favor the abundance of habitat-generalists like the white-footed mouse (Peromyscus leucopus), considered the main reservoir of B. burgdorferi (Allan et al. 2003, Werden et al. 2014).
In the United States, human exposure to infected I. scapularis ticks mainly occurs in peridomestic environments (Falco and Fish 1988a, Cromley et al. 1998, Connally et al. 2009, Moon et al. 2019b). Survey studies conducted in the New England region have reported high percentages of domestically acquired ticks, with 69% of participants (n = 70) in Westchester County, NY, and 74% of individuals (n = 4717) across Connecticut self-reporting backyard tick exposure (Falco and Fish 1988b, Stafford et al. 2017). Peridomestic tick exposure has been linked to various yard and neighborhood risk factors such as lawn maintenance, fencing around the yard, type of shrubbery and trees in the yard, and presence of deer or other animals on the property along with behavioral risk factors such as time spent in the yard, pet ownership, and use of protective clothing or acaricides outdoors (Maupin et al. 1991, Ley et al. 1995, Klein et al. 1996, Connally et al. 2009, Finch et al. 2014, Mead et al. 2018).
Despite evidence for peridomestic tick exposure, a recent meta-analysis looking at spatial risk factors for tick-borne diseases in 14 American states and in Canada found that the odds of acquiring tick-borne diseases was highest for neighborhood-scale risk factors (odds ratio (OR) = 4.1; neighborhood defined as outside the yard but within 500 meters of the property boundary) compared to yard-scale risk factors (OR = 2.6) (Fischhoff et al. 2019). There remains considerable variation in risk at various spatial scales and additional studies are needed to assess yard and neighborhood characteristics that contribute to the transmission of tick-borne diseases.
In Canada, populations of I. scapularis were first identified in Long Point, Ontario in the early 1970s, a decade before the blacklegged tick was identified as the vector for B. burgdorferi transmission (Watson and Anderson 1976, Burgdorfer et al. 1982). LD has been a reportable disease in Ontario since 1988 and later became nationally notifiable in 2009 (Ontario Agency for Health Protection and Promotion [Public Health Ontario] 2016, Public Health Agency of Canada 2022). Since 2009, the numbers of reported cases have increased more than 10-fold in the last decade as the distribution of I. scapularis continued to spread northward (Gasmi et al. 2017, 2018, Nelder et al. 2018, Public Health Agency of Canada 2022).
It is estimated that from 2012 to 2022, the range expansion of I. scapularis is expected to increase at ∼46 km/year, with many communities becoming newly emerging risk areas (Leighton et al. 2012, Clow et al. 2017a, Kulkarni et al. 2019, Burrows et al. 2021). Currently, it is unclear what neighborhood risk factors contribute to the growing incidence of LD in Canada and whether peridomestic exposure to ticks occurs to the same extent as it does in neighboring states in the United States. Therefore, we designed a matched case-control study in Ontario, Canada to (1) identify area-level neighborhood and socioecological risk factors for LD in a Canadian setting, and (2) determine whether LD incidence is associated with residence in high environmental risk areas.
Methods
Study site
The study was conducted in the southeastern region of Ontario, Canada (Fig. 1). The area includes three ecoregions (Lake Erie–Lake Ontario ecoregion 7E, Lake Simcoe–Rideau ecoregion 6E, and Georgian Bay ecoregion 5E), defined by the Ontario Ministry of Northern Development, Mines, Natural Resources, and Forestry (NDMNRF) on the basis of bedrock, climate, physiography, and vegetation, in addition to several large census metropolitan areas including Toronto and the Greater Toronto Area (5,928,040 population) and Ottawa (934,243 population) (Ontario Ministry of Natural Resources 2007, Statistics Canada 2017).

Study area map showing PHUs and ecoregions in southern and eastern Ontario. PHU, public health unit.
Study population
All LD cases from 2014 to 2018 that resided in Ontario at the time of LD diagnosis, hereafter referred to as index date, were extracted from data held at ICES, which was previously linked to health administrative data routinely collected from Ontario's publicly funded single-payer health care system and used to assess health care costs of LD in Ontario (Shing et al. 2019). ICES is an independent, non-profit research institute whose legal status under Ontario's health information privacy law allows it to collect and analyze health care and demographic data, without consent, for health system evaluation and improvement. In this study, we included both confirmed and probable LD cases, based on the national case definition (Public Health Agency of Canada 2016). Confirmed LD is defined as (1) clinical evidence of illness with laboratory confirmed B. burgdorferi infection via isolation of bacterium or DNA from a clinical specimen, or (2) clinical evidence of illness with two-tiered serological testing confirmation and a history of residence or travel to a known LD risk area.
Probable LD is defined as (1) clinical evidence of illness with two-tiered serological testing confirmation but without a history of residence or travel to a known LD risk area, or (2) physician-diagnosed erythema migrans without laboratory evidence but a history of residence or travel to a known LD risk area. A description of clinical evidence included in the case definition, including objective signs and symptoms that may be used in a clinical diagnosis of LD, is provided in the 2016 case definition report (Public Health Agency of Canada 2016). Confirmed and probable LD cases who did not reside in the study area or who had invalid health or postal code data at the index date were excluded from the study (n = 85, 3.1%).
Controls, representative of the general population, were selected from the Registered Persons Database (RPDB), available through ICES data holdings. The RPDB contains demographic information on persons registered under the Ontario Health Insurance Plan (OHIP) who are eligible for publicly funded health care (∼16 million records), which constitutes nearly the entire population of the province due to the universal publicly funded health care system in Ontario. People appearing in the RPDB were assigned a pseudo-index date based on the distribution of index dates for LD cases. Individuals who appeared in the LD provincial reportable disease dataset from 2014 to 2018, who were deceased before the pseudo-index date, who had missing age, sex, date of birth, or a home postal code, who were aged over 105 years, and who were not eligible for OHIP or residing in the study area at the pseudo-index date were excluded from the RPDB source population from which uninfected controls were selected (n = 2,173,837, 13.7%).
LD cases and controls were hard matched on age, sex, and index date/pseudo-index date using a Greedy algorithm (linear matching algorithm) that generates one-to-many matched pairs sampled without replacement. These datasets were linked using unique encoded identifiers and analyzed at ICES. LD risk is seasonal and age- and sex-related, with most cases occurring in children 5–14 years, older adults 60–74 years, men, and during the spring-to-fall peaks of tick activity (Nelder et al. 2018, Public Health Agency of Canada 2022). Likewise, age and sex are associated with various degrees of knowledge, risk perception, and preventive behaviors that affect exposure to ticks (Aenishaenslin et al. 2015, 2017). Matching balances baseline characteristics between cases and controls by selecting controls with similar distributions for age, sex, and date of residence in Ontario. This helps increase statistical efficiency by reducing the variation in the calculated OR estimates that would arise had controls been randomly selected at a very different distribution for these factors (Iwagami and Shinozaki 2022).
Risk factor assessment
Exposure to environmental risk areas
A previously constructed species distribution model for I. scapularis, which predicts the probability of tick occurrence across a continuous landscape from 0 to 1 based on regional climate and land cover features, was used as a measure of environmental risk for LD in southeastern Ontario (Slatculescu et al. 2020). This model was constructed using tick surveillance data from 2015 to 2018 and reflects the contemporaneous environmental risk for the study population. The model output at 100 meters resolution was used to calculate an average probability of I. scapularis occurrence per dissemination area (DA) using zonal statistics in ArcGIS v.10.5.1 (ESRI, Redlands, CA). DAs are defined as small, relatively stable geographic units, composed of one or more adjacent dissemination blocks with an average population of 400–700 persons, bounded by features such as roads, railways, and water sources (Statistics Canada 2018).
We used the DA-level to approximate neighborhood-level characteristics for subsequent analyses. The average probability of I. scapularis occurrence per DA was used to categorize the DA-level environmental risk for LD as low or high using the model prevalence as a threshold. The model prevalence is defined as the average probability of tick occurrence over all the background pixels (i.e., a model prevalence of 0.5 implies that the species is present in half of all the possible locations); this threshold was selected as it is one of the more suitable approaches for transforming the results of species distribution models from probabilities to categorical measures (Liu et al. 2005).
The DA-level low/high environmental risk for LD was then assigned to each LD case and control based on the individual's home address using DA as the matching variable. The home address was also linked to the nearest public health unit (PHU), a larger geographic unit governed by a health agency that provides local public health services. Twenty-nine PHUs were located within our study area; however, to avoid small cell sizes, we created three PHU categories based on population size (Group 1: >1,000,000 population, Group 2: 250,000–999,999 population, and Group 3: <250,000 population) (Supplementary Table S1).
Environmental and socioeconomic risk factors
Land cover data from the Southern Ontario Land Resource Information System version 3.0 (SOLRISv3.0) and geospatial data on provincial/municipal regulated parks and trails in Ontario, available from NDMNRF's open data portal (
DA-level socioeconomic variables of interest included the 2008 Rurality Index for Ontario (RIO), neighborhood income quintiles, and population density, obtained from the 2016 Canada Census (Statistics Canada) and the 2016 Ontario Marginalization Index (ON-Marg), available from Public Health Ontario (PHO) (Statistics Canada 2017, Matheson and van Ingen 2018). The ON-Marg was derived from a series of iterative factor analyses of 42 census-based indicators, yielding four factors (i.e., residential instability, material deprivation, dependency, and ethnic concentration) with 18 remaining indicators that represent multiple dimensions of socioeconomic status in Ontario (Matheson and van Ingen 2018). Variable definitions are listed in Table 1.
Definition of Dissemination Area-Level Risk Factor Variables
CA, census agglomeration; CMA, census metropolitan area; DA, dissemination area; LD, Lyme disease; PHU, public health unit; RIO, rurality index for Ontario.
Statistical analysis
Sample size calculation
The number of LD cases and controls needed for the study were calculated using Sampsize (© 2003 Philippe Glaziou, Free Software Foundation, Boston, MA). One thousand five hundred eighty-five LD cases and 6340 controls were needed to detect a modest difference in disease OR of 1.2, assuming 50% of controls reside within a high LD environmental risk area, a correlation coefficient of ɸ = 0.2 between case and control tick exposure status, and Type I and Type II error probabilities of ɑ = 0.05 and β = 0.90, respectively (Dupont 1988). A 1:4 case to controls matching ratio was used due to the availability of controls in the RPBD and to increase power for subgroup analyses (Hennessy et al. 1999).
Multivariable regression analysis
Multivariable conditional logistic regression analysis was performed to calculate the OR and 95% confidence intervals (CIs) for the association between human LD infection and residence in high environmental risk areas, while adjusting for environmental and socioeconomic risk factors. A full model was generated with variables defined in Table 1; those with significant effect based on the 95% CI were retained. Non-significant variables were added back to the model one at a time to test for confounding using the percent change in estimate method. If regression coefficients changed by more than 10% the variable was kept in the model.
The remaining model was tested for multicollinearity using the Spearman rank correlation coefficient to assess correlation between ordinal variables and using variance inflation factor (VIF) and collinearity diagnostics to measure overall correlation when all variables are together. Highly correlated variables (R s > 0.6, VIF >5 and proportion of variance >0.5) were removed to generate the most parsimonious model (Schreiber-Gregory and Jackson 2017). Homogeneity of effect was assessed through stratified analyses and model fit was assessed by visual inspection of residuals and deviance analysis. Analyses were conducted in SAS Enterprise Guide 7.1 (SAS Institute, Inc., Cary, NC).
Sensitivity analysis
The selection of a threshold for transforming model predictions from probabilities to presence/absence affects the classification of an individual's residence in terms of environmental risk for LD. We conducted a sensitivity analysis to test the robustness of the selected threshold on our overall results. There is currently no standard approach for selecting a threshold to categorize the output of a species distribution model, although several studies have used simulation data to test the validity of various approaches (Liu et al. 2005, Freeman and Moisen 2008). We selected maximization of sensitivity plus specificity as a secondary threshold because it yielded good results using simulation data (Liu et al. 2005).
Results
Study subjects
From 2014 through 2018, 2630 incident LD cases (confirmed: n = 2284, 86.8%; probable: n = 346, 13.2%) were identified in southern and eastern Ontario. Mean age of LD cases was 46.9 ± 21.4 years, 1485 (56.5%) were men, 245 (9.3%) resided rurally (RIO >40), and 1400 (53.2%) resided in PHUs with <250,000 population (Table 2). LD cases increased annually from 224 (8.5%) in 2014 to 629 (23.9%) in 2018, with a peak of 985 (37.5%) in 2017 (Table 2). All cases were matched to controls (n = 10,520) at a 1:4 ratio by exact age, sex, and index date. Controls had the same distribution as cases for the matched variables, but fewer resided rurally (n = 486, 4.7%) and in PHUs with less than 250,000 population (n = 1805, 17.2%) (Table 2).
Descriptive Statistics of Laboratory-Confirmed and Probable Lyme Disease Cases and Matched Controls in Southeastern Ontario, Canada (2014–2018)
SD, standard deviation.
Area-level risk factors for LD
Using the model prevalence threshold to identify low/high environmental risk areas for LD, 56.6% (n = 7438) of the DAs within the study area were classified as high-risk regions (Fig. 2). Multivariable analysis of matched case-control pairs indicated that LD patients were more likely to reside within neighborhood with high environmental risk for LD (OR = 2.2; 95% CI: 2.0–2.5), lower walkability score (OR = 1.6; 95% CI: 1.2–2.1), lower material deprivation (OR = 1.4; 95% CI: 1.2–1.7), and lower ethnic concentration (OR = 8.1; 95% CI: 6.7–9.9) (Table 3).
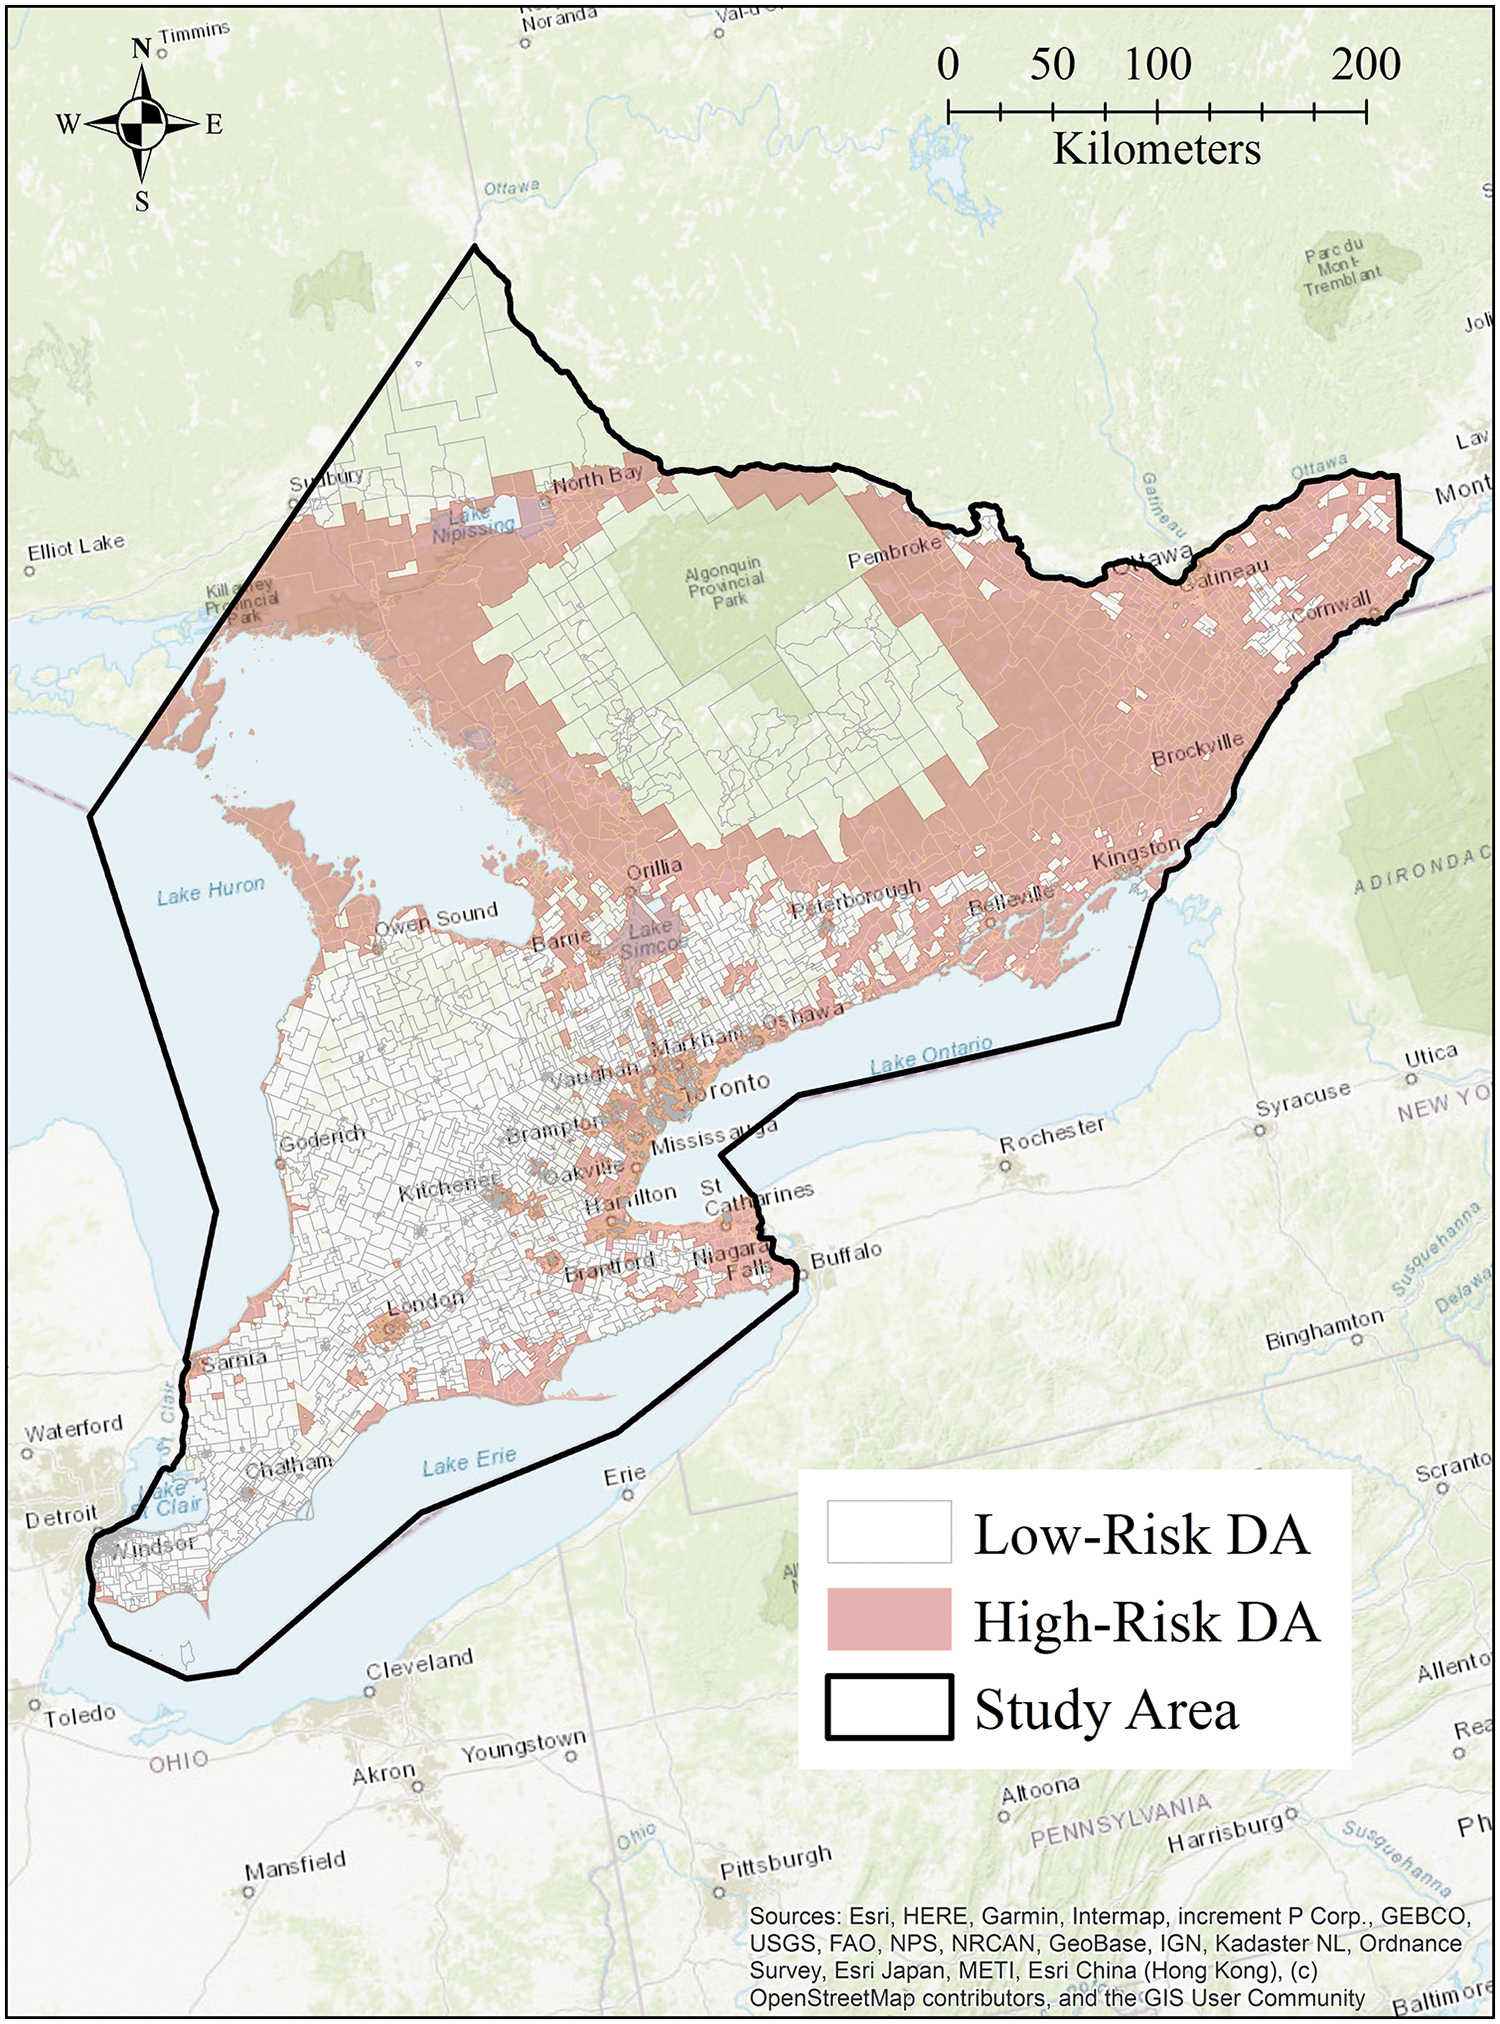
DAs with low/high environmental risk for LD in southeastern Ontario using the model prevalence threshold to categorize risk. DA, dissemination area; LD, Lyme disease.
Multivariable Conditional Logistic Regression Analysis of Area-Level Neighborhood and Socioeconomic Risk Factors for Lyme Disease in Southeastern Ontario, Canada (2014–2018)
CI, confidence interval; OR, odds ratio.
However, the association between residence in high environmental risk areas and LD incidence was influenced by the larger geographic region; thus, we stratified analyses by PHU groups with similar population sizes. The odds of acquiring LD were highest for individuals residing in neighborhoods with higher average environmental risk that were situated within PHUs with <250,000 population (OR = 3.0; 95% CI: 2.4–3.9) compared to those living in PHUs with 250,000–999,999 population (OR = 2.0; 95% CI: 1.7–2.5) and PHUS with >1,000,000 population (OR = 1.5; 95% CI: 1.1–2.2) (Table 4).
Stratified Analysis of Associations Between Lyme Disease (LD) Incidence and Average Neighborhood LD Environmental Risk in Southeastern Ontario, Canada (2014–2018)
Adjusted for neighborhood walkability, material deprivation, and ethnic concentration.
Effect of different classification methods for LD environmental risk
The sensitivity analysis showed that using the maximization of sensitivity plus specificity threshold for classifying low/high environmental risk areas for LD resulted in more conservative estimates of LD risk. Using this approach, 38.1% (n = 5012) of DAs in the study area were classified as high-risk neighborhoods for LD. However, the OR for the association between human LD infection and residence in neighborhoods with high environmental risk for LD, when adjusting for socioecological risk factors, was nearly identical (OR = 2.1; 95% CI: 1.9–2.3). A similar trend was also observed for stratified analyses based on PHU of residence, although the magnitude of the association was slightly attenuated (Supplementary Table S2).
Discussion
Our study identified positive associations between the odds of LD and lower neighborhood walkability scores, which are strong indicators of a lower degree of urbanization due to fewer 3-way intersections and footpaths, dwelling density, and points of interest (i.e., businesses, shops, schools). Using k-means cluster analysis, Herrmann et al. (2019) found that DAs in rural regions and outermost city regions clustered in group 1 (lowest walkability score), DAs in residential and suburban neighborhoods were found in groups 2–4, and DAs in central business districts of major cities clustered in group 5 (highest walkability score).
The association between LD and lower neighborhood walkability suggests a greater risk in peri-urban regions, suburban neighborhoods, and rural communities, where more favorable environments exist for blacklegged ticks. In the city of Ottawa, Ontario, local surveillance at sites across the city found a higher density of I. scapularis and prevalence of B. burgdorferi in recreational trails and conservation areas/forests located in predominantly suburban and rural regions (Kulkarni et al. 2018). The sites that had high tick densities were also associated with a larger proportion of forests and specific forest composition and structure (e.g., dominant tree types) (Soucy et al. 2018, Talbot et al. 2019).
The inverse relationship between urbanization and LD was also observed more directly using population density (LD odds lower in PHUs with increasing population density), although LD risk does exist within an urban setting to a lesser extent. While the complete effect of urbanization on tick-borne illnesses is still unclear, recent studies in the USA and Europe found tick species and tick-borne pathogens in urban parks, where populations are believed to be maintained by small rodents and birds (Heylen et al. 2019, Noden et al. 2022). In this study, we also found a significant positive association between LD and DA-level proportion of provincial and municipal regulated parks (univariable analysis not shown), although it should be noted the magnitude of this effect was small, likely due to the geographic scale at which the data were analyzed (i.e., many DA boundaries did not contain parks).
Nonetheless, these results suggest that pockets of high-risk of tick encounters may exist in various neighborhood structures, highlighting the importance of local-scale assessments of environmental risk to inform risk mitigation strategies. For example, landscape management options, such as ecotonal woodchip barriers along recreational trails, may constitute important interventions that can reduce LD risk in communities (McKay et al. 2019).
We found that the odds of LD were also associated with two components of the ON-Marg: lower material deprivation and ethnic concentration. While direct associations between individual components of the ON-Marg and LD incidence are difficult to interpret, these results are supported by similar findings in Ontario, where LD incidence was shown to be highest in communities with increased dependency, a measure of the non-working population including older adults 65+ years and young children under 15 years, which are the highest risk demographic groups for LD (Slatculescu et al. 2022). Similar associations between LD and socioeconomic status were observed in the USA and Europe (Moon et al. 2019a, Tulloch et al. 2019).
This may be in part linked to the higher socioeconomic status of suburban neighborhoods surrounding major cities, where homes and properties sizes are larger and more green spaces are available for recreational use (Schnore 1963). Land “parcelization” (i.e., the division of large land blocks under single ownership into small blocks under multiple owners) is also positively correlated with favorable deer habitat and higher risk of tick-borne diseases as rural to exurban/suburban development continues to increase (Campa III et al. 2011, Lovely et al. 2013, Tsao et al. 2021). These may explain the paradoxical association between rurality and socioeconomic status.
Similar to studies in the USA, where LD incidence is higher than in Canada and ticks are largely endemic across the Midwest and Northeastern regions, we found an association between residence in communities with high tick occurrence and odds of contracting LD (Maupin et al. 1991, Cromley et al. 1998, Mead et al. 2018, Fischhoff et al. 2019). These results support the theory that LD environmental risk around the home and surrounding neighborhood contributes significantly to human LD infection, presumably through peridomestic or recreational exposure to infected ticks. However, this association was weaker for individuals living in urban regions as they may be more likely to travel outside of their neighborhood for recreational activities or to visit rural cottages in tick endemic areas.
This was observed by Slatculescu et al. (2022) in eastern Ontario, where 65.2% of Ottawa residents reported LD exposure locations outside of the health unit of residence, compared to 13.9%, 4.0%, and 1.9% for residents of the three largely rural neighboring health units. Similarly, Bron et al. (2020) found significant differences in risk behaviors related to yard activities and attitudes toward tick protective behaviors between the US Midwest and Northeast, two regions with very different levels of urbanization and socioeconomic status. It is likely that such differences also exist in regions of Ontario with varying levels of urbanization and socioeconomic status; however, these subjects warrant further investigation.
Our study has several limitations. The LD database from which we extracted LD cases did not contain tick exposure information or variables pertaining to location of tick acquisition; thus, we were unable to eliminate travel-related exposures (exposures outside Canada were not included in the LD database at ICES). We acknowledge that at the DA-level this is a significant limitation since we cannot account for non-neighborhood exposures, although we included subgroup analyses at the PHU-group level where local travel is less likely to affect results.
Second, the human disease surveillance system allows for updates to previous data, which may differ from earlier reports. Thus, the number of LD cases at the time of data extraction may not reflect all cases diagnosed in the province; however, we do not expect this to alter the study findings. It is also possible that some LD cases in Ontario may not be captured by the provincial reportable disease surveillance system; however, recent evidence showed that under-reporting of LD in Canada is estimated to be low (Ogden et al. 2019). Lastly, we cannot draw conclusions about individual-level behaviors and household features that may be linked to tick exposures around the home and neighborhood as this study focused solely on area-level risk factors for LD.
Our study also has notable strengths, as it identified novel socioecological risk factors for LD and affirms that exposure to ticks in the neighborhood and area around the home residence is a significant predictor of LD infection in the Canadian population. Our findings provide an important overview of the risk associated with LD exposure in the community for Ontario residents, which, together with local-scale research using active tick sampling in the peridomestic environment, can help demonstrate and identify regions where Canadians are exposed to ticks and have a higher risk for LD infection. LD risk prevention is mainly conducted at a local scale, where decision making takes place and where urban planning, landscape management, and other tick control strategies are employed. Identifying community, neighborhood, and socioeconomic risk factors for LD, such as those identified by this study, is essential for devising appropriate risk prevention strategies and increasing public health initiatives.
Conclusion
In Ontario, Canada, risk of human LD infection is higher in less urbanized areas with higher socioeconomic indices. Additionally, this study found that living in regions with higher occurrence of I. scapularis is linked to increased odds of LD; while this association was strongest in more rural communities, the association was also present in urban municipalities and cities. This may warrant the implementation of multiple public health messaging and risk mitigation strategies across different settings, to reduce the risk of residential/neighborhood tick exposure while also focusing efforts on tick-endemic recreational spaces frequented by urban residents.
Footnotes
Acknowledgments
We thank Drs. Meltem Tuna and Deshayne Fell at ICES uOttawa at the Ottawa Hospital Research Institute (OHRI) for their continued administrative and technical assistance with this project. We also thank Dr. Nicholas Ogden at the Public Health Agency of Canada (PHAC) and Drs. Marc Desjardins and William Cameron at the University of Ottawa for providing guidance with the study research questions and methodology.
Authors' Contributions
A.M.S. and M.A.K. conceived the study; A.M.S. curated the data, conducted the formal analyses, and wrote the main article; M.P. curated the data and created the dataset at ICES; A.M.S., B.S., K.Z., M.P.N., C.R. and M.A.K. developed the methodology and contributed to the interpretation of study results; M.A.K. and B.S. provided supervision and funding. All authors have read, revised, and approved the article.
Availability of Data and Materials
The dataset from this study is held securely in coded form at ICES. While legal data sharing agreements between ICES and data providers (e.g., health care organizations and government) prohibit ICES from making the dataset publicly available, access may be granted to those who meet pre-specified criteria for confidential access, available at
Ethical Approval and Consent to Participate
The use of the data in this project is authorized under section 45 of Ontario's Personal Health Information Protection Act (PHIPA) and does not require review by a Research Ethics Board.
Disclaimer
The analyses, conclusions, opinions, and statements expressed herein are solely those of the authors and do not reflect those of the funding or data sources; no endorsement is intended or should be inferred.
Author Disclosure Statement
No conflicting financial interests exist.
Funding Information
This study was supported by ICES, which is funded by an annual grant from the Ontario Ministry of Health (MOH) and the Ministry of Long-Term Care (MLTC). This study also received funding from the Canadian Institutes of Health Research (CIHR) (no. 148714; no. 160482 through the Canadian Lyme Disease Research Network) and an Early Researcher Award from the Ontario Ministry of Research and Innovation (ER-16-12-200) held by M.A.K. and, in part, by a Canada Research Chair in Economics of Infectious Diseases (CRC-950-232429) held by B.S. Parts of this material are based on data and information compiled and provided by the Ontario Ministry of Health and Long-Term Care (MOHLTC): IntelliHEALTH ONTARIO.
Supplementary Material
Supplementary Table S1
Supplementary Table S2
References
Supplementary Material
Please find the following supplemental material available below.
For Open Access articles published under a Creative Commons License, all supplemental material carries the same license as the article it is associated with.
For non-Open Access articles published, all supplemental material carries a non-exclusive license, and permission requests for re-use of supplemental material or any part of supplemental material shall be sent directly to the copyright owner as specified in the copyright notice associated with the article.