




Abstract
Background:
Yellow fever (YF) is a zoonotic disease transmitted by mosquitoes among humans and nonhuman primates. Although urban YF is eradicated, the sylvatic YF has reemerged in some areas of Brazil in the twenty-first century. From 2016 to 2019, a sylvatic YF epidemic occurred in Southeast Brazil, where it had been eradicated in the 1940s.
Methods:
This study’s objective was to describe the epidemic in the states of the Southeast region, based on descriptive, cluster, and mobility analyses.
Results:
Both the descriptive and cluster analyses showed that the YF cases spread from the state of Minas Gerais southward, causing peaks in cases during the summer months. None of the state capitals was included in the clusters, but the connectivity between the municipalities in Greater Metropolitan São Paulo highlighted potential paths of spread. Despite differences in sociodemographic profiles between the Southeast and North of Brazil (the latter region considered endemic), the epidemiological profile was similar, except for patients’ occupation, which was not related to rural work in the Southeast.
Conclusion:
The results contributed to our understanding of the paths by which YF spread across Southeast Brazil and the epidemiological profile in an area that had gone decades without autochthonous cases.
Introduction
Yellow fever (YF) is a viral infectious disease transmitted by mosquitoes and whose etiological agent is a virus (YFV) belonging to the Flavivirus genus, the same genus as dengue virus (DENV) (Vasconcelos, 2003). The clinical presentation may vary from asymptomatic, oligosymptomatic, or moderate, with nonspecific symptoms such as fever, myalgia, and headache, among others, to severe, with symptoms that include liver and kidney dysfunction, potentially evolving to death, with case fatality of 20% to 50% (Johansson et al., 2014; Monath, 2001; Vasconcelos, 2002). Circulation of the virus is considered endemic in South America and Sub-Saharan Africa, where it accounts for recurrent epidemics, despite the existence of a vaccine that can provide lifelong protection (Bacha and Johanson, 2017; Wieten et al., 2016).
The sylvatic transmission cycle occurs in Brazil, in which the hosts are nonhuman primates (NHP) of various genera and the principal vector is the Haemagogus mosquito (Brasil. Ministério da Saúde, 2017; Carrington and Auguste, 2013; Gomes et al., 2010; Vasconcelos, 2003) and the endemic area is the Amazon region. Until the late 1990s, yellow fever cases in humans were limited to the North and Central-West regions, the latter a transition area. The twenty-first century witnessed an increase in cases outside of this region towards the Southeast and South of the country. Because of this expansion, YFV began to circulate in areas of the Atlantic Forest and Pampas and exposed a large share of the country’s population, living in areas with higher population density and lower vaccination coverage (Abreu et al., 2019a; Pinheiro et al., 2019).
In 2017 and 2018, a sylvatic yellow fever outbreak was identified in humans in the states of Southeast Brazil. Phylogenetic analysis identified Minas Gerais as the source of virus responsible for the epidemic in the states of Espírito Santo and Rio de Janeiro, located on the coastline of Brazil, in the Atlantic Forest biome, where it was introduced several times during the epidemic period (Giovanetti et al., 2020). It is important to understand the paths taken by YFV, seeking to identify the ecological corridors that allowed its spread (Giovanetti et al., 2020), since this understanding can help develop future measures in the prevention and containment of yellow fever outbreaks in the Southeast and assist the understanding of this dynamic in other locations.
This study’s objectives were thus to describe the spatiotemporal evolution and identify spatiotemporal clusters of sylvatic yellow fever cases in humans, as well as to describe the sociodemographic profile and flow of cases (mobility) between municipalities in Southeast Brazil from July 2016 to March 2019.
Methods
Study area
The study area consists of the four states of Southeast Brazil (Minas Gerais, Espírito Santo, Rio de Janeiro, and São Paulo), ranging from latitude 14°S to 25°S and longitude 39°W to 53°W, totaling 1,668 municipalities, with a population of more than 88 million, or 42.0% of the total Brazilian population according to the population projection by the Brazilian Institute of Geography and Statistics (IBGE) for the year 2019. The Southeast region is home to three of Brazil’s six biomes, the Cerrado (Savannah), Caatinga, and Atlantic Forest and has a tropical hot, warm, and mesothermic climate (Cunha et al., 2019; Escosteguy et al., 2019).
Data source
The database containing the deidentified confirmed yellow fever cases for the period from 2016 to 2019 was obtained from the Fala Brasil electronic portal (http://www.consultaesic.cgu.gov.br/busca/dados/Lists/Pedido/Item/displayifs.aspx?List=0c839f31%2D47d7%2D4485%2Dab65%2Dab0cee9cf8fe&ID=1571065&Web=88cc5f44%2D8cfe%2D4964%2D8ff4%2D376b5ebb3bef). This is a spreadsheet with the following variables: Race/skin color, age, occupation, sex, schooling, vaccination status, date of yellow fever vaccination, date of the first symptoms, municipality of residence, and the municipality of likely place of infection (LPI). There were 2,291 cases in all, 22 of which lacked information on likely place of infection and 3 lacked information on date of onset of symptoms and were excluded from the analysis, totaling 2,266 cases.
Data analysis
Data cleaning and analysis were performed in the R language (R Core Team, 2022) with the RStudio 2022.07.2 editor.
For analysis of spatiotemporal evolution, the inclusion criterion was likely place of infection (LPI) in one of the four states of Southeast Brazil, independent of place of residence. The analysis included 2,194 cases, where the spatial unit was the municipality and the time unit was the year’s quarter, with the first quarter defined as January to March.
The spatiotemporal cluster analysis included cases of individuals residing in the Southeast region and whose LPI was also a municipality in the Southeast, totaling 2,160 cases. The spatial unit was the municipality of the LPI, and the date of onset of symptoms was used as the time unit. Cluster analysis was performed in SatScan v10.0.2, and the final maps were produced in QGis 3.22.1. The method chosen for detection of spatiotemporal clusters was Kulldorff’s space-time scan statistic, in which a cylinder scans the area identifying the clusters with the highest risk, where the circle represents the spatial component and the height represents the temporal component, defined as the cluster’s duration (Kulldorff, 1997).
Various sets of area and height parameters were tested, based on knowledge of the vectors’ ecology, incubation time, and evolution of the disease, seeking the most parsimonious set that furnished a result consistent with the thematic map analysis, but without resulting in a high number of clusters. The results shown in this study are clusters without spatial overlapping for the set of parameters: 120 days as the cluster’s maximum duration, or a period of the four rainiest months; and 7 days as the minimum time, greater than the mean YFV incubation period, which is 3 to 6 days (Vasconcelos, 2003), allowing to capture symptomatic cases; and the maximum population contained in the cluster as 15% of the total population with a minimum of 5 cases in each cluster. Using spatial overlapping resulted in a high number of clusters in the same area and similar time intervals, without contributing to the epidemic’s understanding, so these results were not used
Mobility analysis was performed using the same 2,160 cases as in the spatiotemporal cluster analysis. To assess the direction, the municipality of the LPI (source) was connected to the municipality of residence (destination) and the cases were aggregated from July 1st in one year to June 30th in the following year.
Results
Spatiotemporal distribution
The reported yellow fever cases were concentrated mainly in the summer months, from December to March (92%). Figure 1A shows the time series for the Southeast, highlighting 3 periods with occurrence of cases, in the summers of 2017, 2018, and 2019. The number of cases in summer 2019 was less than in other moments and occurred after months without any reported case in humans.
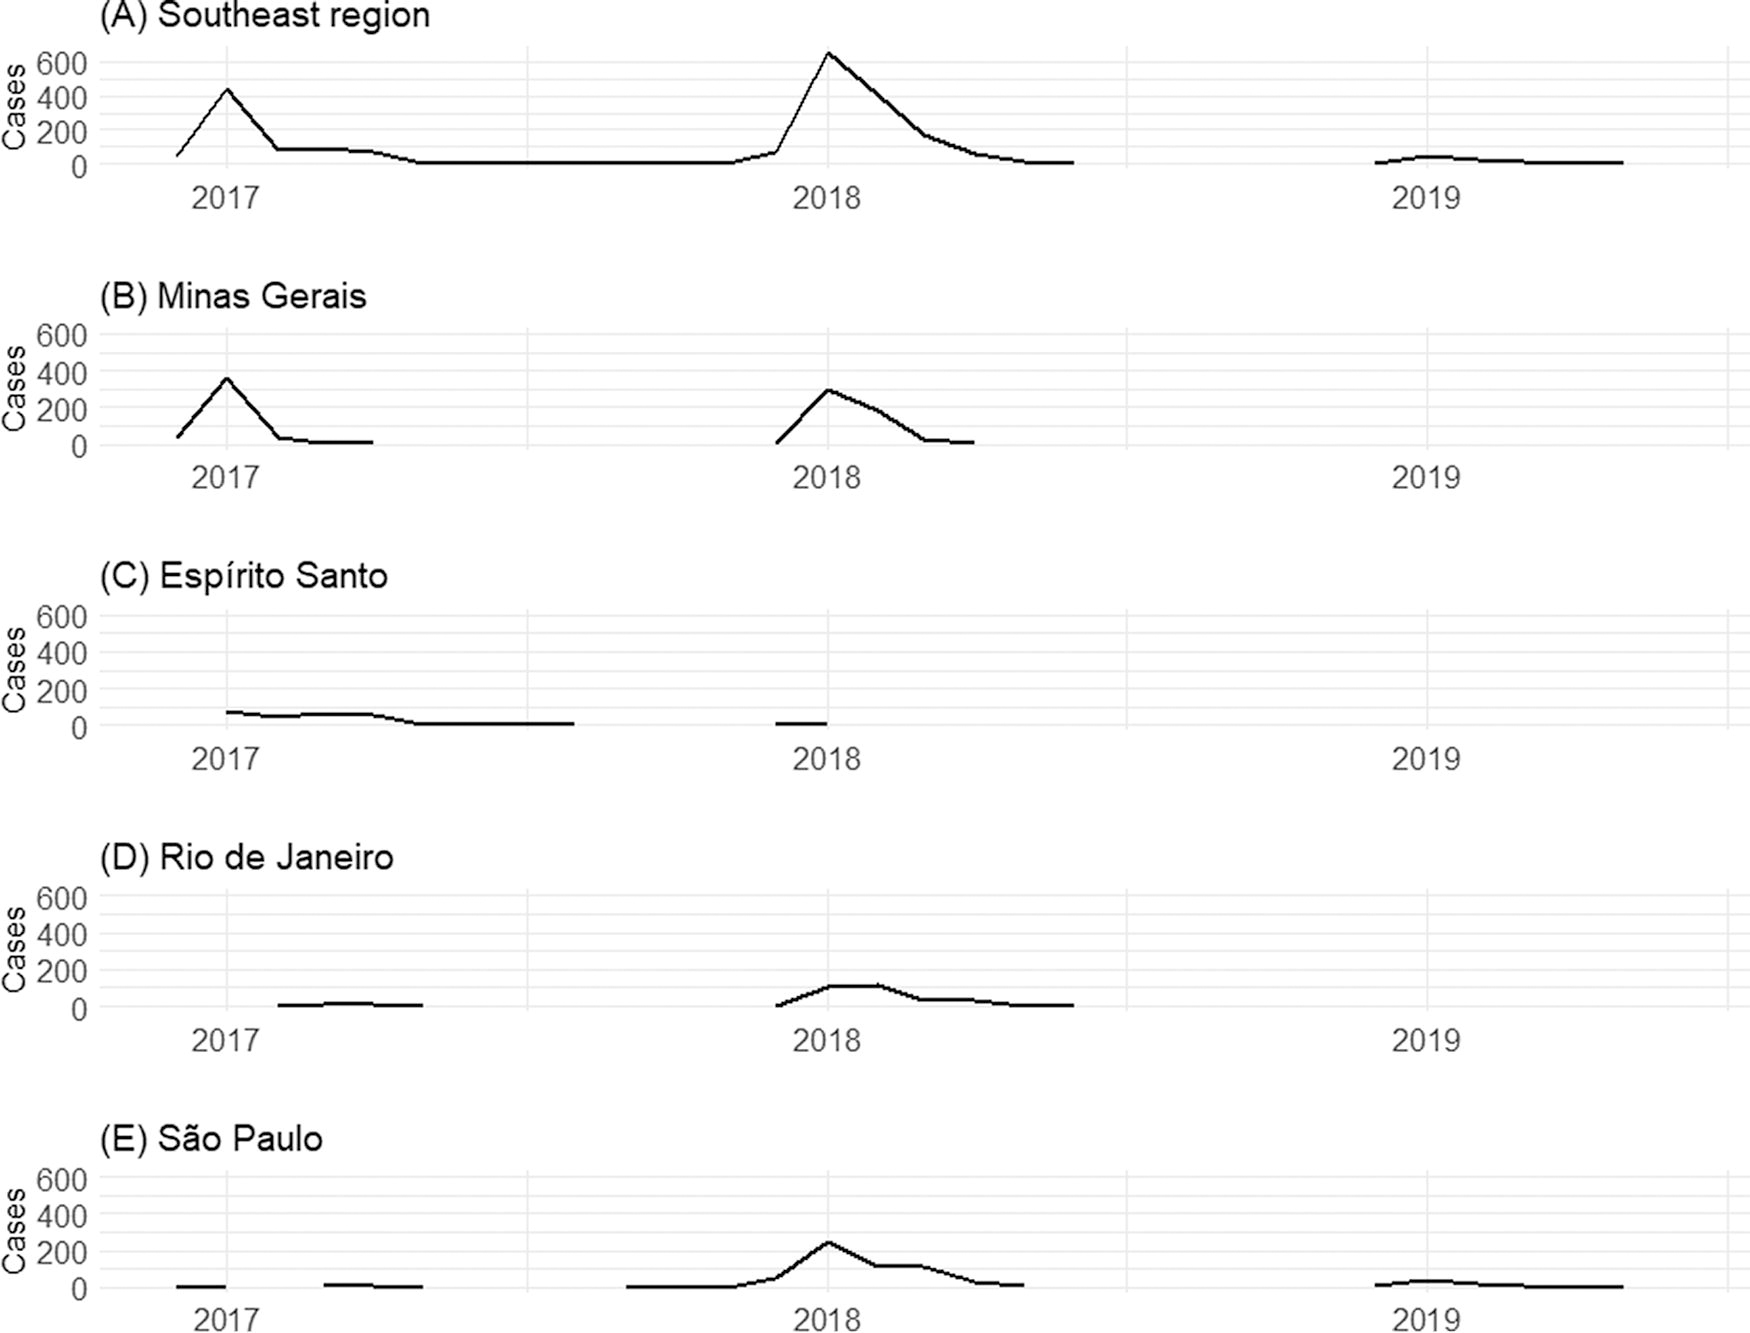
Temporal distribution of yellow fever cases by likely place of infection from December 2016 to June 2019:
Yellow fever in Southeast Brazil showed different temporal distributions in each state. In Minas Gerais (Fig. 1B), cases were concentrated in the early months of 2017 and 2018, mainly in January, with peaks in recorded cases. In Espírito Santo (Fig. 1C), the wave of cases was smaller than in Minas Gerais, but showed a similar temporal distribution, peaking from January to March 2017 and with few reports from December 2017 to January 2018. In Rio de Janeiro (Fig. 1D), few cases were reported in the first semester of 2017, with peak notification in January and February 2018. São Paulo (Fig. 1E), the southernmost state in Southeast Brazil, was the only state that reported cases in 2019, although the peak in the epidemic in this state occurred from January to March 2018.
Figure 2 shows the spatiotemporal distribution of YF in the Southeast by quarter, from the fourth quarter (October, November, and December) of 2016 to the second quarter (April, May, and June) of 2019. The first quarters of 2017 and 2018 were the periods with the most municipalities reporting yellow fever cases in humans, 122 and 217 municipalities, respectively. The difference was the location of these municipalities. In 2017, they were concentrated more in northern Minas Gerais and across the state of Espírito Santo, in the Southeast Atlantic and Eastern Atlantic macro hydrographic basins, in the Atlantic Forest area, or in the transition from the Cerrado to the Atlantic Forest. The year 2018 witnessed a shift to regions more in southern Minas Gerais and to municipalities in the states of Rio de Janeiro and São Paulo, an area in the Atlantic Forest in the Southeast Atlantic and Paraná macro basins. No YF case was reported in Southeast Brazil in the third quarter of 2018. Cases reemerged in the early summer, the last quarter of 2018, and first quarter of 2019, in municipalities in southern São Paulo state, on the border with the state of Paraná, in the South of Brazil.
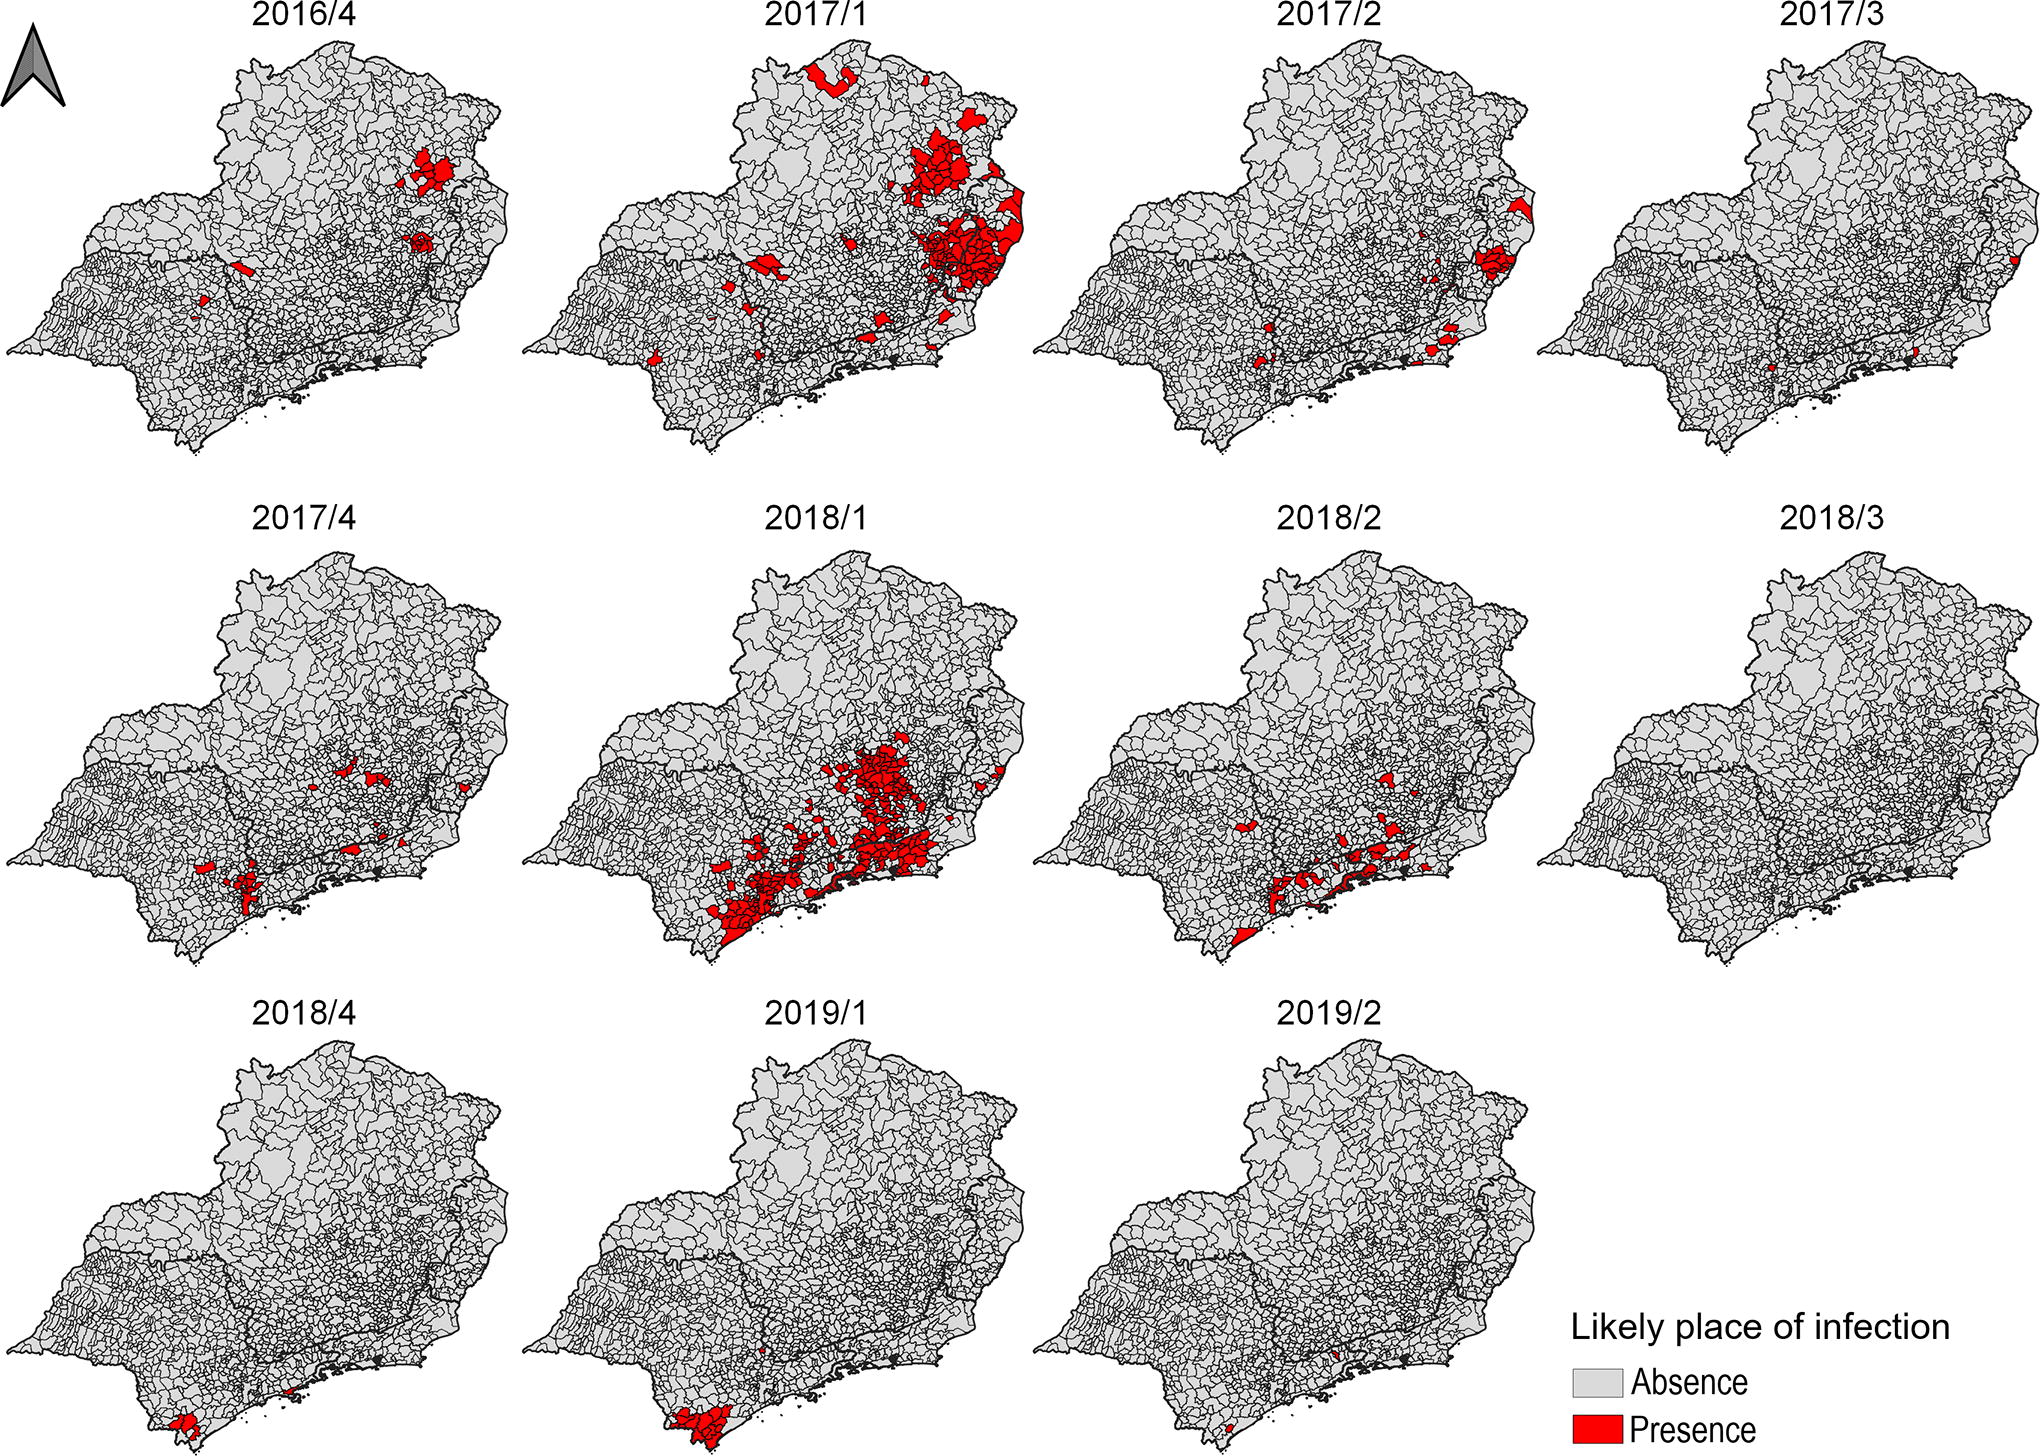
Spatiotemporal evolution of sylvatic yellow fever cases in humans according to likely place of infection in Southeast Brazil from 2016 to 2019.
Spatiotemporal cluster analysis
Spatiotemporal clusters were identified and named according to the micro and meso hydrographic basins in which they were located and period of occurrence (Table 1). They all occurred in the summer, coinciding with the highest precipitation and temperatures. Figure 3 shows the clusters in order of statistical significance (Supplementary Figure S1 shows the clusters overlap with river basins Supplementary Table S1 shows the names of mesoscale river basins and Supplementary Table S2 shows the names of microscale river basins).
Characteristics of Spatiotemporal Clusters of Yellow Fever Cases by Likely Place of Infection, December 2016 to June 2019, Southeast Brazil.
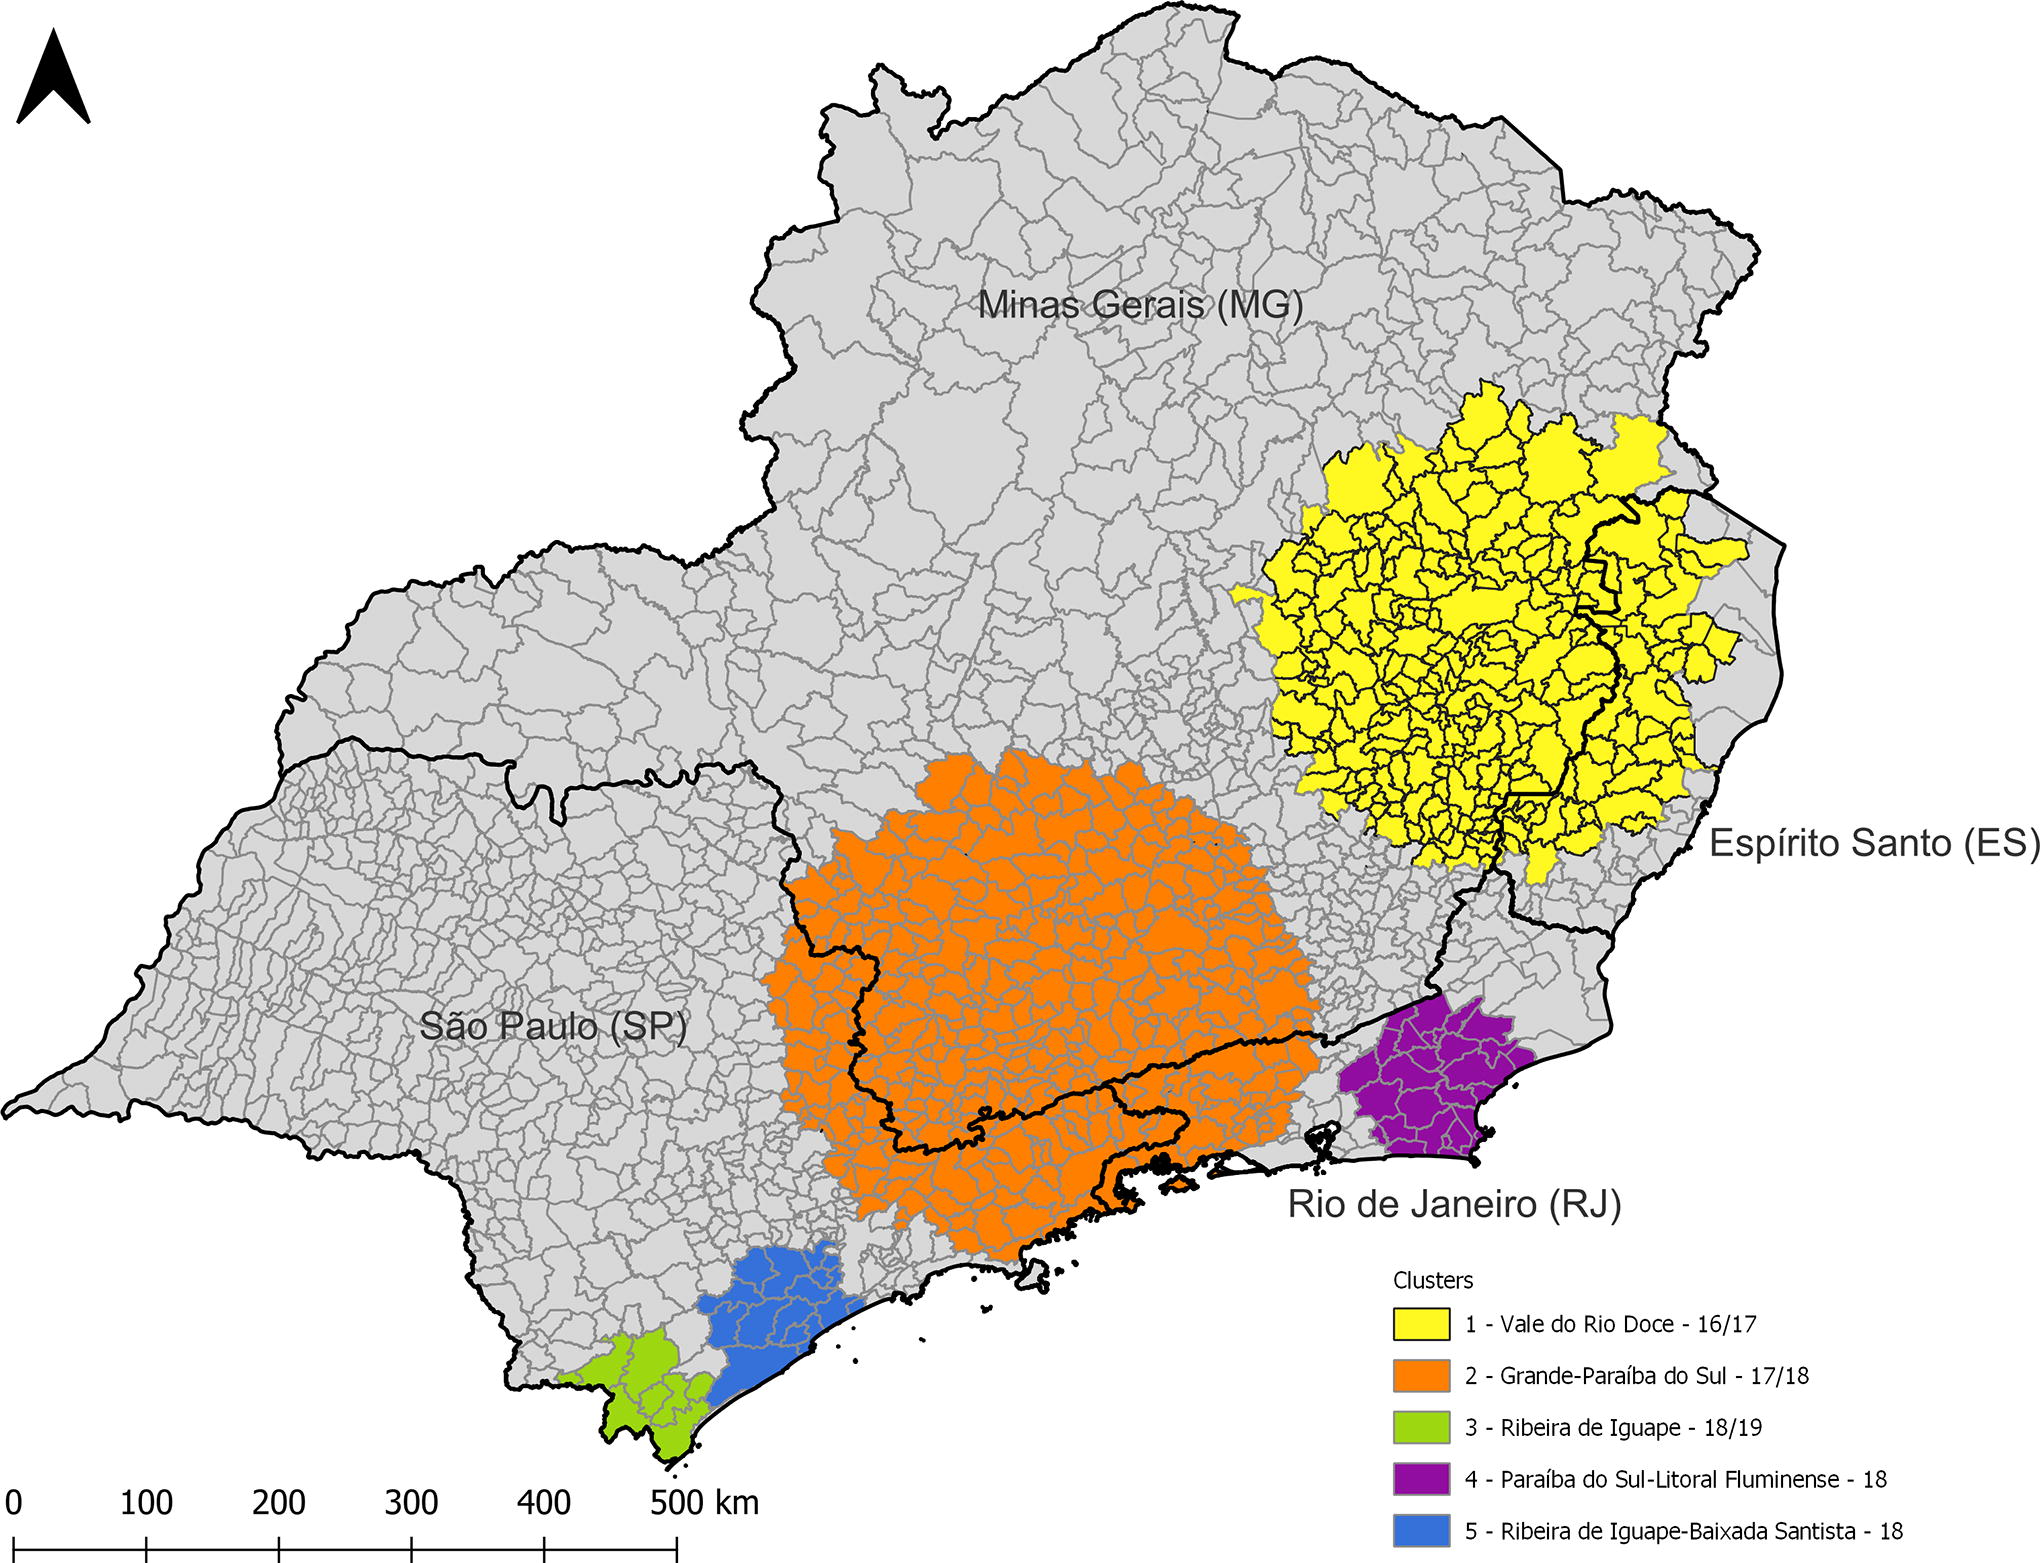
Distribution of spatiotemporal clusters of yellow fever cases by likely place of infection from December 2016 to June 2019, Southeast Brazil.
Cluster 1, Vale do Rio Doce-16/17, occurred in the region with municipalities in the states of Minas Gerais and Espírito Santo from December 2016 to April 2017 (117 days), the first period of the epidemic in the Southeast, and includes 613 cases. In Espírito Santo, cluster 1 includes the Noroeste, Centro-Oeste, Central Serrana, Sudoeste Serrana, and Caparaó regions of the state, and in Minas Gerais, part of the Jequitinhonha-Mucuri region and the entire Rio Doce region, totaling 110,783 km2.
Cluster 2, Grande-Paraíba do Sul-17/18, occurred in the next summer, from December 2017 to April 2018 (113 days), including municipalities in southern Minas Gerais, northeastern São Paulo, and southern Rio de Janeiro. This cluster included the Sul de Minas region and part of the Zona da Mata, Centro Oeste, and Central regions of Minas Gerais state; in Rio de Janeiro, it included the Costa Verde and Médio Paraíba regions and parts of the Centro-Sul Fluminense and Metropolitan regions; and in the São Paulo, the Vale do Paraíba Paulista and Campinas regions and some municipalities in the Macro Metropolitan Paulista region and Greater Metropolitan São Paulo, such as Mairiporã and Arujá. This was the largest cluster, with the largest area (131,710 km2) and largest population (12,558,215). The annual incidence per 100,000 inhabitants was smaller than in the other clusters, despite the higher number of cases, 648 in total.
Cluster 3, Ribeira do Iguape-18/19, in the Litoral Sul Paulista region, occurred from December 2018 to March 2019 (82 days) and included municipalities in southern São Paulo state, on the border with the state of Paraná. Although it reported fewer cases and has a smaller population, it showed the highest annual incidence, with 246.9 cases/100,000 inhabitants.
Cluster 4, Paraíba do Sul-Litoral Fluminense-18, in the Serrana and Baixada Litorânea regions of Rio de Janeiro state, occurred in January and February 2018 (55 days), and covered 28 municipalities with a total resident population of 1,759,810, with 85 reported cases and an annual incidence of 32.1 cases/100,00 inhabitants.
Cluster 5, Ribeira do Iguape-Baixada Santista-18, also occurred in the summer of 2018 and lasted 83 days, including 16 municipalities, with a population of 981,850 and 72 confirmed cases, with an annual incidence of 32.3 cases/100,000 inhabitants.
Most of the total of 2,160 cases were reported in males (82.9%), especially in the 40 to 59-year-age brackets (46.3%), with occupations unrelated to rural work (75.4%). Although the schooling variable showed high incomplete reporting (55.0%), most cases with this information had up to incomplete secondary schooling. As for race/skin color, 38.9% self-identified as white and 34.9% as brown. Approximately 17% of cases had been vaccinated against YFV, more than 60% of whom had been vaccinated 10 days or less before the first symptoms or after their onset. Total case fatality was 34.0%.
Most cases in all the clusters were in males (approximately 80% or more). The most heavily affected age brackets were 40 to 49 and 50 to 59 years, except in the Paraíba do Sul-Litoral Fluminense-18 cluster, where there was a relatively larger share of elderly individuals (60 years of age or older), with 31.8%. As for race/skin color, most of the reported cases were in white individuals, followed by brown individuals, and this order was only reversed in the Vale do Rio Doce-16–17 cluster, where 45.2% of the cases were in browns and 27.1% in whites (Table 2). Incomplete recording of this variable was heterogeneous among the clusters, ranging from 3.4% to 21%.
Sociodemographic Profile, Vaccination Status, and Case fatality in Spatiotemporal Clusters for All Confirmed Cases of Sylvatic Yellow Fever according to Likely Place of Infection from 2016 to 2019, Southeast Brazil
Source: SINAN.
The schooling variable showed a high incomplete recording rate, more than 50% in all the clusters, hindering its analysis. Among the records with this information, the most common level of schooling was incomplete primary (nearly all individuals for whom this information was available had completed secondary school or less). In relation to occupation, in 4 clusters, most of the reported cases were in persons not involved in rural work. The Ribeira do Iguape-18/19 cluster had the highest proportion of individuals doing rural work (farming, livestock, rubber tapping, etc.), with 57.6%, whereas the lowest proportion was in the Grande Paraíba do Sul-17/18 cluster (14.4%).
In Ribeira de Iguape-18/19, 30.5% of cases (n = 18) had been vaccinated against YFV, a higher proportion than in the other clusters, possibly due to the vaccination campaign. Of the 18 vaccinated individuals, only 3 had been vaccinated more than 10 days before the first symptoms. As for case fatality, clusters 1, 2, 4, and 5 showed rates of 30.2%, 34.1%, 40.0%, and 43.11% respectively, whereas cluster 3 showed the lowest case fatality rate, 18.6% (Table 2).
Spatial mobility analysis of YF cases
Figure 4 shows the mobility maps for yellow fever cases, with arrows connecting the pair of municipalities, from LPI (source) to municipality of residence (destination) (Supplementary Table S1), since infected persons can act as hosts and favor spread to places with favorable conditions for YFV circulation (Supplementary Table S3).

Mobility map of yellow fever cases connecting likely place of infection to the municipality of residence:
In the 2016–2017 period (Fig. 4A), most of the arrows were from Minas Gerais to São Paulo, mainly the region of the Vale do Rio Doce-16/17 cluster to the city of São Paulo. Arrows were also seen pointing to Vitória, capital of Espírito Santo state. Besides these connections, there were others between municipalities within the same cluster.
In the following period, 2017–2018 (Fig. 4B), the main flows were observed from the cluster areas to the state capitals of Rio de Janeiro, São Paulo, and Minas Gerais, besides intracluster connections. Figure 4D shows an approximation of the Greater Metropolitan and Macro-Metropolitan São Paulo areas, where the flows are more intense, with the highest numbers of cases moving from the LPI to the city of São Paulo.
The last period, 2018–2019, shown in Figure 4C, also represents the mobility flows from the municipalities of the clusters to the city of São Paulo, besides intracluster connections. Thus, all the periods displayed flows connecting cluster areas to the state capitals.
Discussion
This study aimed to describe the spatiotemporal dynamics of yellow fever in Southeast Brazil from 2016 to 2019, which encompasses the years of the epidemic in the region’s 4 states, in addition to establishing the sociodemographic profile of reported cases. Based on Kulldorff’s space-time scan statistic, the study’s findings corroborate previous phylogenetic analyses on the direction of the spread of the yellow fever epidemic, which originated in the state of Minas Gerais and spread to the other states of Southeast Brazil and toward the country’s South region (Cunha et al., 2019; Giovanetti et al., 2020). The clusters described in this study showed a cluster connecting Minas Gerais to São Paulo and to Rio de Janeiro (Grande-Paraíba do Sul-17/18) and another connecting Minas Gerais to Espírito Santo (Vale do Rio Doce-16/17), suggesting that Minas Gerais was the source of YFV for other states of the Southeast. The other clusters were situated in just one state, suggesting conditions of persistence and transmission. Phylogenetic analyses showed that YFV was introduced several times in Rio de Janeiro and Espírito Santo, where it persisted until 2019, even outside the transmission period, but only once in São Paulo (Cunha et al., 2019; Giovanetti et al., 2020).
Patients’ sociodemographic profile was similar to that observed historically in Brazil, consisting mainly of young males with low schooling (Escosteguy et al., 2019; Ho et al., 2019; Kallas et al., 2019; Moussallem et al., 2019; Tuboi et al., 2007; Vasconcelos, 2002), but differed about occupation, since majority was nonrural workers. This difference could be explained by infected monkeys in urban green spaces The case fatality rates were high, as reported previously (Alves, 2020; Tuboi et al., 2007; Vasconcelos, 2002), and demonstrated not only the severity of the disease but also the health teams’ lack of preparedness to deal with a new disease in the territory. The Vale do Rio Doce-16/17 cluster differed from the others in terms of patients’ race/skin color and occupation, which may be because of the presence of a rural population in small towns (fewer than 10,000 inhabitants).
Until 2017, Brazil was divided into two areas for YFV vaccination: One with recommendation of vaccination because of circulation of YFV or as a transition area, and the other without such recommendation. In Southeast Brazil, parts of the states of Minas Gerais and São Paulo were included in the area with recommendation of vaccination, and the vaccine was available in 2 doses for children younger than 5 years or a single dose in adults. Until 2017, Rio de Janeiro and Espírito Santo were not recommended for vaccination and had low vaccination coverage (1.8% and 13.5%, respectively) (Brasil. Ministério da Saúde, 2023). In 2018, because of the epidemiological scenario, the Ministry of Health, in cooperation with the states of São Paulo and Minas Gerais, launched a vaccination campaign with a fractionated dose, a strategy used previously in Africa to prevent YFV circulation and spread (Mendes, 2018). The reduction in the case fatality rate in cluster 3, Ribeira de Iguape-18/19, the last to occur, may suggest more sensitive surveillance, capable of detecting milder cases rather than only severe ones, or the effect of the vaccination campaign beginning in 2018, even with partial protection, since most of the people who developed the disease had been vaccinated less than 10 days before the first symptoms.
The mobility patterns between LPI and municipality of residence emphasize the connectivity between the clusters and state capitals, municipalities in Minas Gerais and municipalities in other states, and connectivity between Greater Metropolitan São Paulo and the Macro Metropolitan Area of São Paulo, probably because of tourism activity in summer. This underlines the need for yellow fever vaccination throughout the territory as a protective measure. Human mobility between areas with and without YFV circulation may be important for establishing the disease in new locations, accelerating its spread and favoring the pathogen’s persistence, especially in areas with favorable conditions for transmission (presence of competent vectors and susceptible hosts), as demonstrated by studies that include human mobility in the investigation of spread and persistence of vector-borne diseases (Adams and Kapan, 2009; Cosner et al., 2009; Stoddard et al., 2009).
The scenario described above was observed in most of the study area in which there was no recommendation for vaccination in the regular immunization calendar until 2018, but where human and nonhuman primate hosts were present, as well as competent mosquito vectors in the urban and sylvatic environments. Interestingly, despite the potentially favorable conditions for YFV in the state capitals, none of them was part of a cluster, nor was urban transmission observed (Abreu et al., 2019b; Moreira-Soto et al., 2018). These observations raise discussions concerning the vector competence of Aedes aegypti in the presence of other arboviruses such as DENV and cross-immunity between arboviruses. There is evidence of the susceptibility of Aedes aegypti to YFV and its action as a vector (Johnson et al., 2002; Souza-Neto et al., 2019). In the presence of DENV, coinfection or subsequent infection, there is interference in YFV replication, affecting its transmissibility (Abrao and Da Fonseca, 2016). In addition, the epidemic years for YF were the ones with the lowest numbers of reported dengue cases following the epidemic years, 2015 and 2016 (Almeida et al., 2023; Andrioli et al., 2020). A flavivirus infection is known to be capable of offering temporary immunity to other flaviviruses, due to cross-reactivity in the antibody response (Endale et al., 2021; Rathore and St. John, 2020), so the population might be partially protected due to the dengue epidemic years that preceded the YF epidemic. These two factors may help explain why the urban YF transmission cycle was not reestablished.
The limitation of Kulldorff’s space-time scan statistic is the fact that it does not allow distinguishing between land use forms, thus including uninhabited areas and those without notified cases, since they are both inside the same scanning radius. Notwithstanding, it serves as an important rapid and inexpensive tool since it allows identifying the spatiotemporal evolution of the target phenomenon.
Conclusion
The study’s results contribute to our understanding of the spatiotemporal dynamics of the YF epidemic in Southeast Brazil from 2016 to 2019, besides filling knowledge gaps on the sociodemographic profile of YF cases. It is thus important both for understanding what happened and to help prepare actions to prevent and contain future outbreaks, as necessary.
Footnotes
Acknowledgment
We would like to thank the Epidemiology in Public Health Program/Fiocruz and CAPES for financial support.
Authors’ Contributions
All authors contributed to study conception and design, data collection, analysis and interpretation of results, and article preparation.
Author Disclosure Statement
No conflicting financial interests exist.
Funding Information
M.M.R. received a PhD scholarship by Coordination for the Improvement of Higher Education Personnel (CAPES). C.T.C. received grants from CNPq (Sinbiose 2019) and Fiocruz INOVA.
Supplementary Material
Supplementary Figure S1
Supplementary Table S1
Supplementary Table S2
Supplementary Table S3
References
Supplementary Material
Please find the following supplemental material available below.
For Open Access articles published under a Creative Commons License, all supplemental material carries the same license as the article it is associated with.
For non-Open Access articles published, all supplemental material carries a non-exclusive license, and permission requests for re-use of supplemental material or any part of supplemental material shall be sent directly to the copyright owner as specified in the copyright notice associated with the article.
