
Abstract
Background:
Between January 1, 2011, and December 31, 2017, over 12,000 case reports of Lyme disease (LD) were submitted to the California Reportable Disease Information Exchange for further investigation. The number of case reports has tripled compared to previous years, emphasizing the need for efficient estimation and classification methods. We evaluated whether estimation procedures can be implemented in a low-incidence state such as California to correctly classify a case of LD, similar to those procedures used in high-incidence states.
Objective:
The purpose of this study was to identify whether a minimum number of variables was sufficient to reliably classify cases in California and potentially reduce workload while maintaining the ability to track LD trends in California.
Methods:
To determine the relative value of diagnostic information, we compared five candidate logistic regression models that were used to classify cases based on information that varied in its degree of difficulty for collection.
Results:
Our results using California’s surveillance data showed that automatically reported data were not sufficient, additional information such as, a patient’s clinical presentation and travel history were necessary in a low-incidence state to improve the overall sensitivity of the models.
Conclusion:
This study may help inform public health surveillance efforts by demonstrating that both clinical and travel information are required to accurately classify a case of LD in a low-incidence state.
Introduction
Lyme disease (LD) is the most commonly reported vector-borne disease in the United States (Kugeler et al., 2021; Schwartz et al., 2021). LD, caused by the bacterium Borrelia burgdorferi, is transmitted to humans through the bite of infected black-legged ticks, namely Ixodes scapularis in the midwestern and eastern United States and Ixodes pacificus in the western United States, particularly in parts of California (Barbour and Benach, 2019; Burgdorfer et al., 1982; Clover and Lane, 1995). Reporting of LD cases for public health surveillance was mandated in California since 1989 (Werra, 1991) and nationally in the United States in 1991 (Orloski et al., 2000). The purpose of LD surveillance is to assess changes in incidence, monitor for geographic expansion of LD, and inform preventive strategies for health care providers and the public.
Most nationally notifiable conditions are reported according to a standardized surveillance case definition, established by the Council of State and Territorial Epidemiologists (CSTE). Standardized surveillance case definitions enable public health officials to classify and count cases consistently across states and local reporting jurisdictions (Centers for Disease Control and Prevention, 2021). Cases are typically classified as confirmed, probable, suspect, or not a case. The surveillance case definition for LD requires a combination of information such as laboratory support, clinical evidence, and epidemiological factors such as travel to endemic areas within a relevant time period (Centers for Disease Control and Prevention, 2021).
The California Reportable Disease Information Exchange (CalREDIE) is a secure system used by state and local health departments (LHDs) for electronic disease reporting and surveillance in California (CDPH, 2023a). In 2011, CalREDIE incorporated electronic laboratory reporting (ELR) to enhance the timeliness with which cases of some diseases are reported. Since then, California has seen provisional LD cases reported with positive laboratory results tripled compared to the years prior to the implementation of ELR. Because LHDs must investigate all reported positive lab reports to gather the pertinent information needed to classify a case of LD, many reports are not classified as confirmed or probable cases due to a lack of personnel to perform the necessary investigative work.
Estimation sampling approaches based upon laboratory reports for LD surveillance in high-incidence states, such as New York, New Jersey, and Massachusetts, were found to be a good estimate of LD incidence, while not implemented remains a good alternative surveillance method (Bjork et al., 2018; Lukacik et al., 2018). The objective of this study was to assess whether estimation procedures similar to those used in high-incidence states could be implemented in a low-incidence state such as California. This study compared candidate models for LD case classification to determine the predictive value of routinely reported electronic laboratory data alone or in combination with tick surveillance data, human clinical data, and travel information. Five predictive models were developed with progressively increasing complexity of data collection by introducing additional variables, including those requiring further investigation. The performance of each model was evaluated to identify the most efficient one, with the goal of accurately classifying LD cases using the minimum necessary information.
Materials and Methods
Surveillance data (human)
LD surveillance data were obtained from the CalREDIE database from January 1, 2011, through December 31, 2017, and included data from all California counties. The California Department of Public Health (CDPH) data were de-identified of all personal identifiers. The variables included in the analysis were demographic information, such as sex and age, which are predictors of LD (Mead, 2015) and were fields that are either routinely collected through ELR or easily collected from patient records. Episode date was also collected which is the earliest date associated with the record (typically date of illness onset but may also be date of diagnosis or date of diagnostic test) and was used to represent the seasonal distribution of illness onset. Other variables included were diagnostic testing results, specifically a positive immunoglobulin G (IgG) western blot. The study utilized the LD surveillance case definitions from 2011 and 2017 (Centers for Disease Control and Prevention, 2021). A positive IgG western blot alone was included in the models as the laboratory variable as it was considered in the 2011 and 2017 LD case definition as confirmatory laboratory support was more reliably collected than the enzyme immunoassay (EIA) and immunoglobulin M (IgM) western blot combination adheres with the objective of the study, which is to evaluate the most reliably variables collected to classify a case. Two clinical variables were considered: (1) a physician-diagnosed erythema migrans (EM) rash ≥5 cm (clinical variable 1 = EM ≥ 5 cm) in diameter and (2) disseminated symptoms (clinical variable 2 = disseminated symptoms), defined as LD affecting multiple systems such as the muscles, joints, heart, and brain (Centers for Disease Control and Prevention, 2024). A history of travel outside of California during the incubation period (30 days prior to onset) was also considered as a candidate variable in the models.
The following characterizes the CSTE LD surveillance case definition for 2011 and 2017: (1) a confirmed case is defined as an EM rash ≥5 cm with a known exposure (2011 case definition) or high-incidence state (2017 case definition) (Centers for Disease Control and Prevention, 2021), or an EM rash ≥5 cm with laboratory evidence; (2) a probable case is defined as a physician diagnosis of LD with laboratory evidence; and (3) a suspect case is defined as laboratory evidence of LD with no accompanying clinical information (Centers for Disease Control and Prevention, 2021). The key difference between the 2011 and 2017 LD surveillance case definitions mainly pertains to the exposure section; a 2011 confirmed case included an EM rash ≥5 cm with a known exposure, whereas the 2017 confirmed case had an EM rash ≥5 cm in a high-incidence state as defined by the CDC (Centers for Disease Control and Prevention, 2021).
The analysis included case reports for California residents reported for LD with either a positive laboratory test or via provider information in CalREDIE from the years 2011 to 2017. Case reports were considered for the analysis if they had complete case records for all variables used in the models and were classified as one of the four levels of classification: confirmed, probable, suspect, or not a case (Centers for Disease Control and Prevention, 2021). All case reports were classified using the CSTE surveillance case definition at the time they were reported; either the 2011 or 2017 surveillance case definition. The case classifications confirmed, and probable was combined into a single category as “notifiable” (as these are the cases included in the national surveillance data), while “not a case” was categorized as “not notifiable.” The suspect classification was excluded from the final analysis as suspect cases could potentially be reclassified as confirmed or probable following further investigation.
Surveillance data (tick)
The CDPH has been formally conducting tick surveillance for I. pacificus since the 1980s. I. pacificus has been found in 56 of the 58 counties in California (CDPH, 2022; Padgett et al., 2014). For purposes of this analysis, tick data were collated from the Vector-Borne Disease Section annual reports published each year by CDPH covering the years 2000–2019 (CDPH, 2023b), focusing on adult ticks collected across counties in California. Adult ticks were collected from an average of 20 counties a year (range 11–33 counties) (CDPH, 2023b). Nymphal tick data were excluded due to the smaller volume of data over the full 20-year period. The dataset included fields for the county of tick collection, the total number of ticks collected, and the number of ticks that were tested for B. burgdorferi sensu lato.
The minimum infection prevalence (MIP) in each county was calculated for adult ticks and was defined as ([number of positive tick pools]/[total number of ticks tested]) × 100 (Padgett et al., 2014). A tick pool ranged from 1 tick to 10 ticks, and the pool was classified as positive if at least one tick tested positive for the pathogen (Padgett et al., 2014).
Predictive Models
The dependent (outcome) variable was categorized into a binary variable: notifiable (confirmed or probable) and not notifiable. Five different predictive models were created using logistic regression, each successively building upon the other using routinely reported data from CalREDIE, or information that requires investigative follow-up by LHDs. Model 1 consisted only of positive IgG western blot data. Model 2 added demographics and tick data. Model 3 consists of all variables in model 2 and added clinical information, which requires further investigation by the LHD. Model 4 consisted of all variables from model 3, but replaced clinical information with travel information, which also requires further investigation by the LHD. The full model, which included all variables from models 1 to 4, was anticipated to yield the most accurate estimations. Therefore, all subordinate models were compared to this comprehensive model (Table 1).
Automatic and Investigated Variables Included in Each Predictive Model
 Automatically reported data CalREDIE.
 Collected data Vector-Borne Disease Section.
 Further investigation needed by LHD CalREDIE.
MIP = (Number of positive tick pools)/(number of total ticks tested) × 100.
Positive EM = erythema migrans ≥5 cm, disseminated symptoms or late manifestations.
The following figure shows each predictive model (1–4) and the full model representing the gold standard. Each model builds upon one another with the minimal collected information to the full model that contains the maximum information. All models contain automatic laboratory-reported test results and demographic information. Models 3 and 4 and the full model build upon model 2 with additional information and clinical to travel which further investigation is required by the local health department.
CalREDIE, California Reportable Disease Information Exchange; LHD, local health departments.
Statistical Analysis
Frequencies and percentages of key predictors were presented for notifiable and not notifiable cases and compared using a chi-squared test. Logistic regression was used as the main approach to create the prediction models described in Table 1. To avoid evaluating the performance of the model on the exact same data to which models were fitted, 10-fold cross-validation was used to estimate performance of the predictive models. Our data were randomly partitioned into approximately 10 equal groups (folds). Through the 10-fold cross-validation, each model was fit nine times on a training set (comprised of 90% of the data) and then evaluated on a test set (remaining 10% of the data). For each predictive model, a receiver operating characteristic (ROC) curve was created for each of the 10 test sets. The ROC curve was created by plotting the true-positive rate (sensitivity) against the false-positive rate (1-specificity) (Carter et al., 2016). For each model, sensitivity, specificity, positive predictive value (PPV), negative predictive value (NPV), accuracy, and area under the curve (AUC) were calculated for each test set and then averaged across the 10 test sets for an overall estimate. An AUC of 1 represents a perfect predictive model and an AUC of 0.5 represents a failed predictive model, that is, no better than chance (Baratloo et al., 2015; Carter et al., 2016). To measure the level of agreement between predictive models and the full model, a Cohen’s kappa statistic was used. McNemar’s test was used to test if predictions from different models for the same individuals differed from each other.
Results
Between January 1, 2011, and December 31, 2017, 12,419 LD case reports were submitted to CalREDIE. After removing all duplicate records and suspect cases, a total of 11,656 unique case reports remained for the final analysis. Of the 11,656 records, 787 (7%) were notifiable (confirmed [599] and probable [188]), and 10,869 LD records were classified as not notifiable. During 2011–2017, case counts of LD were highest among the age group 45–59 years, accounting for 22.4% of all notifiable cases. The age group 0–14 years had the next highest case counts making up 19.6% of all notifiable cases (Table 2). Each of the age groups 30–44 years and 60–74 years accounted for about 19% of notifiable cases. Over 50% of notifiable cases were male. About one-third (30.1%) of notifiable cases in California were related to travel to a high-incidence state. Approximately 50% of the notifiable cases had a positive IgG western blot. Thirty-one percent of notifiable cases had a physician-diagnosed EM ≥ 5 cm in diameter, and over 50% of notifiable cases had at least one disseminated symptom (Table 2).
Model Variables by Notifiable and Not Notifiable Case Reports
Statistically significant with p < 0.05 between notifiable versus not notifiable.
High-incidence state
Low-incidence state <10 cases per 100,00 in 3 consecutive years.
EM, erythema migrans; MIP, minimum infection prevalence.
Model Performance
Results of each of the five prediction models for one of the training sets are provided in supplemental section (Supplementary Table S1). All models had high specificity and NPV > 95% (Table 3). The model that performed the best across the diagnostic metrics was the full model, which had the highest sensitivity at 67.4% compared to all other models. The specificity for the full model was 99.1%, similar to models 3 and 4. The full model had the highest PPV of 84.5% compared to the other models. However, model 3 had the highest accuracy at 97.1% (Table 3). The kappa statistic for model 3 compared to the full model was 0.85, indicating strong agreement (Supplementary Table S2). However, McNemar’s test between model 3 and the full model was not statistically significant (p = 0.15), indicating there was insufficient evidence to suggest differences in the predictions from these two models. The kappa statistic for model 4 compared to the full model was 0.80 and was statistically significant (p ≤ 0.001) indicating differences in the predictions between the two models (Supplementary Table S2). The ROC analysis demonstrated that the full model, which requires further follow-up to collect clinical and travel information, had the highest AUC value of 0.97 among all the other predictive models (Table 3, Fig. 1).
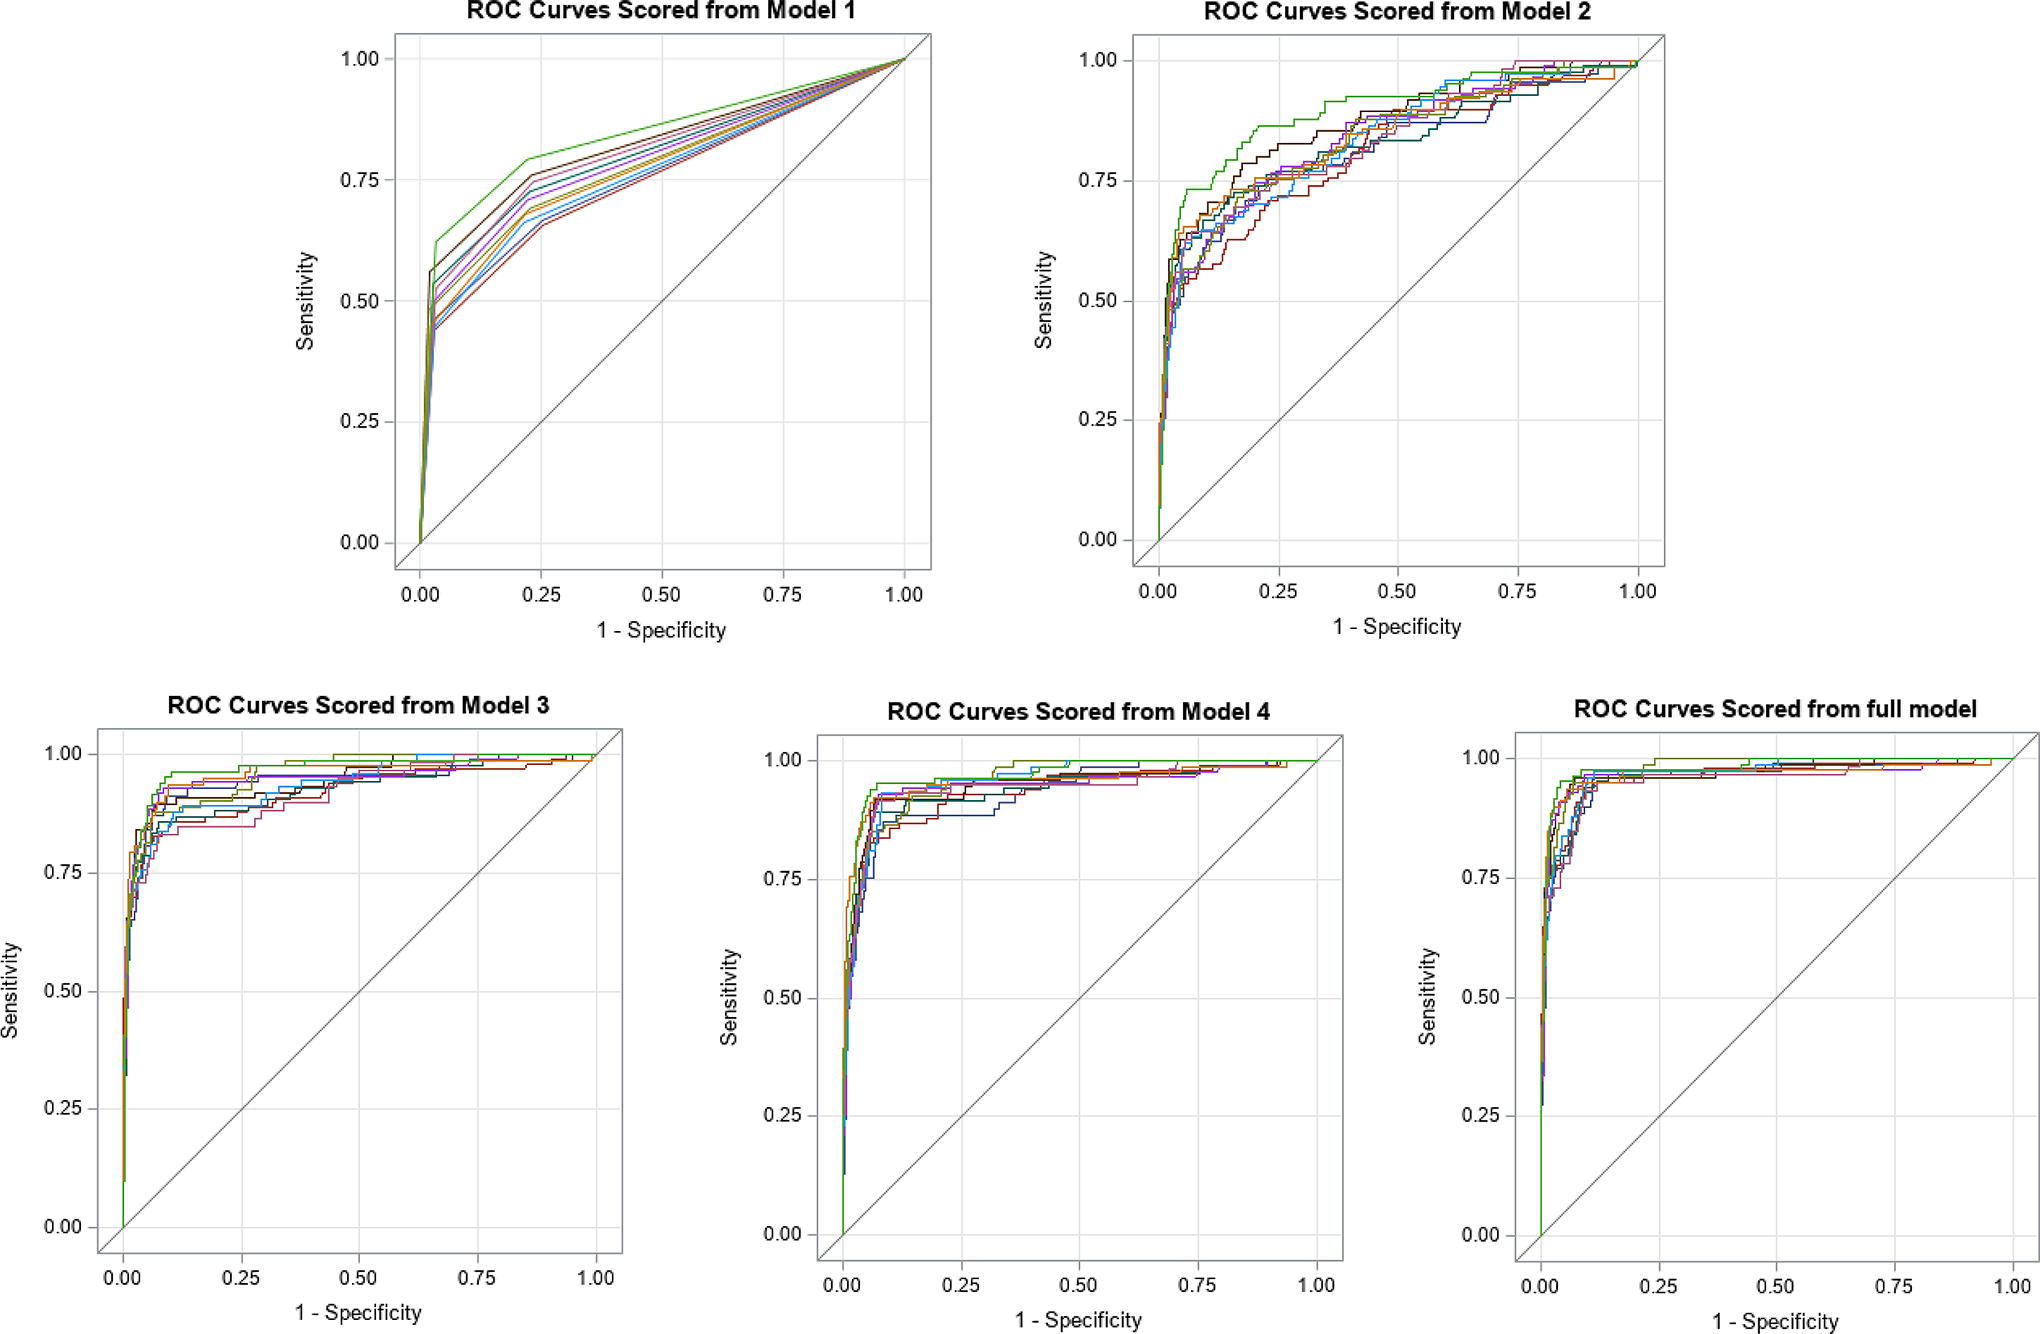
ROC curves for models 1–4 and full model: represents the ROC curves of the models 1–4 and full model. Models 1–4 and full model compare the 10 iterations that were performed in the testing with 10-fold cross-validation. Models 1 and 2 do not require further investigation, and all variables are automatically reported in CalREDIE. Models 3 and 4 and full model do require further investigation to obtain clinical and travel information. CalREDIE, California Reportable Disease Information Exchange; ROC, receiver operating characteristics.
Average Characteristics of Each Predictive Model
Average was calculated across the 10 test sets for each model.
The full model represents the gold standard.
Discussion
This study modeled various sets of LD surveillance data augmented with tick surveillance data to evaluate whether a minimal amount of case information could reliably classify LD cases reported in a low-incidence state. The predictive modeling results indicated that using a smaller subset of data elements (models 1–4) did not yield the same predictive value as the full model. It was determined that incorporating both clinical and travel information was essential for accurate case classification.
With over 1000 case reports submitted through CalREDIE across all of California, between 100 and 120 LD cases are reported statewide each year. Of these, approximately 30% involve travel, with about 74% of those travel-related cases linked to exposure in the northeastern United States (CDPH, 2023b). Studies of LD cases reported in Florida, Utah, South Carolina, and Washington during 2005–2009 showed that over 80% of cases had recently traveled to a high-incidence state (Forrester et al., 2015). Although the incidence of LD in California is low with approximately 100 confirmed cases reported annually (0.2 cases per 100,000 population) (CDPH, 2023b), the state’s ecological diversity contributes to focal high-endemic regions, where human incidence ranges from 1.1 to 6.2 cases per 100,000 population per year (Eisen et al., 2006b; Eisen et al., 2006c; Lane et al., 1992; Ley et al., 1994). Consequently, travel information is crucial for accurately assessing exposure risk in California.
Diagnosing LD in a low-incidence state is challenging due to the low pretest probability, where the NPV is higher than the PPV (Brett et al., 2014). In our study, the NPV of the predictive models ranged from 95.8% (model 2) to 97.7% (full model). The sensitivity of the predictive models ranged from 49.9% (model 1) to 67.4% (full model), and this may be affected by using a single positive IgG western blot, which can impact model performance. To enhance the overall sensitivity of predictive models, consistent collection of diagnostic tests (EIA followed by IgM or IgG western blots) for both acute (IgM) or late LD (IgG) is essential (Branda et al., 2017; Branda et al., 2011; Sfeir et al., 2022). Our study demonstrated that relying solely on a single IgG western blot (Centers for Disease Control and Prevention, 2021) was insufficient for estimating LD incidence in California. Sensitivity and specificity may also vary with disease prevalence (Leeflang et al., 2013; Leeflang et al., 2009). In California counties where LD risk is low, a positive LD serologic test may have limited diagnostic value (Forrester et al., 2015; Seltzer and Shapiro, 1996). The full model had the highest PPV, and the highest sensitivity underscoring the importance of incorporating both travel and clinical information for accurate LD classification. However, further investigative resources are needed to obtain the higher PPV, which can be resource intensive for LD surveillance in a low-incidence state, potentially making the costs outweigh the benefits of increased accuracy (Rutz et al., 2018).
This study is focused on adult tick surveillance data because nymphal tick data were sporadically collected from 2000 to 2019. Relying solely on adult tick surveillance data has several limitations, including an incomplete representation of tick epidemiology, seasonal distribution, and infection prevalence (Clover and Lane, 1995). Nymphal tick data would be more informative since nymphal ticks pose the highest risk of LD transmission to humans (Eisen et al., 2010; Kilpatrick et al., 2017; Swei et al., 2011). Furthermore, nymphal ticks might serve as a more accurate predictor of human disease, as demonstrated in the eastern US (Diuk-Wasser et al., 2012). Human tick exposure risk depends on where people spend time outdoors, which can be challenging to ascertain (Eisen et al., 2006c). Consequently, adult tick data are not a reliable resource to augment human surveillance LD data in California.
The surveillance data analyzed in this study were subject to inherent limitations. Surveillance practices vary widely between county public health departments in California due to wide differences in funding, staffing, and other resources. For example, some counties investigated all provisional case reports, others investigated only a few, and some did not investigate any provisional case reports. Crucial information, such as clinical and travel history, was missing in many case reports. Variation in surveillance practices in an overall low-incidence state like California can drastically impact incidence data, especially because LD risk can vary widely both between and within California counties (Eisen et al., 2006b; Eisen et al., 2006a; Lane et al., 1992; Ley et al., 1994). While logistic regression models were used in this study, other more sophisticated machine learning approaches, such as random forest, decision trees, or ensemble learning, could have been employed for future work.
Last, our model validation utilized California’s surveillance data, with both the training and testing sets drawn from the same data source. Therefore, our study results may not be generalizable to other low-incidence states for LD. To ensure the applicability of our findings to other low-incidence states, an external data source, such as surveillance data from another low-incidence state, would need to be used to validate our findings in those areas.
Conclusion
This study demonstrated that model-based prediction of LD case status using minimal information, without clinical and travel history, does not yield reliable classification of notifiable cases in California. The inclusion of clinical and travel information is crucial for accurate case classification, as these details are key to understanding disease patterns and exposure risks in a low-incidence state. Further research is needed to evaluate the effort required to consistently collect this essential information across all health jurisdictions, estimate the costs involved, and ensure that the resulting epidemiological data fulfill the primary goals of surveillance.
Footnotes
Acknowledgment
The authors would like to acknowledge Dr. Curtis Fritz from the California Department of Public Health for his helpful input and review of this article.
Portions of this article are based on materials from primary author’s PhD dissertation, A tale of two borreliae: An epidemiological study of Borrelia burgdorferi sensu stricto and Borrelia miyamotoi in California, submitted by Sharon I Brummitt, PhD, to University of California, Davis, granted December 2021. ![]()
Ethics Approval
De-identified CDPH surveillance data for LD were analyzed for this study. The study was determined to be exempt from human subjects’ review by the Institutional Review Board, the University of California Davis (Protocol number 1090480-1_revised11062017, FWA No: 00004557), and by the California Health and Human Services Agency’s Federal wide assurance #00000681, Project number: 17-06-3028.
Disclaimer
The findings and conclusions in this article are those of the author(s) and do not necessarily represent the views or opinions of the California Department of Public Health or the California Health and Human Services Agency.
Author Disclosure Statement
The authors have no conflicts of interest to declare. All coauthors have seen and agree with the contents of the article, and there is no financial interest to report. The authors certify that the submission is original work and is not under review at any other publication.
Authors’ Contributions
S.I.B.: Conceptualization (lead), Data Curation (equal), Formal Analysis (lead), Investigation (lead), Methodology (equal), Project Administration, Visualization, Writing Original Draft (lead), Writing Review/Editing. A.M.K.: Conceptualization (equal), Data Curation (equal), Formal Analysis (equal), Investigation (equal), Methodology (equal), Resources (Lead), Supervision (equal), Visualization (equal), Writing Review/Editing (lead). W.A.S.: Conceptualization (equal), Project Administration (Lead), Supervision (equal), Writing Review/Editing (equal). C.M.B.: Conceptualization (equal), Methodology (equal), Resources (equal), Writing Review/Editing (equal). D.J.H.: Conceptualization (equal), Formal Analysis (equal), Investigation (equal), Methodology (lead), Resources (equal), Supervision (equal), Visualization (equal), Writing Review/Editing (equal).
Funding Information
This research received no specific grant from any funding agency in the public, commercial, or not-for-profit sectors.
Supplementary Material
Supplementary Table S1
Supplementary Table S2
Supplementary Data S1
References
Supplementary Material
Please find the following supplemental material available below.
For Open Access articles published under a Creative Commons License, all supplemental material carries the same license as the article it is associated with.
For non-Open Access articles published, all supplemental material carries a non-exclusive license, and permission requests for re-use of supplemental material or any part of supplemental material shall be sent directly to the copyright owner as specified in the copyright notice associated with the article.