
Abstract
Objective:
Severe fever with thrombocytopenia syndrome (SFTS) poses a significant public health concern in China and has the potential for severe morbidity and mortality. Previous studies on SFTS have focused primarily on analyzing its incidence under existing climate conditions, often overlooking the impacts of future climate change on the disease’s distribution. Moreover, the key factors influencing SFTS transmission identified in prior research are limited and lack a comprehensive consideration of multiple environmental and socioeconomic factors in specific regions.
Methods:
In this study, by utilizing SFTS case data from Chuzhou city alongside multisource environmental variables, the maximum entropy ecological niche (MaxEnt) model was employed to identify the key climatic factors influencing the distribution of SFTS. Risk areas were projected for the present and future climate scenarios, including shared socioeconomic pathway (SSP)126, SSP245, SSP370, and SSP585.
Results:
The results indicate that (1) precipitation in the driest quarter, elevation, and precipitation in the wettest month are the most critical variables; (2) potential risk areas are situated predominantly in the central hilly region, with the total area of medium- and high-risk zones measuring 5731.86 km2, which accounts for 42.67% of the total area; (3) in future climate scenarios, the central–south and southwestern regions emerge as high-risk areas, with the maximum area of future high-risk zones reaching 6417.8398 km2, projected for the 2030s under the SSP585 scenario; and (4) the current epicenter of the SFTS risk area is located in Zhang Baling town (118°12′23″E, 32°28′56″N). Under the SSP126 and SSP370 scenarios, the epicenter exhibits minimal movement, whereas significant shifts occur under the SSP245 and SSP585 scenarios.
Conclusion:
These findings provide essential insights for formulating scientifically grounded prevention and control strategies against SFTS in Chuzhou city.
Introduction
Severe fever with thrombocytopenia syndrome (SFTS) is a novel infectious disease first identified and officially recognized in China in 2010 and subsequently reported in Japan and South Korea (Kim et al., 2018; Takahashi et al., 2014; Xu et al., 2011; Yu et al., 2011). The disease is caused by the SFTS virus and is transmitted primarily through tick bites. No effective treatment or vaccine currently exists for this highly lethal disease, which poses a significant threat to human health (Huang et al., 2021; Wu et al., 2020). In recent years, a substantial increase in the incidence of this disease has been observed in the central and eastern regions of China (Li et al., 2018; Liu et al., 2015; Sun et al., 2017). The incidence of SFTS is influenced by a complex interplay of environmental, climatic, and biological factors and human behaviors. Consequently, identifying the key determinants influencing SFTS transmission is crucial for understanding its epidemiological patterns.
Important progress has been made in the study of the influential factors and prediction of SFTS. Sun et al. (2018) constructed a negative binomial regression model, an autoregressive integrated moving average (ARIMA) model, and a quasi-Poisson generalized additive model. The former worked best, with temperature and relative humidity playing key roles [10]. Wang et al. (2024) used historical incidence data to establish three univariate prediction models, ARIMA, Prophet, and long short-term memory (LSTM) algorithms, and reported that the LSTM model performed best. The maximum entropy ecological niche (MaxEnt) model is a potential species distribution model based on known species and environmental factors that can explore the ecological requirements for disease occurrence and spread and predict the risk of the spread of disease within a region and is now widely used for a variety of infectious diseases, such as SFTS (Duan et al., 2023; Miao et al., 2020; Sun et al., 2018, 2021). Studies have shown that climatic factors, such as temperature, precipitation, and humidity, significantly affect the spatial and temporal distributions of SFTS (Sun et al., 2021). Environments with relatively high temperatures and humidity tend to promote tick reproduction and activity, which increases the risk of SFTS virus transmission. It has been suggested that the mean annual wind speed and cattle density are also key factors (Duan et al., 2023). In addition, socioeconomic factors, such as population density, distance between farmland and settlements, and patterns of human activity, further influence disease transmission pathways and risk levels.
However, published research has focused on projections under existing climate conditions, and in-depth analyses of the risk of disease transmission under future climate scenarios are lacking. In particular, in the context of increasing climate change, it has become particularly important to predict the impacts of future climate conditions on SFTS. The Coupled Model Intercomparison Project Phase 6 (CMIP6) synthesizes predictions of future climate from different models and scenarios and provides data support for studying future climate change and other related investigations.
Therefore, in this study, MaxEnt modeling was conducted to predict the distribution of SFTS risk in combination with future climate scenarios on the basis of SFTS cases and multisource remote sensing data (including environmental factors such as climate, topography, economy, and population density) for Chuzhou city. This study aimed to address the following questions: (1) What are the key climate factors that influence the distribution of SFTS? (2) How will the potential high-risk areas for SFTS in Chuzhou city change in the context of future climate change? By modeling the distribution of SFTS risk under different climate scenarios, we expect to provide a basis for developing scientific and effective SFTS prevention and control strategies in Chuzhou city.
Materials and Methods
Study area
The study area is Chuzhou city (30°51′−33°13′N, 117°10′−119°13′E), which is located in the eastern part of Anhui Province in China and has a land area of 13,433 km2 and 123 townships/streets (Fig. 1). In 2023, the permanent population of Chuzhou was 4.05 million. Characterized by a temperate monsoon climate, Chuzhou experiences four distinct seasons: spring and autumn are warm and pleasant, summers are hot and rainy, and winters are cold and dry. Geographically situated between the Yangtze River and Huai River Basins, the terrain of Chuzhou is relatively flat and dominated by hills and plains, which support a wealth of vegetation and water resources.
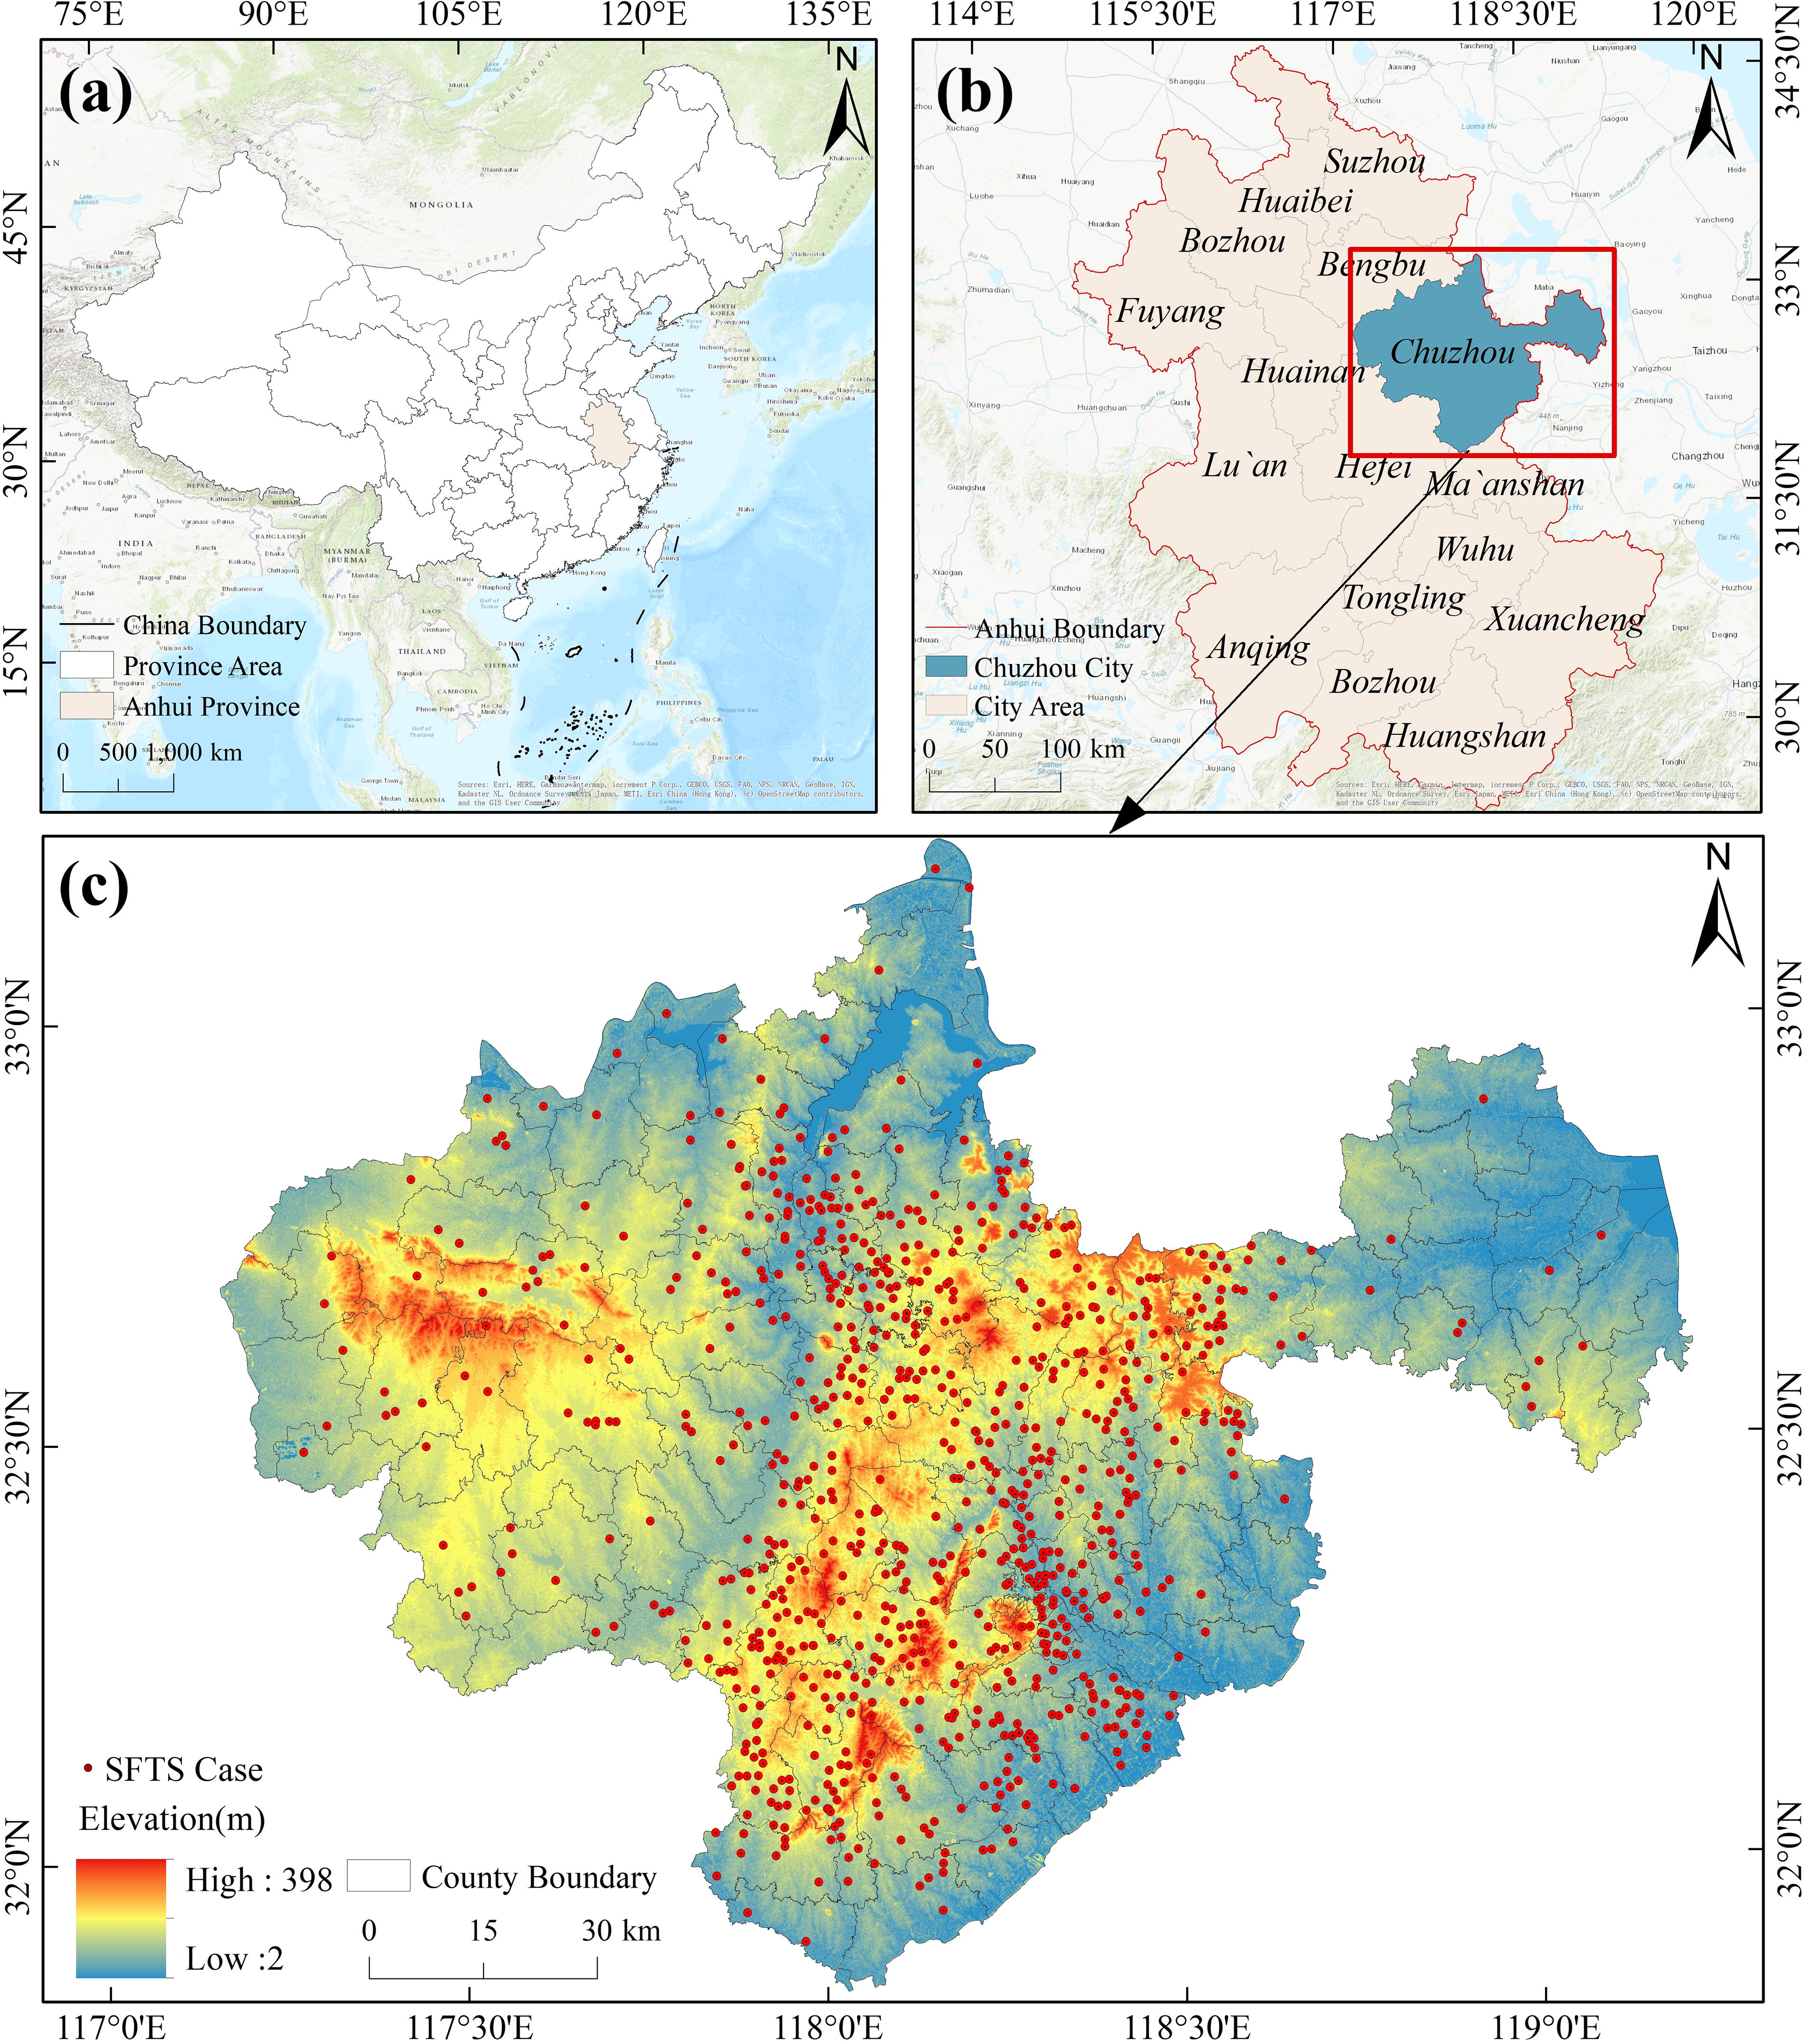
Map of the study area.
Data sources
A total of 1407 SFTS cases in Chuzhou city from 2011 to 2023 were obtained from the China Information System for Disease Control and Prevention. The latitude and longitude of the residences of people with SFTS in these cases were obtained via the Amap Map Application Programming Interface (API), and a geospatial database was established using ArcGIS 10.5.
The bioclimatic variables (bio1–bio19) under the current climate were obtained from the WorldClim website (www.worldclim.org) and represented average values from 1970 to 2000. The bioclimatic variables under four scenarios of future conditions of a shared socioeconomic pathway (SSP126, SSP245, SSP370, and SSP585) were obtained from the Beijing Climate Center Climate System Model version 2 (BCC-CSM2-MR), which was used in the CMIP6 historical test simulations. Each scenario was categorized into four periods: the 2030s (2021–2040), 2050s (2040–2060), 2070s (2060–2080), and 2090s (2080–2100).
Topographic data were sourced from the NASADEM_HGTV001 dataset provided by the National Aeronautics and Space Administration (NASA), and slope and aspect data were generated on the basis of these elevation data. The vegetation type data were sourced from the Global Land Cover Fine Classification (GLC_FCS30) product provided by the Aerospace Information Research Institute, Chinese Academy of Sciences. The soil type data were sourced from the National Earth System Science Data Center (http://www.geodata.cn). The population density data were sourced from WorldPop’s global population density maps. Nighttime light data, sourced from NASA’s VIIRS-NPP nighttime light remote sensing data, serve as indicators of economic activity levels within a region. All variables were uniformly aligned to the WGS 1984 coordinate system and converted to ASCII raster format, with a 1 × 1 km spatial resolution.
The variables were filtered to avoid overfitting the model due to multicollinearity between them. Model contributions were predicted for all variables via the MaxEnt model, and variables with >1% contribution were retained. Pearson correlation analysis of the variables was performed via SPSS software, defining an absolute value of r >0.8 as a high correlation. Among the highly correlated variables, only the one with the highest contribution was retained. Finally, nine variables, shaded in Table 1, were selected.
Definitions of the Variables for Constructing the Models
Risk modeling for SFTS occurrence
Maximum entropy ecological niche modeling (MaxEnt) is based on the ecological niche principle, in which the distribution with the greatest entropy is selected as the optimal distribution of a species under all constraints that satisfy the known distribution of the species (Elith et al., 2011; Phillips et al., 2006). The model is based on the principle of maximum entropy and predicts the probability distribution of species presence by using a set of constraints.
As a mathematical definition, by giving a random variable ε, n different potential outcomes, i.e., X1, X2,......., Xn, with probabilities of occurrence p1, p2,......, pn, appear; then, the entropy of ε can be expressed by the following equation:
Thus, the MaxEnt model can be used to generate distribution models for species by inputting location points of geospatial occurrence and a range of environmental factors. The logistic output format is generally used to obtain an estimated probability of presence at a given location, with a range of appropriate values from 0 (unsuitable) to 1 (most suitable).
In this study, the MaxEnt model was constructed on the basis of the SFTS case data of Chuzhou city from 2011 to 2023; 70% of the cases were randomly selected as the training set, and the other 30% of the cases were selected as the test set. To obtain a robust model, a 10-fold cross-validation method was used, and the modeling was repeated for 10 runs. The significance of the variables was assessed via the jackknife test, and the contribution of each variable was calculated. Variable response curves were used to elucidate the relationship between each variable and the occurrence of SFTS. The receiver operating characteristic (ROC) curve and area under the curve (AUC) were used to evaluate the accuracy of the prediction results of the model. The AUC values range from 0 to 1, with values closer to 1 indicating more accurate model predictions (Claire and Yoshinori, 2017).
Results
Key variables influencing the occurrence of SFTS
The MaxEnt modeling results revealed a nonlinear response curve for each variable of the SFTS occurrence probability (Fig. 2). The probability of SFTS occurrence exceeded 50% when the precipitation in the driest quarter exceeded 87 mm and increased sharply when it exceeded 105 mm (Fig. 2a). The probability increased sharply with increasing elevation and decreased at values greater than 80 m (Fig. 2b). The probability of SFTS was greater when the precipitation in the wettest month was between 190 and 220 mm, which occurred more than 40% of the time (Fig. 2c). The probability of incidence was low when the maximum temperature in the hottest month was below 30.5°C, increased sharply as the temperature rose, and decreased gradually at temperatures above 31°C (Fig. 2d). For nighttime lights, the probability of SFTS increased sharply as the economy developed and then plateaued (Fig. 2e). The probability of SFTS occurrence tended to increase exponentially at population densities higher than 500 people per hm2 and then remained steady at approximately 80% (Fig. 2f). When precipitation in the wettest quarter ranged from 410 to 445 mm, the probability of incidence gradually increased with increasing precipitation, stabilized between 445 and 470 mm, and gradually increased in incidence at values greater than 470 mm (Fig. 2g). Among all the vegetation types, herbaceous cover (code: 11), grassland (code 130), and wetland (code: 181) land types had the highest probabilities of occurrence, all exceeding 50% (Fig. 2h). The probability of SFTS occurrence was greater in the range of 910–940°C for temperature seasonality and decreased sharply at temperatures greater than 940°C (Fig. 2i).
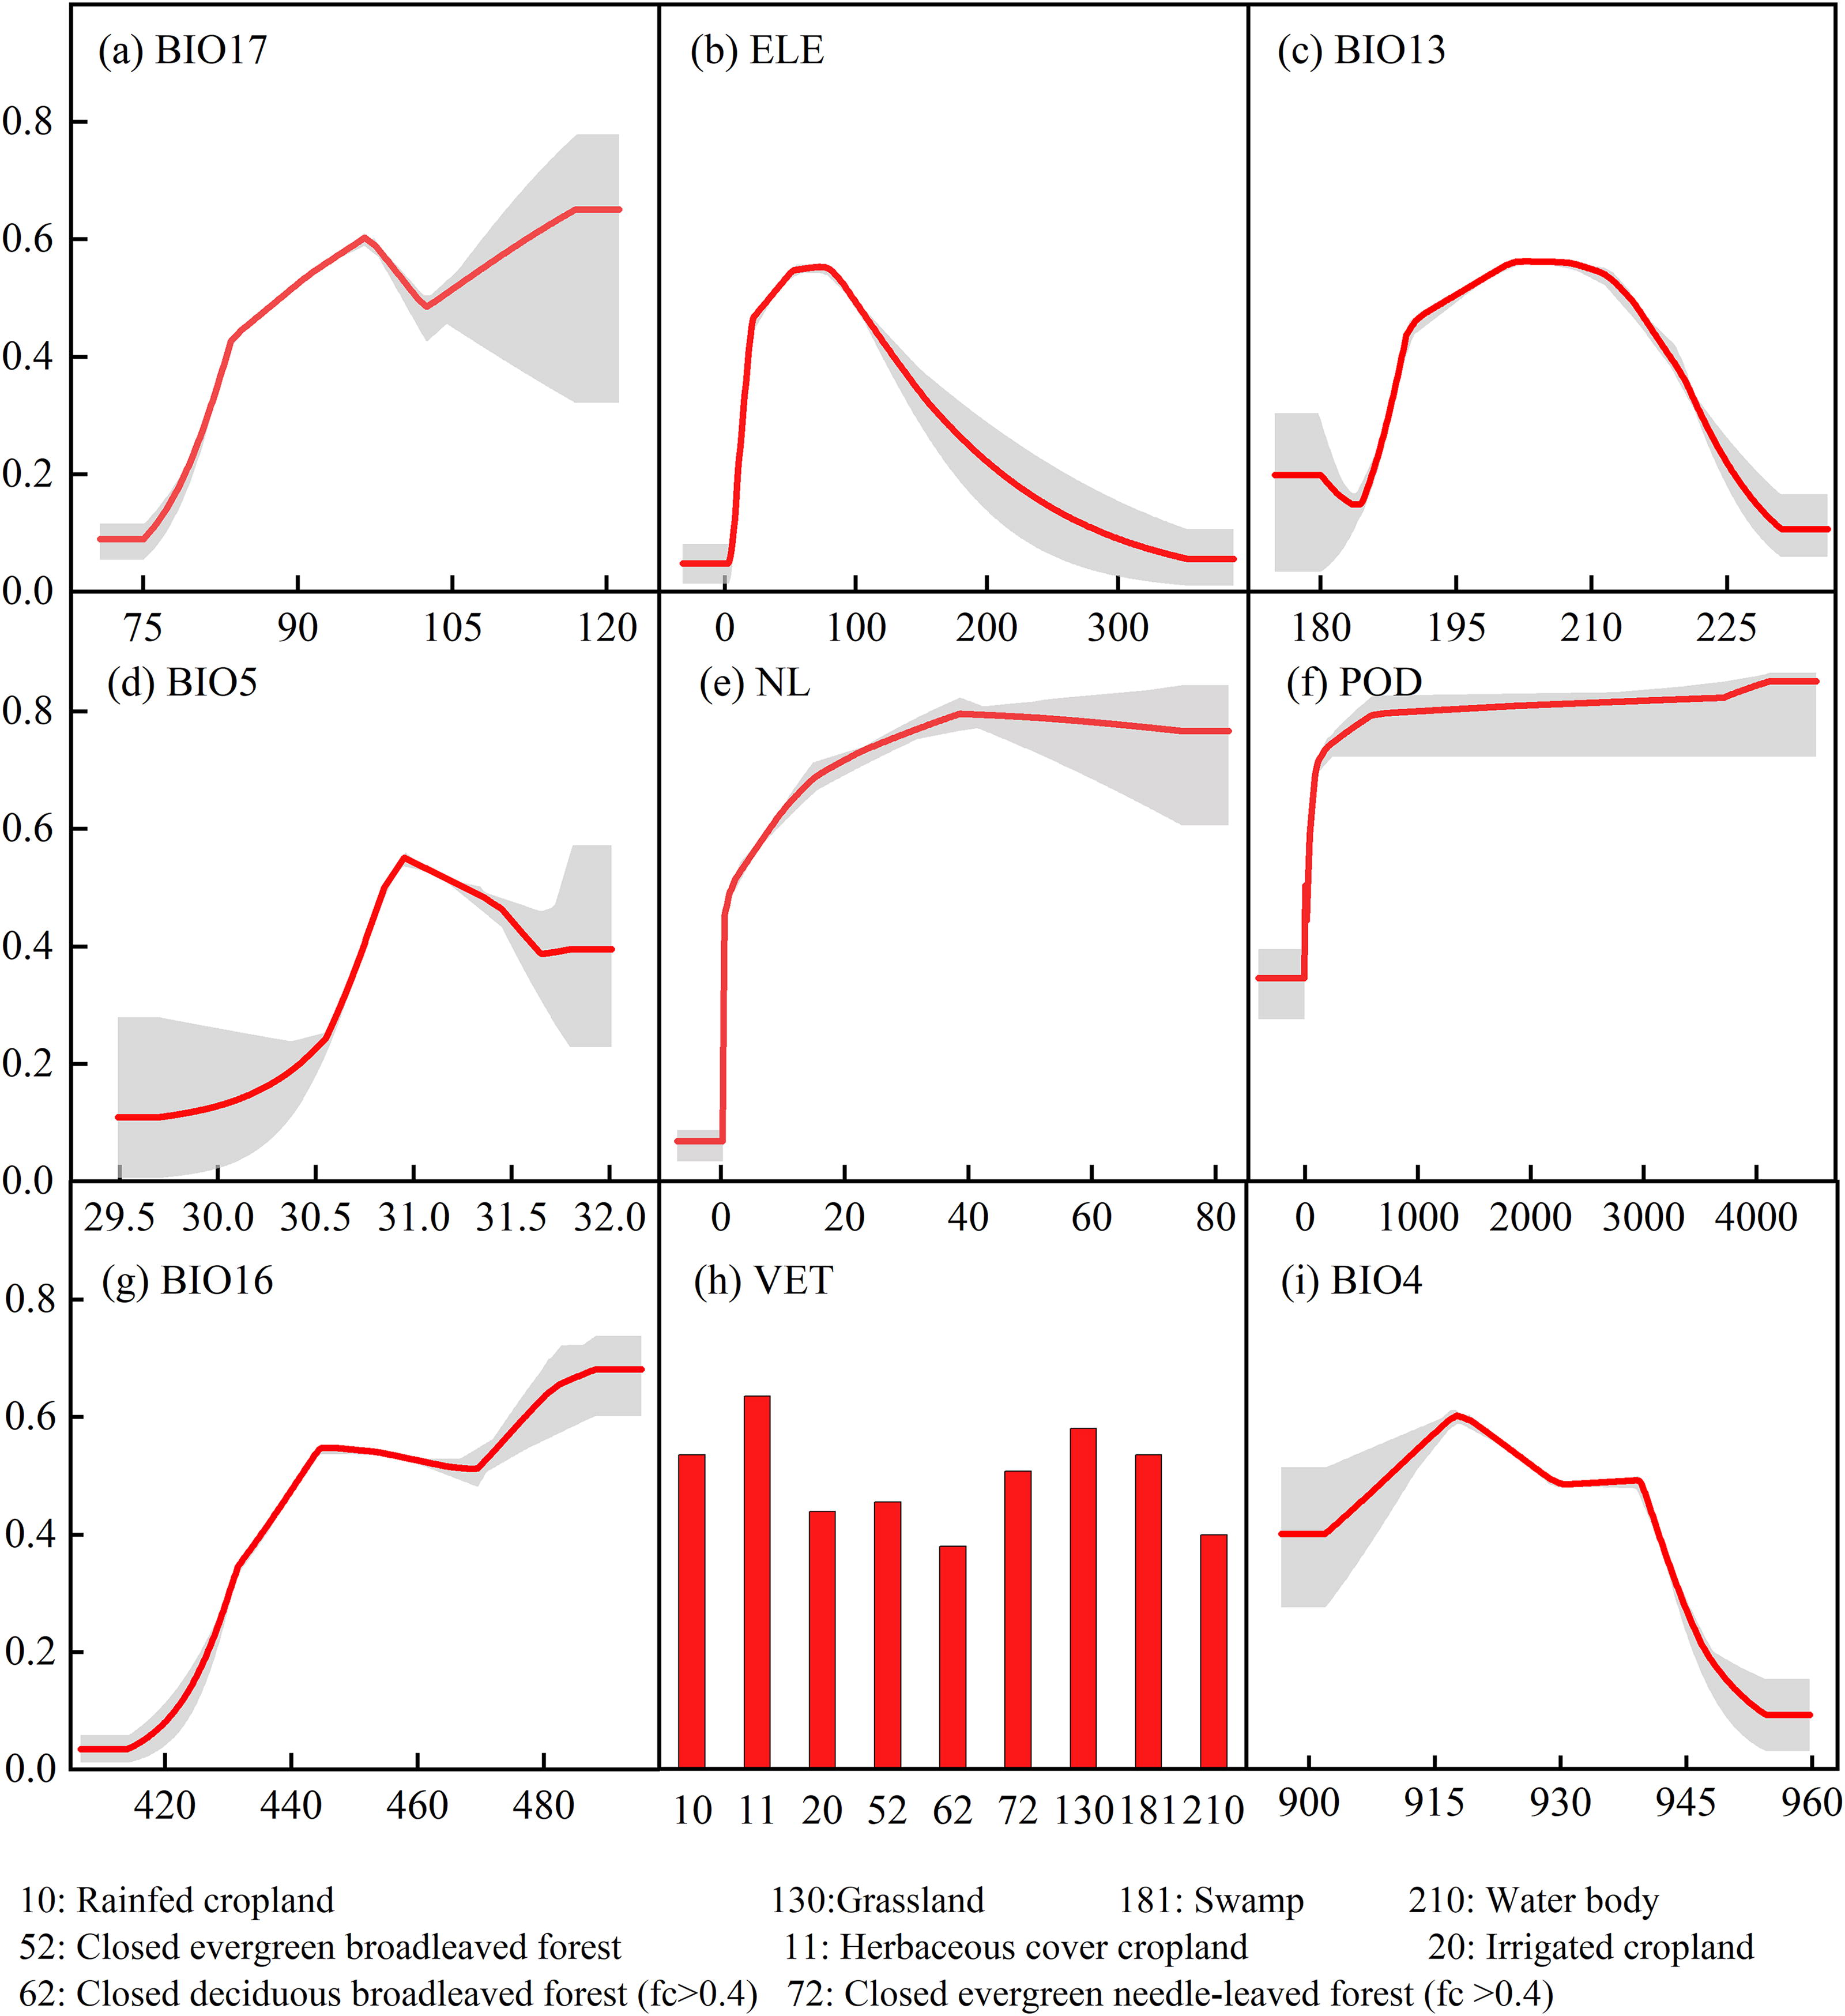
Response curves of the variables for the occurrence of SFTS. SFTS, severe fever with thrombocytopenia syndrome.
Distribution of potential areas of risk under current climate conditions
The ROC curve obtained after 10 iterations of the MaxEnt model, which is based on the current climate variables, presented a mean AUC value of 0.873, indicating that the MaxEnt model yielded better results, suggesting that the model is suitable for assessing the probability of SFTS onset. The probability of the potential risk of SFTS occurrence in Chuzhou was categorized into four classes via the natural breaks method, as shown in Figure 3. The high-risk zone covered 2150.62 km2, accounting for 16.01% of the total area of Chuzhou; the medium-risk zone covered 3581.24 km2, accounting for 26.66% of the total area; and the low-risk zone covered 3573.18 km2 of the total area, accounting for 26.60%. The high-risk areas for the occurrence of SFTS were relatively concentrated and were distributed mainly in townships in the central hilly areas, including Shi Ji, Yaopu, Wuyi, Shipei, Banta, and Sanjie.
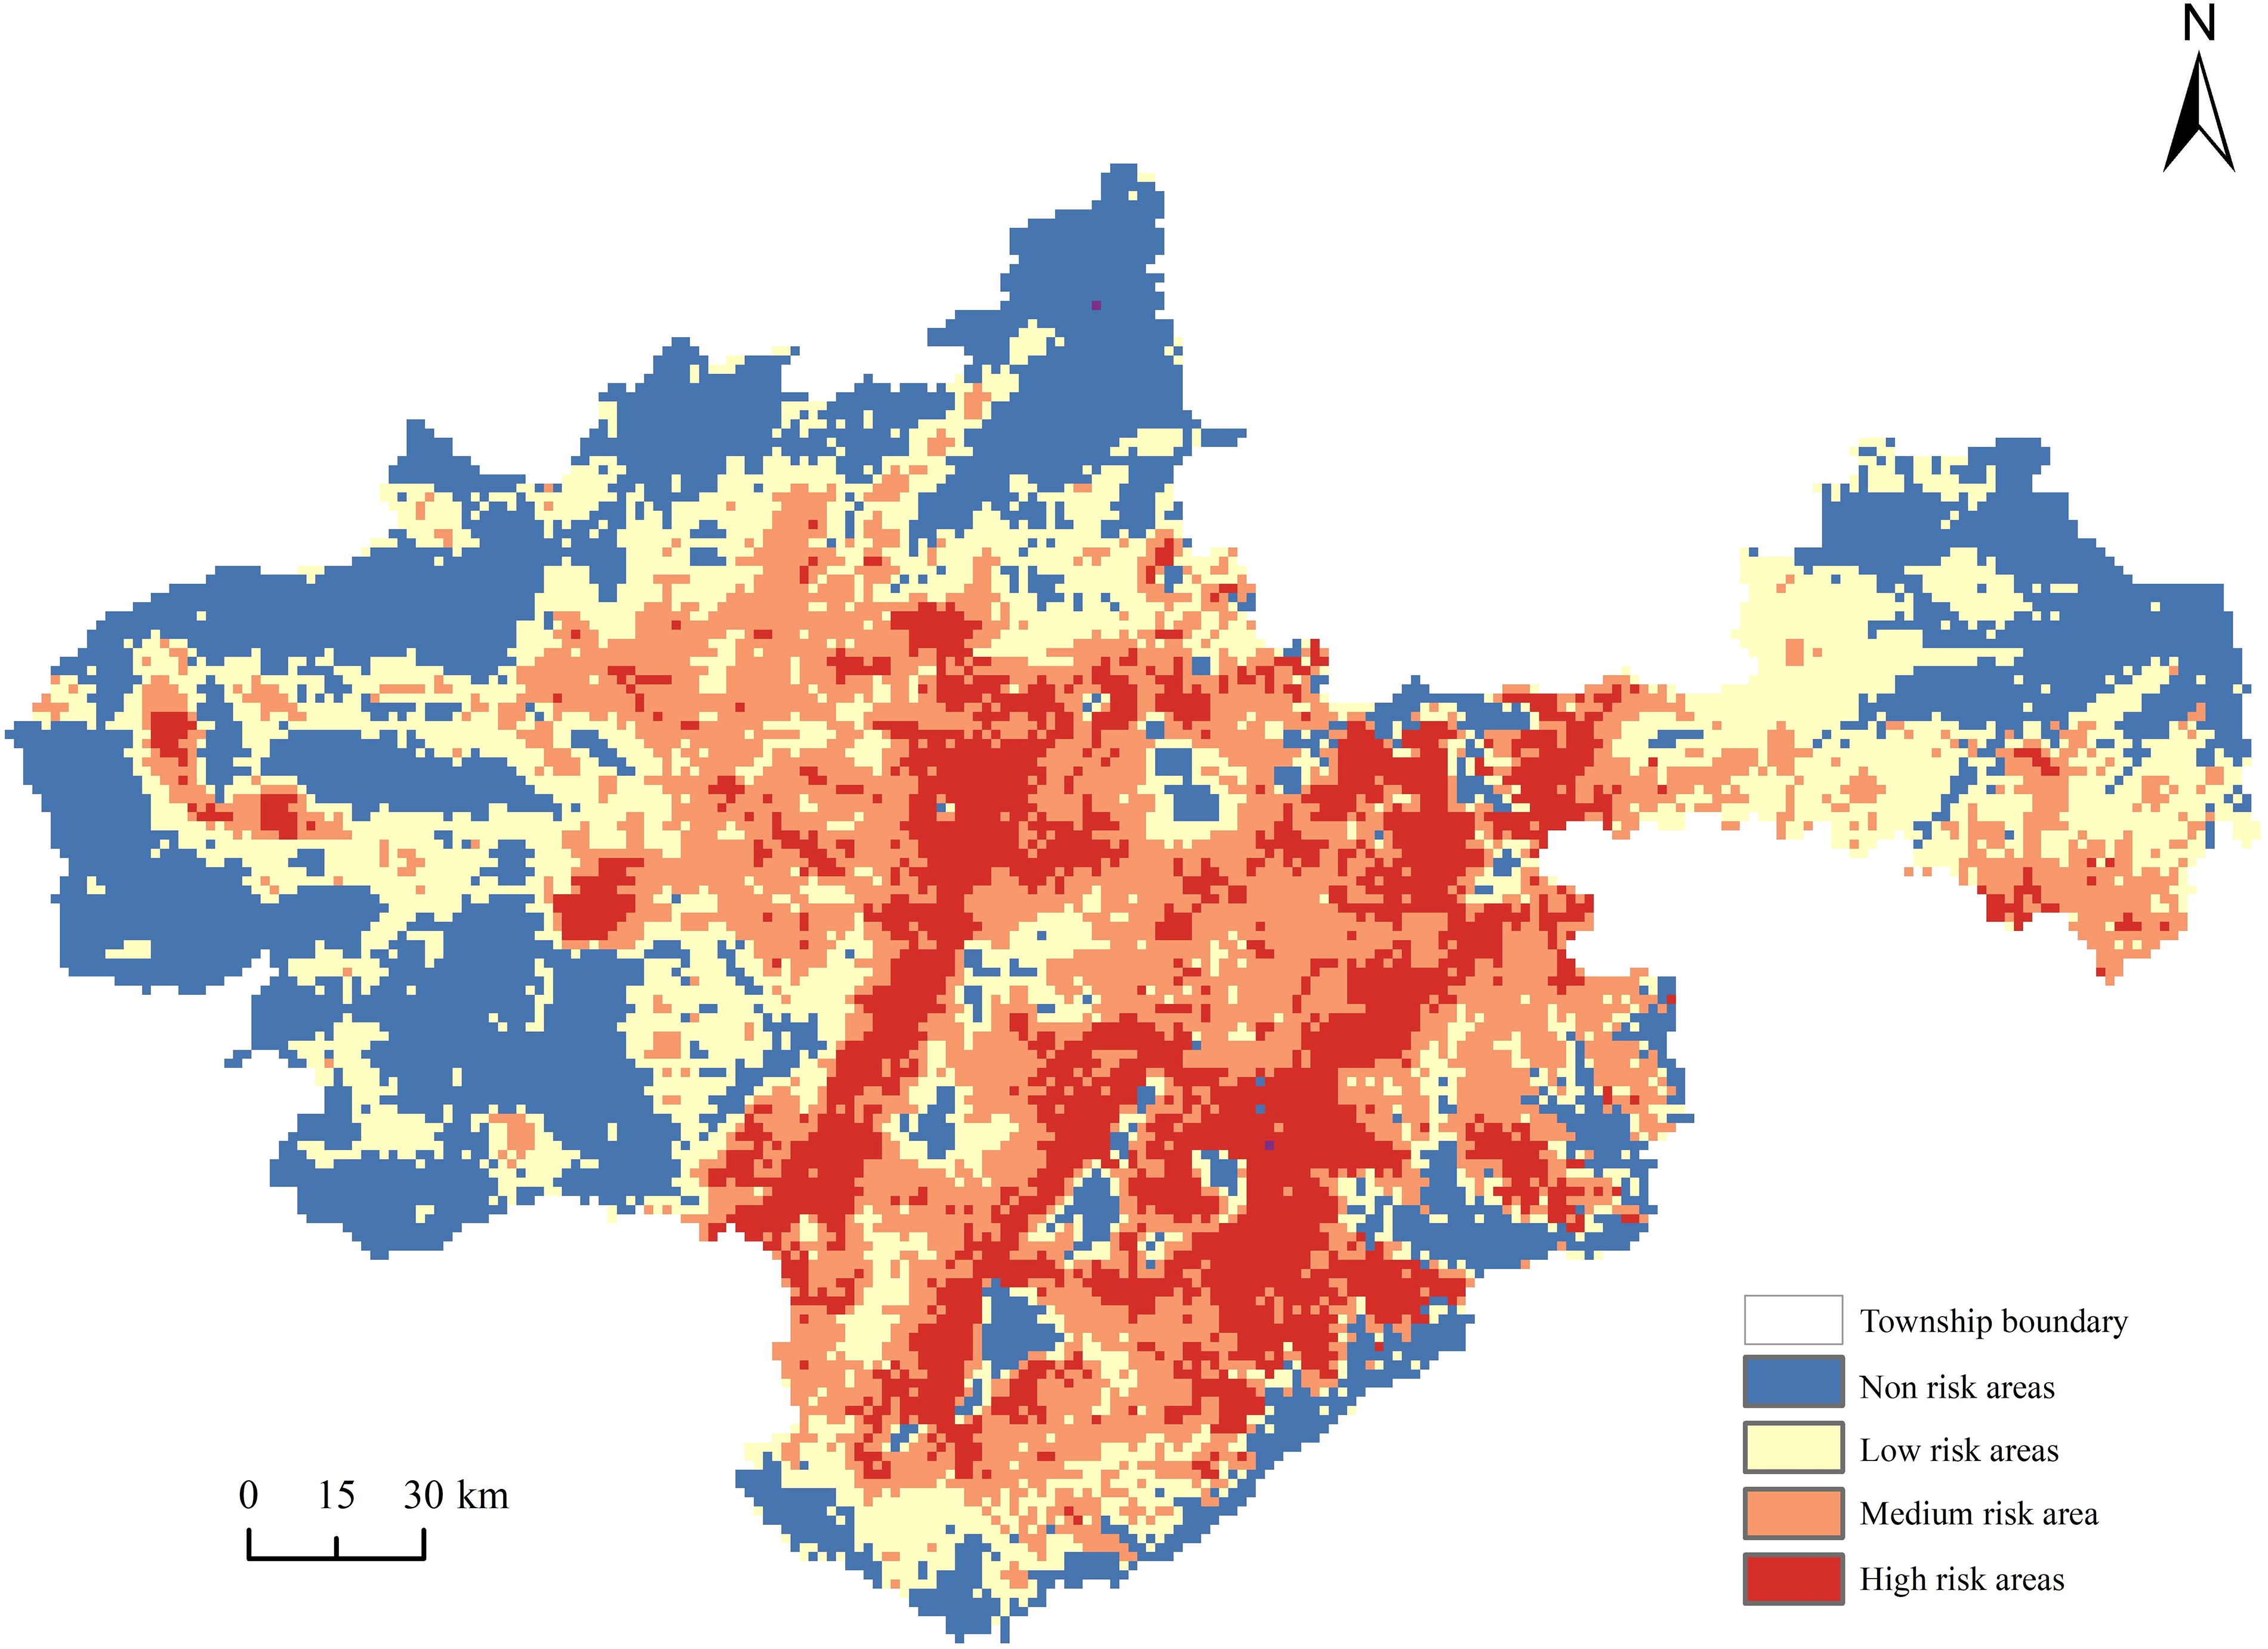
Areas of potential risk for SFTS in Chuzhou.
Distribution of areas of potential risk under different future climate scenarios
The distributions of the areas at potential risk of SFTS in the 2030s, 2050s, 2070s, and 2090s under the four future scenarios were predicted on the basis of the same variables and MaxEnt model settings (Fig. 4). Under the SSP126 scenario, the risk area shifts from the south to the southwest, and the medium- to high-risk area gradually increases. Under the SSP245 scenario, the medium- to high-risk area decreases and then increases, and the middle southern area is always the high-risk area. The SSP370 scenario shows a large change in the risk area, with the medium-risk area shifting to the northeast in the 2050s, the high-risk area shifting to the southwest in the mid-2070s, and the medium- and high-risk areas almost disappearing in the 2090s. Under the SSP585 scenario, the medium- and high-risk areas in the 2030s cover almost the entire study area. The south–central and southwestern portions of the study area are the most at-risk areas in most climate scenarios and periods.
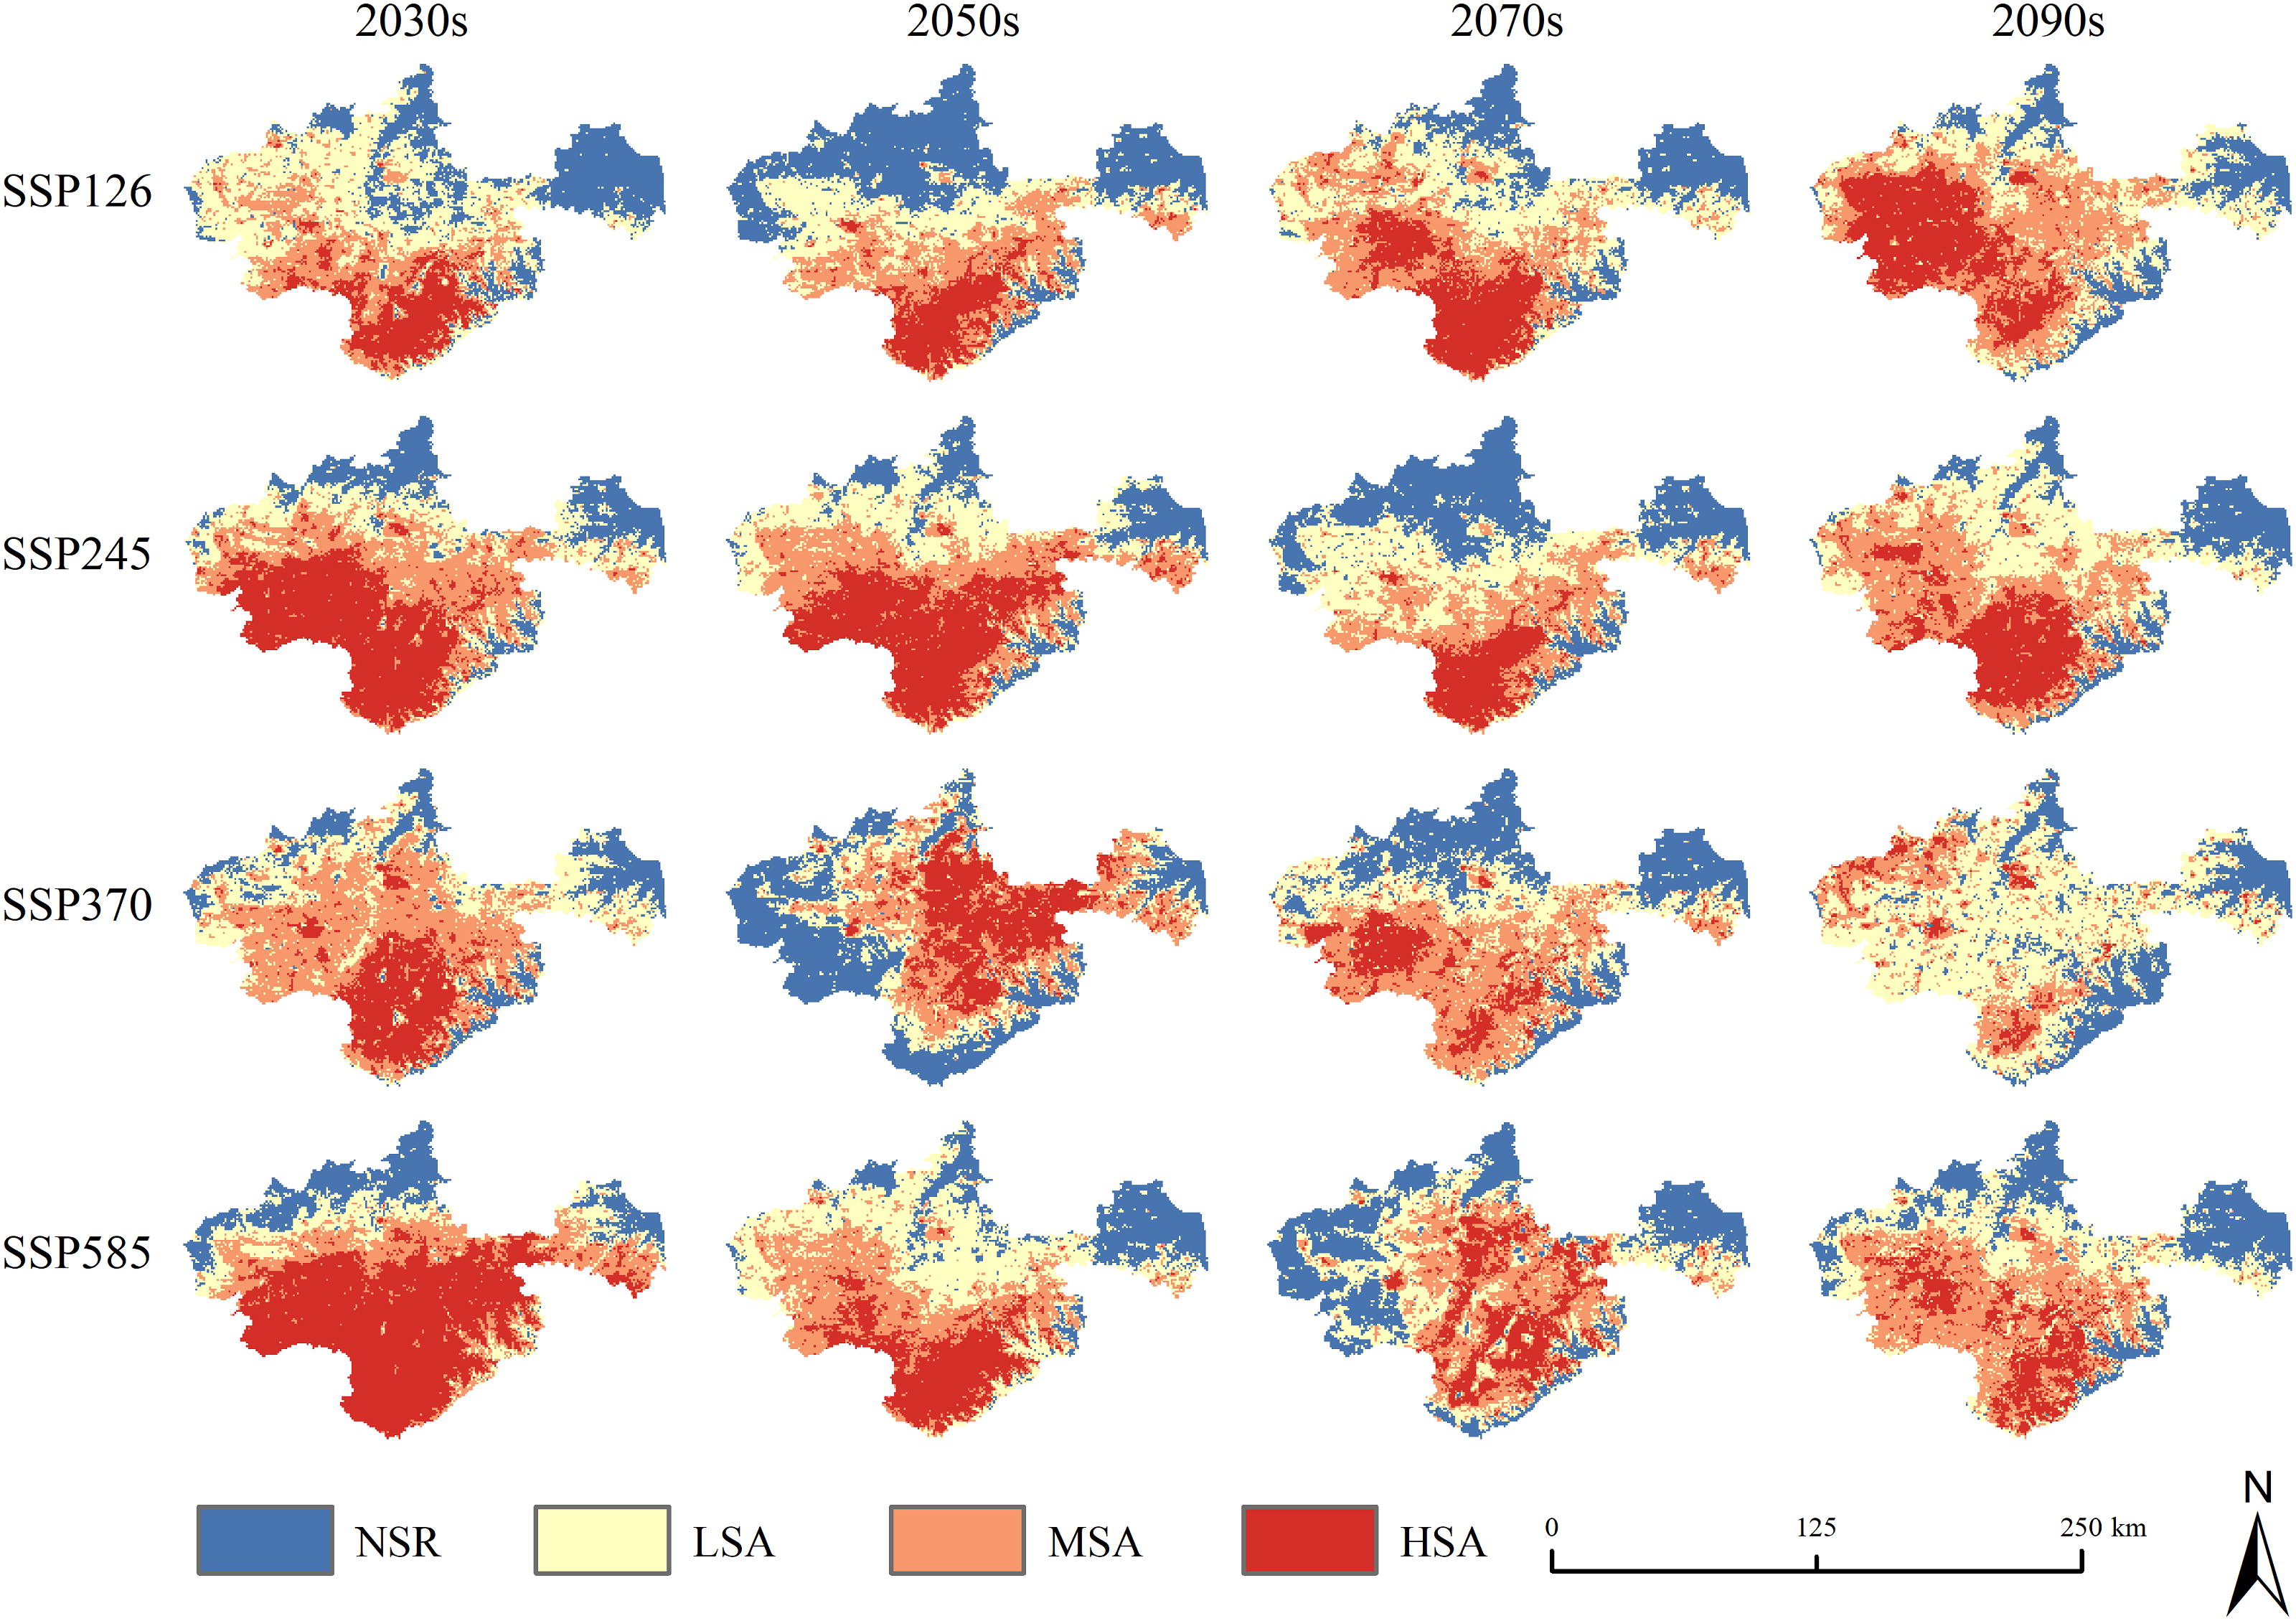
Distribution of areas at potential risk for SFTS under different future climate scenarios.
Both medium-risk areas and high-risk areas show decreasing and then increasing trends under the SSP126 scenario (Table 2). High-risk areas reach 3933.47 km2 in the 2090s, which is 45.33% greater than the present area. The medium-risk areas reach 4840.91 km2 in the 2090s, which is 26.02% greater than the present area. Under the SSP245 scenario, there is a trend of increasing high-risk areas and decreasing nonrisk areas. In the 2030s, high-risk areas increased the most, with a value of 5105.45 km2, which is an increase of 57.88%. In the 2090s, medium-risk areas increased the most, amounting to 4039.14 km2, which is an increase of 11.34%. Under the SSP370 scenario, high-risk areas expand and then gradually decrease over time. The medium-risk areas first increase and then decrease to 2561.22 km2 in the 2090s. In the 2030s, medium-risk and high-risk areas increase, reaching 5185.26 km2 and 2225.74 km2, respectively. The SSP585 scenario shows that the nonrisk areas decrease in different periods. High-risk areas decrease to 1941.98 km2 in the 2090s. The medium-risk areas decrease and then increase, decreasing to 2908.53 km2 in the 2030s and increasing to 4520.94 km2 in the 2090s.
Areas of Potential Risk Associated with Severe Fever with Thrombocytopenia Syndrome Under Different Climate Scenarios
NSR, nonrisk areas; LSA, low-risk areas; MSA, medium-risk areas; HSA, high-risk areas; SSP, shared socioeconomic pathway.
Centroid migration in potential risk areas under climate change scenarios
The current center of the SFTS risk area is located in the town of Zhang Baling (118°12′23″E, 32°28′56″N), as illustrated in Figure 5. Under the SSP126 scenario, the center of the risk area shifts northwestward to Chihe town (118°5′8″E, 32°29′17″N) in the 2030s, southeastward to Shahe town (118°12′37″E, 32°25′37″N) in the 2050s, and subsequently northwestward in the 2070s (118°6′24″E, 32°30′45″N). In the 2090s, the center moves northeastward, indicating a regressive trend. The center of the risk area migrates less significantly under the SSP245 scenario, remaining primarily in Zhang Baling town. The center shifts northwest ward in the 2030s, southeastward in the 2050s and southward in the 2070s, and then moves northwestward in the 2090s. Under the SSP370 scenario, the center moves northwest in the 2030s, northeast in the 2050s, southwest in the 2070s, and finally to Sanjie town (118°6′19″E, 32°32′36″N) in the 2090s. The centroid of the potential risk area exhibits considerable changes under the SSP585 scenario, moving northeast to Zhang Baling town (118°13′54″E, 32°34′49″N) in the 2030s, southwest to Zhang Baling town (118°7′45″E, 32°29′44″N) in the 2050s, southeast to Zhang Baling town (118°11′44″E, 32°29′25″N) in the 2070s, and finally southwest to Zhulong town (118°6′27″E, 32°28′18″N) in the 2090s.

Changes in the centroids of potential risk areas under climate change scenarios.
Discussion
Main environmental factors affecting the distribution of SFTS
The results of this study indicate that precipitation is a crucial factor influencing the incidence of SFTS, which is consistent with the results of previous studies (Du et al., 2014; Wang et al., 2017; Wu et al., 2016). As ticks constitute the primary vector for the transmission of the SFTS virus, the life cycle and reproduction of ticks are significantly affected by environmental humidity. Adequate humidity, especially when the relative humidity is approximately 70–85%, provides a favorable environment for ticks to maintain their body moisture and activity. Precipitation patterns influence the distribution of water sources and the humidity of the microenvironment where ticks live. In areas with more frequent and appropriate precipitation, ticks may have more habitats and food sources available. In contrast, in arid regions with less precipitation, the survival and reproduction of ticks may be severely restricted. In drier environments, tick survival rates and reproductive capacity may be suppressed. An increase in environmental humidity creates favorable conditions for tick development and reproduction.
The maximum temperature of the hottest month is also a key environmental factor affecting the occurrence of SFTS, which is consistent with the findings of Zhang et al. (2019). Their research indicated that the optimal temperature range for SFTS occurrence is between 32.8 and 34.2°C, whereas our study revealed a slightly lower optimal range of 30.8–32°C (Fig. 2d). This discrepancy may be attributed to variations in the study areas, as climate conditions, vegetation types, and tick species can differ across regions, thereby affecting the optimal temperature range for SFTS occurrence. Consequently, regional differences in temperature sensitivity may exist. Understanding these variations is essential for accurately predicting the risk of SFTS transmission in different areas and for developing effective prevention and control strategies.
The altitude is also an important factor influencing the incidence of SFTS. The study results reveal that as the altitude increases, the probability of SFTS occurrence significantly decreases when the altitude exceeds 100 m, which is entirely consistent with the findings of Sun et al. (2021) (Fig. 2b). This trend may be due to the lower levels of human activity in high-altitude areas, leading to fewer opportunities for contact with ticks and, consequently, a reduced risk of SFTS transmission. Similarly, Miao et al. (2021) noted that the incidence of SFTS was relatively low in areas with relatively high altitudes, likely because of the reduced interaction between humans and ticks in such regions. In addition, the climatic conditions in high-altitude regions may be unfavorable for tick survival and reproduction, further decreasing the likelihood of SFTS occurrence.
Moreover, the higher the nighttime light intensity and population density are, the greater the probability of SFTS occurrence (Fig. 2e, f). In regions with higher night lights, agriculture, and animal husbandry tend to be more developed, leading to more frequent human–animal interactions (e.g., with livestock such as cattle and sheep) and increased contact with ticks in their habitats, thereby increasing the risk of SFTS transmission. In areas with high population density, urban expansion frequently encroaches upon the natural habitats of ticks. This results in a significant overlap between tick habitats and human residential areas. For example, as cities expand, the construction of new suburbs and infrastructure often leads to the destruction of natural landscapes such as forests and grasslands, where ticks originally thrived. This forces ticks to seek new habitats closer to human settlements. Consequently, the frequency of human–tick encounters has increased substantially. People are more likely to come into contact with ticks during daily activities such as gardening or walking in nearby parks. This heightened contact probability directly contributes to an increased risk of SFTS infection.
Uncertainty in SFTS risk forecasting
The MaxEnt model is easy to operate and can make predictions with high accuracy, even with a limited sample size. However, our study has several limitations. The SFTS case data collected in this study covered only patients with household registration in Chuzhou city and did not include foreign patients with local disease onset. This may lead to an incomplete picture of the overall situation in the study area. In addition, the addresses recorded by the Centers for Disease Control and Prevention may not fully represent the locations where patients were bitten by ticks, which may also affect the prediction of potential risk areas for SFTS. Owing to the small regional scope of this study and its failure to encompass nationwide data on SFTS incidence, characterizing the potential future risk of SFTS on a larger scale is not possible.
Climate plays a key role in the onset of SFTS, with five of the nine key factors directly related to climate. To date, dozens of future climate models have been published by national research departments. Ding et al. (2023) also investigated the impact of climate change on SFTS by using an integrated multimodel, multiscenario framework. They employed climate models such as those from the Coupled Model Intercomparison Project Phase 5 to project future environmental suitability and the spatiotemporal patterns of SFTS cases. The BCC-CSM2-MR climate model developed by the National Meteorological Center of China has performed better in China-wide studies, but its 2.5° × 2.5° resolution may not be sufficient to meet the detailed requirements of this study. In addition, SSP emission models are based on a specific set of assumptions and scenarios that simplify the complex socioeconomic and environmental changes that are likely to occur in the future and help us understand the general trend of climate change. However, many unforeseen variables could affect actual changes in the global climate and thus introduce uncertainty into SFTS risk projections.
Vegetation is one of the important factors affecting SFTS, and different vegetation types may respond differently to climate change. Currently, we do not have access to data on vegetation cover under different climate scenarios. Although elevation itself does not change, the environmental and ecological conditions under which it occurs may change significantly under future climate scenarios, increasing the uncertainty of SFTS risk projections. Socioeconomic factors, such as economic status and population density, are also key variables in SFTS risk projections. These factors are likely to change significantly over the next 100 years, such as with increased urbanization and changes in population migration patterns. These changes can affect patterns of human activity and thus indirectly influence disease transmission. However, owing to the high degree of complexity and unpredictability of economic and social development, it is not yet possible to accurately predict specific changes in these factors and their potential impact on SFTS risk.
Conclusion
The environmental variables and SFTS cases in Chuzhou city were analyzed with the MaxEnt model to predict potential risk areas under four scenarios, and the following conclusions were drawn. The occurrence of SFTS is influenced by multiple factors, among which the precipitation of the driest quarter, elevation, and precipitation of the wettest month are the most critical variables. The variables respond differently to the probability of SFTS occurrence. The MaxEnt model’s predictive accuracy, as evidenced by a mean AUC value of 0.873, suggests its suitability for assessing SFTS risk. The potential risk area of Chuzhou city is in the central hilly area, with medium-risk and high-risk areas totaling 5731.86 km2, accounting for 42.67% of the total area. The risk area varies greatly over the four periods of the four future climate scenarios, with the south–central and southwestern parts of the region being the higher-risk areas. The maximum future high-risk area is 6417.84 km2, which occurs in the 2030s under the SSP585 scenario. The center of the SFTS risk area is currently located in the town of Zhang Baling (118°12′23″E, 32°28′56″N). The center shifts less under the SSP126 and SSP370 scenarios and more under the SSP245 and SSP585 scenarios.
Footnotes
Authors’ Contributions
Y.-H.L.: Implemented the study, managed and analyzed data, and wrote, reviewed, and edited the article. N.L., D.-L.C., and L.-W.L.: Designed the study, provided the idea, and critically reviewed and edited the article. All authors have read and approved the final article.
Author Disclosure Statement
The authors declare that they have no competing conflicts of interest.
Funding Information
This study was financially supported by the Natural Science Research Project for Anhui Universities (Grant Nos. 2023AH030094, 2022AH051111, and 2023AH051614), the Chuzhou University Research and Development Fund for the Talent Startup Project (Grant No. 2022XJZD08), the Anhui Province Key Laboratory of Physical Geographic Environment (Grant No. 2022PGE004), and the National College Student Innovation and Entrepreneurship Training Project (Grant No. 202410377014).