
Abstract
The occurrence of swine H1N1 pandemic was unexpected because our previous focus was concentrated on highly pathogenic avian H5N1 outbreaks. The H1N1 pandemic means that cross-species infection and cross-subtype mutation is not as rare as we had previously thought, and the barriers between species and between subtypes are not strong for influenza A virus. In this study, we use ANOVA to determine if there are barriers between species and between subtypes in the matrix protein 1 family from influenza A virus. The results show that the inter-species/subtype variations are generally much smaller than the intra-species/subtype ones, indicating that the barriers between species and between subtypes are not strong for influenza A viruses, which provides statistical evidence for cross-species infections and cross-subtype mutations.
Introduction
Recently, much progress has been reported in the study of the influenza A virus (20,21,23,25,29,32,39 –43), and our knowledge is rapidly developing in this area. In this context, new methods of analyzing the barriers between subtypes and between species for influenza A viruses are desperately needed. Many studies by various research laboratories around the world have indicated that mathematical analysis, computational modeling, and introducing novel physical concepts to solve important problems in biology and medicine, such as pharmacophore modeling (9,36), modeling 3-D structures of targeted proteins for drug design (17), Monte Carlo simulated annealing approaches (11,44,45), graph/diagram approaches (1,8,12,14), bio-macromolecular internal collective motion simulations (15,18), QSAR (19,31), prediction of subcellular protein locations (3,5), identification of GPCR and their types (13,55), identification of proteases and their subtypes (4,34), protein cleavage site prediction (10,16,33), diffusion-controlled reaction simulation (7,57), and signal peptide prediction (6,35), can provide useful information and insights for both basic research and drug design, and hence are welcomed by the scientific community. Though these new techniques have their place, it may be possible to predict the barriers between species and subtypes with some standard statistical techniques such as analysis of variance (ANOVA).
Although we say that barriers exist between subtypes and between species for the influenza A virus, they are in fact the barriers between subtypes and between species of the proteins of the influenza A virus, because the influenza A virus has ten types of proteins, and their mutations lead to the spread of infection.
The matrix protein 1 (M1) of the influenza A virus regulates the bi-directional transport of ribonucleoprotein into and out of the nucleus, and plays important roles in the various steps of virus replication, assembly, and budding (2). In the present study we use ANOVA to analyze the barriers between species and between subtypes in the M1 family of the influenza A virus, in the hope that the findings thus obtained will be of use for drug development and flu therapeutics.
Materials and Methods
Data
We obtained 7730 full-length M1 proteins of the influenza A virus collected between 1918 and 2009 (24). After exclusion of identical sequences (22), 944 M1 proteins were used in this study.
Conversion of M1 proteins into numbers
As ANOVA works on numbers rather than the letters normally used to represent the amino acids in the proteins, we had to convert each M1 protein into a number. We used amino acid pair predictability (46 –53) to do this conversion, which classifies adjacent amino acid pairs in M1 protein as predictable or unpredictable according to their permutations. For example, the ABU80288 M1 protein from swine influenza virus has 252 amino acids, of which there are 17 glutamic acids “E,” and 26 alanines “A.” If the permutation predicts the appearance of amino acid pair EA, it must appear twice: 17/252 × 26/251 × 251 = 1.75, which is true in this M1 protein, so the pair EA is predictable. By contrast, there are 18 valines “V,” in the M1 protein. If the permutation predicts the appearance of EV, it would appear once: 17/252 × 18/251 × 251 = 1.21; however, it actually appears four times, meaning that it is unpredictable. In this way, all amino acid pairs in each M1 protein are classified as predictable or unpredictable. For the ABU80288 M1 protein, its predictable and unpredictable portions are 36.65% and 63.35%, respectively. On the other hand, the ABW36389 M1 protein has only one amino acid different from ABU80288 M1 protein, but its predictable and unpredictable portions are 34.78% and 65.22%, respectively, so the two M1 proteins are different. In this manner all M1 proteins can be distinguished from one another, and these can be used for analysis via ANOVA.
Statistical analysis
The M1 proteins were grouped according to their subtypes as well as species (where the influenza A viruses are found), then ANOVA was used to determine if there were differences among subtypes and among species (i.e., if there were barriers among the subtypes and among the species). Then the comparison test was used to find out if there were differences between the subtypes and between the species. Statistical significance was set at p < 0.05, and SigmaStat software was used to perform all the tests (38).
Results and Discussion
Fig. 1 shows the results of the comparison of M1 proteins grouped according to their subtypes and species, and can be read as follows: the first bar in the top panel represents the mean with standard deviation of 186 M1 proteins in terms of their predictable portions, and these 186 M1 proteins belonged to H1 subtype, but were sampled from different species. Similarly, the first bar in the bottom panel represents the mean with standard deviation of 508 M1 proteins in terms of their predictable portions, and these 508 M1 proteins were sampled from avian sources and included various subtypes.
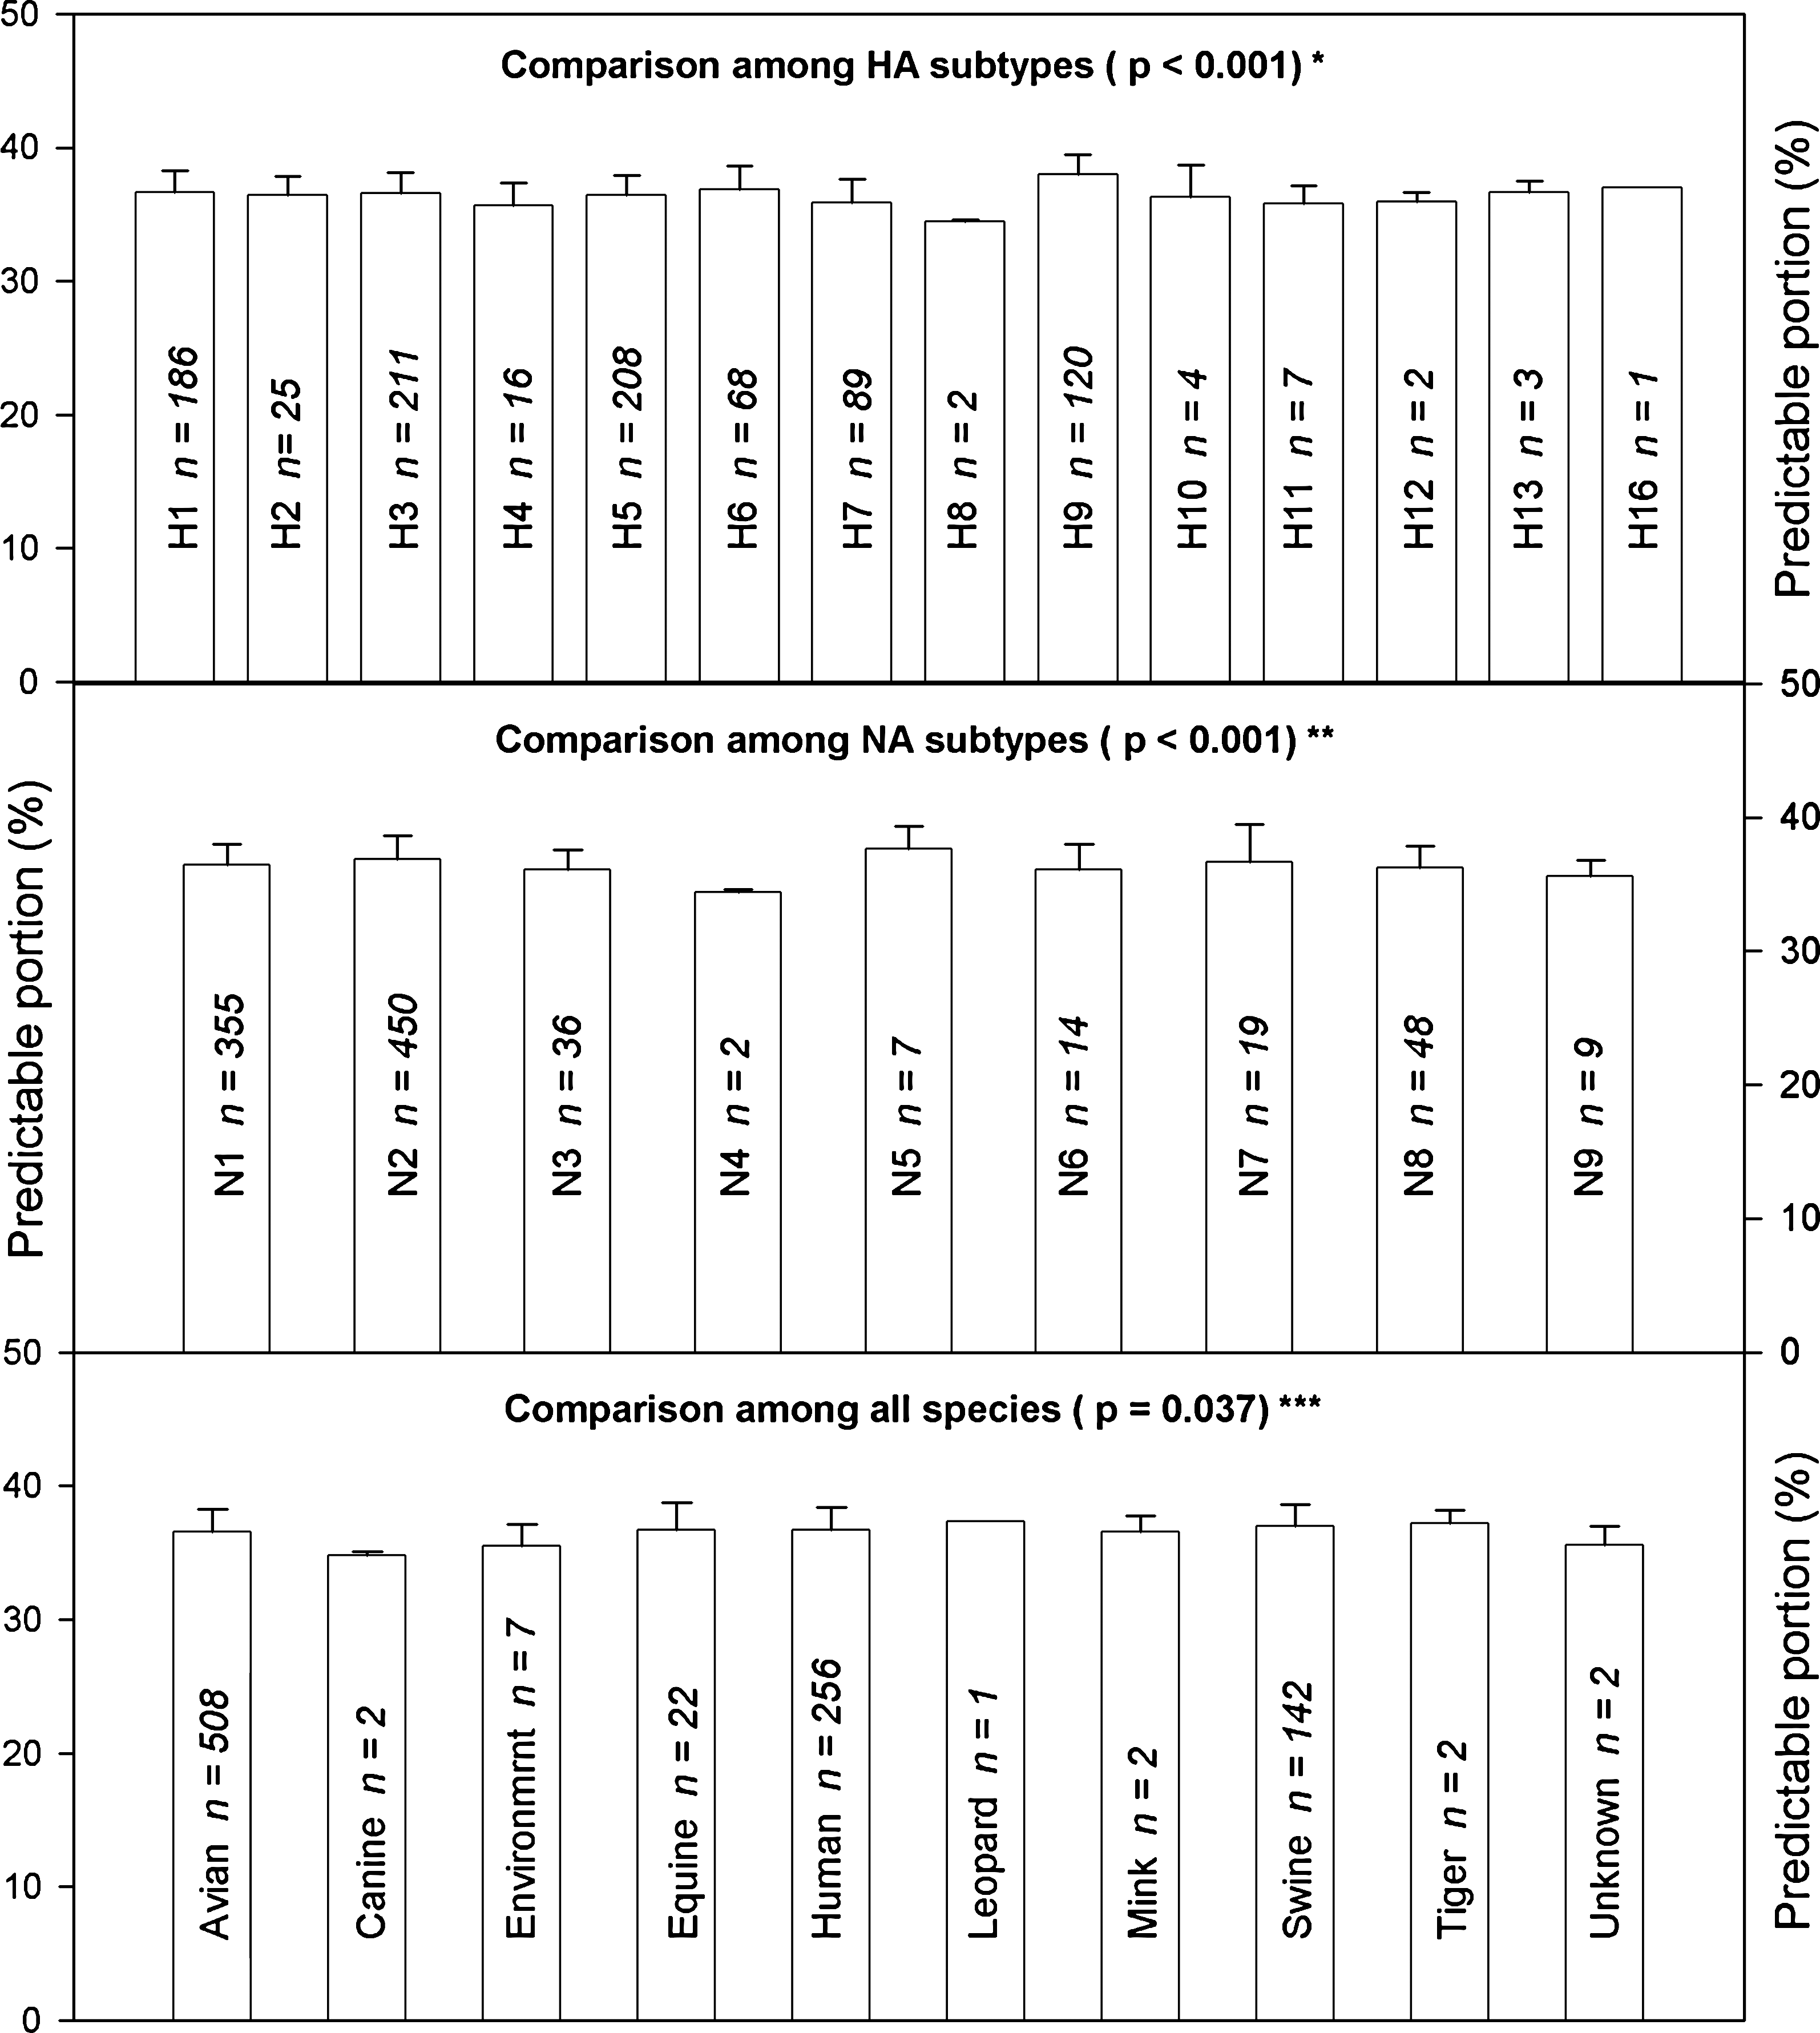
Comparison of M1 proteins from influenza A viruses grouped according to their subtypes and species (*indicates a statistically significant difference between two HA subtypes: H9 vs. H7, H9 vs. H5, H9 vs. H3, H9 vs. H1, H9 vs. H4, H9 vs. H6, H9 vs. H2, H6 vs. H7, H1 vs. H7, H9 vs. H11, H3 vs. H7, H9 vs. H8, H5 vs. H7, H6 vs. H4, H1 vs. H4, H3 vs. H4, H6 vs. H8, H9 vs. H10, and H6 vs. H5; **indicates a statistically significant difference between two NA subtypes: N2 vs. N1, N2 vs. N3, N2 vs. N8, N5 vs. N9, N5 vs. N4, N2 vs. N9, N5 vs. N3, N2 vs. N4, N5 vs. N8, and N5 vs. N6; ***indicates a statistically significant difference between swine and avian, and between swine and environment).
The comparisons in Fig. 1 show statistically significant differences among HA subtypes (top panel), NA subtypes (middle panel), and among all species (bottom panel), and the detailed results of the comparisons are shown in the legend. These differences indicate that the M1 proteins can be distinguished according to their subtypes and species via the use of the predictable portions, and that there are indeed barriers between subtypes and between species.
Although Fig. 1 reveals the differences between subtypes and between species, each strain of influenza A virus is classified according to both of its surface glycoproteins (i.e., the combination of HA and NA subtypes). Thus it is also important to compare M1 proteins in this regard. Fig. 2 displays the comparison of M1 proteins with respect to four main species in different subtypes. In fact, Fig. 2 is more meaningful than Fig. 1, and shows that there are no differences in most cases, except for the H3N2, H3N8, H5N1, and H7N7 subtypes. In other words, the species barriers are much weaker when the subtypes are combined.

Comparison of M1 proteins from influenza A viruses among species with respect to subtype. This comparison shows species differences in the H3N2 subtype (p < 0.001), in the H3N8 subtype (p = 0.023), in the H5N1 subtype (p < 0.001), and in the H7N7 subtype (p = 0.039) *,#indicate statistically significant differences compared with corresponding avian and swine viruses.
For the cases in which the difference between the bars is large in Figs. 1 and 2, it would be very difficult for cross-species infection and cross-subtype mutation to occur, because any mutation would be limited to its own subtype and species. However, our data set was quite large, and this may increase the statistical power, causing apparently large statistical differences, even though the actual difference is quite small.
Thus we need to have a careful look at the standard ANOVA table (Table 1), which generally divides the variations into two types: inter-subtype/species variations and intra-subtype/species variations, then determines the comparisons between them. For example, the variation related to HA subtype is traced as inter- and intra-subtype variation; 13 degrees of freedom are the number of subtypes minus one, and 928 degrees of freedom are the numbers of M1 proteins minus the number of subtypes; “Sum of squares” lists the variations, which divided by the degree of freedom yields the mean square; and the F value is the ratio of the mean squares. For a perfect barrier between subtypes, we will see a large inter-subtype variation and a small intra-subtype variation; however, we see in the table that the sums of the squares are 315.53 and 2365.65 for inter-subtype and intra-subtype variations, respectively. This means that any mutation may be a cross-subtype mutation, although there is a barrier between HA subtypes.
To make inter- and intra-subtype/species variations more visible, we can calculate them in terms of percentages (37,54), whose calculation is somewhat different from the simple comparison of the sum of squares shown in Table 1. Fig. 3 demonstrates that the intra-subtype/species variations are larger than the inter-subtype/species ones, which provides statistical evidence for possible cross-species infection and cross-subtype mutation. In other words, Fig. 3 indicates that the barriers between species and between subtypes are not large enough to prevent cross-species infection and cross-subtype mutation (27).
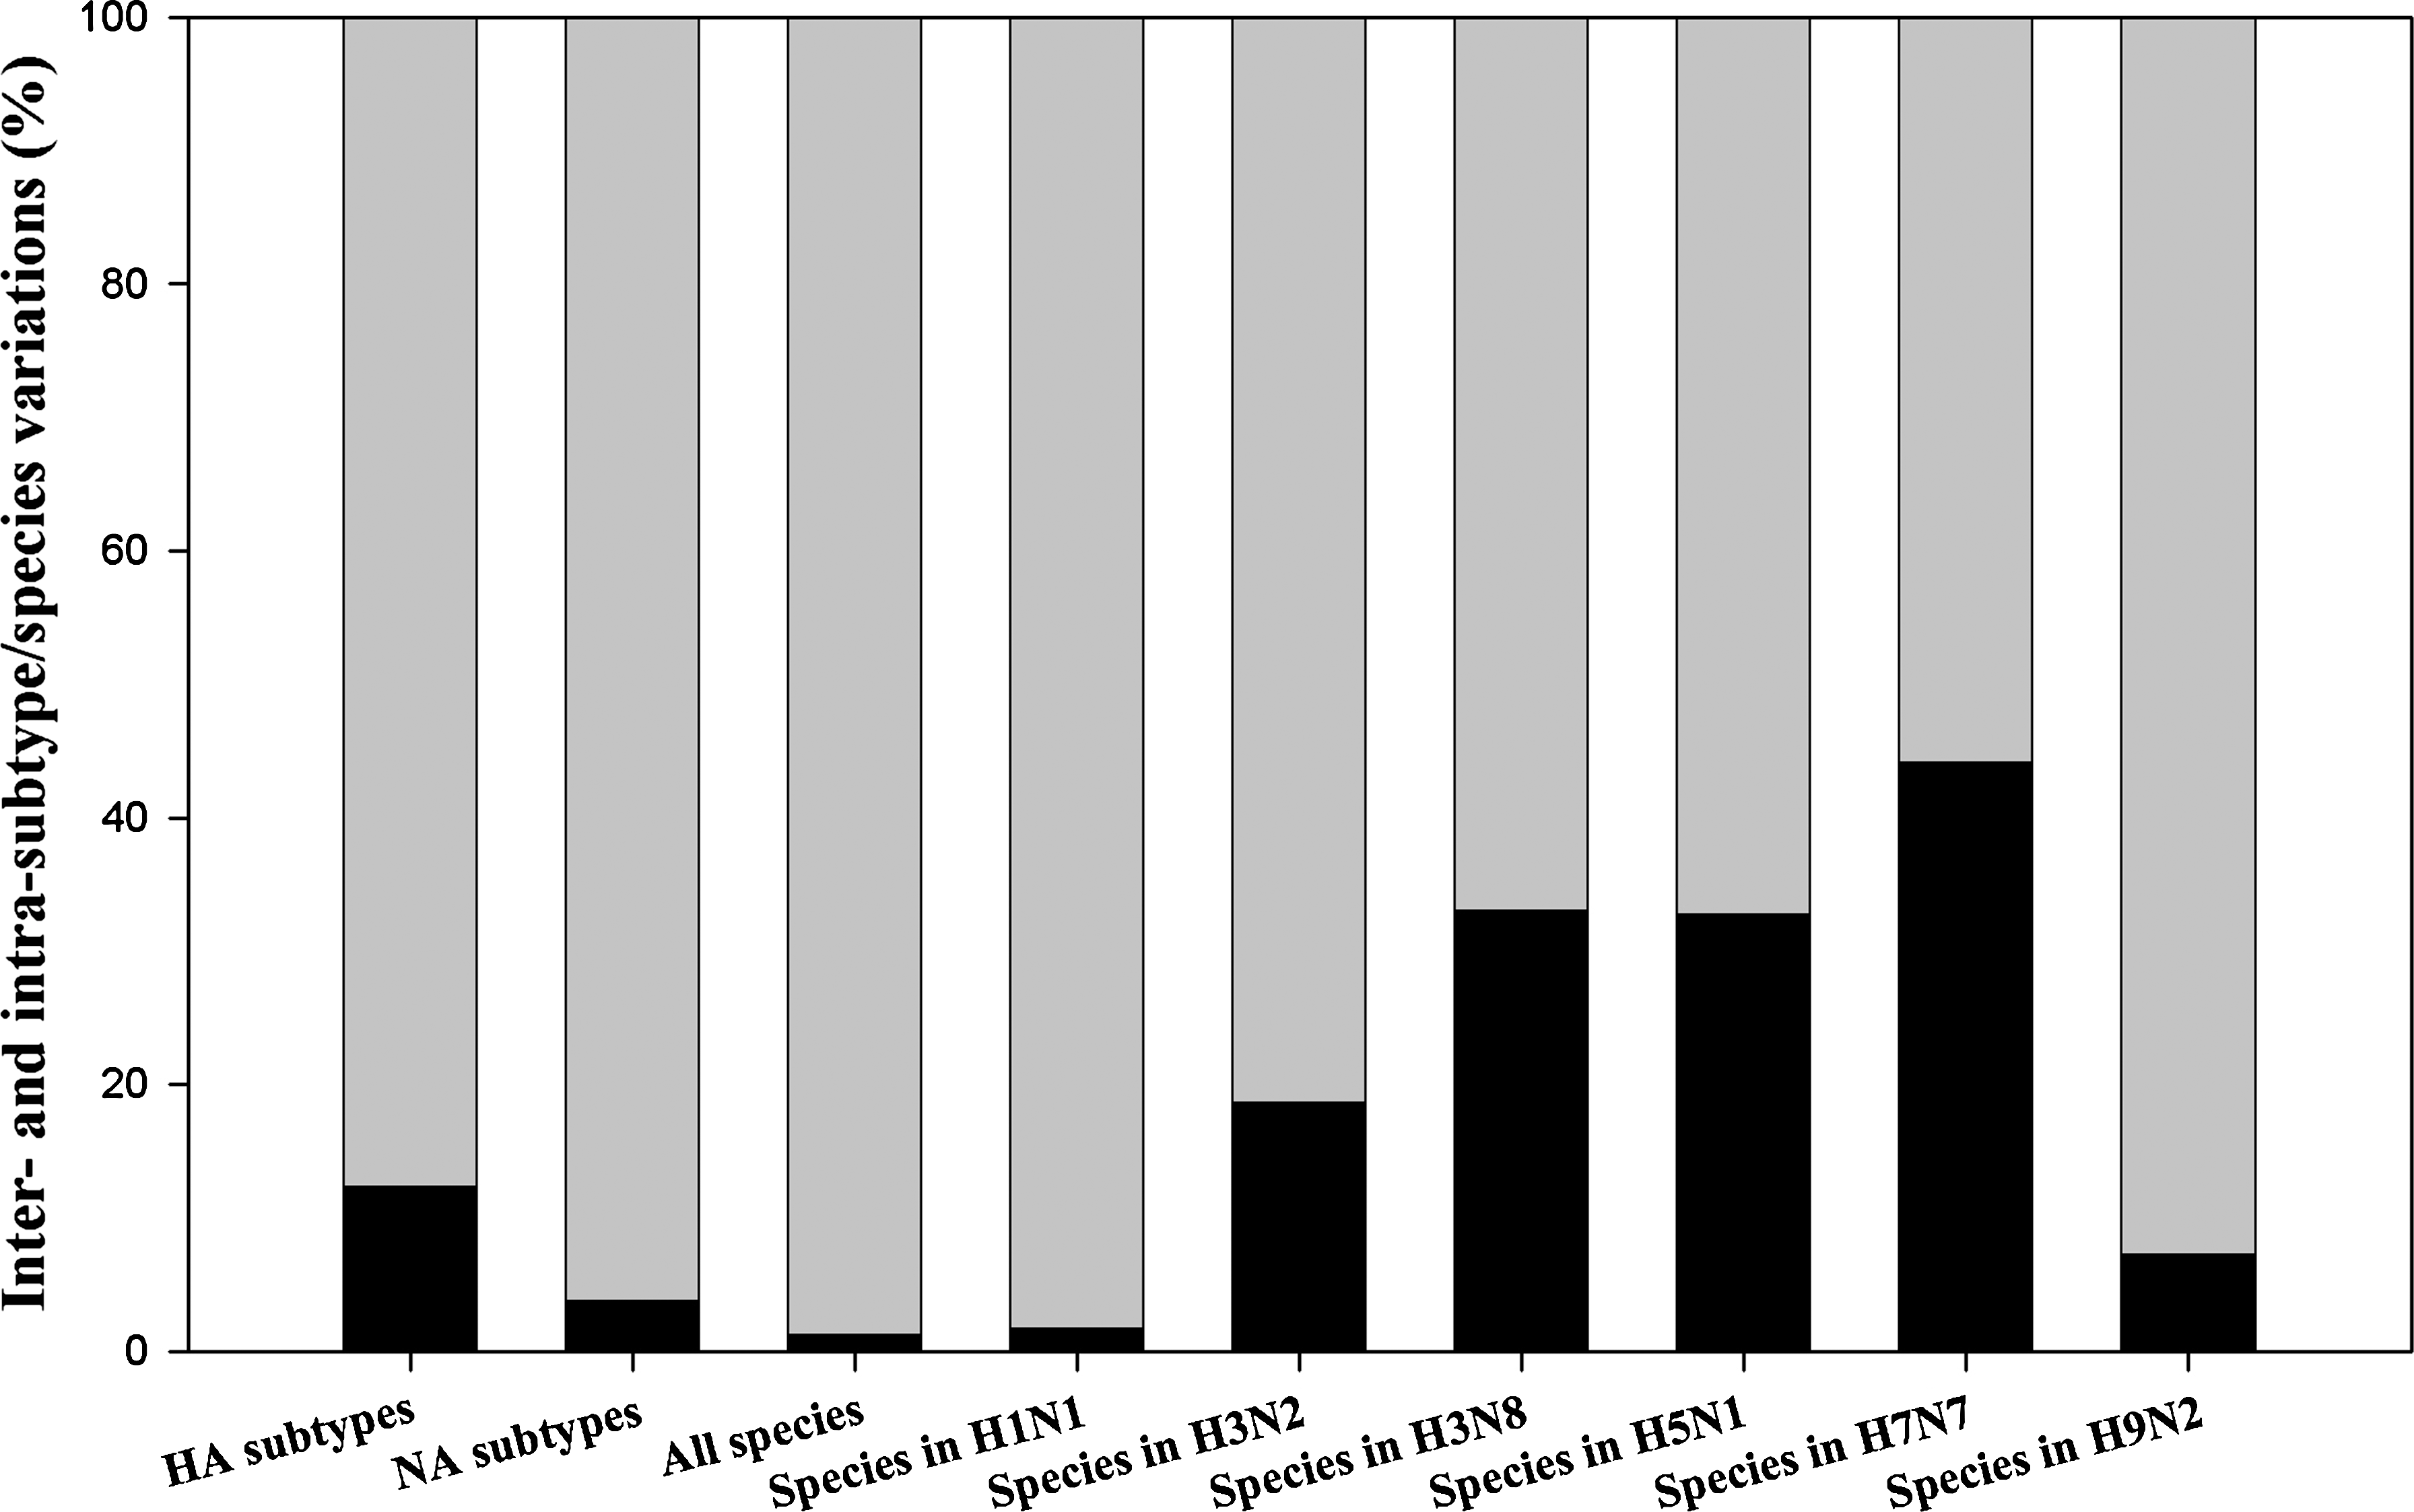
Inter- and intra-subtype/species (black and gray bars) variations in M1 proteins of the influenza A virus.
To the best of our knowledge, ANOVA is the only statistical means of analyzing these variations, because model I ANOVA determines if there are differences among subtypes and among species, and then the comparison test following model I ANOVA determines if there are differences between subtypes and between species, and finally model II ANOVA determines the inter- and intra-subtype/species variations.
However, we can also analyze this problem more intuitively: (1) the intra-subtype/species variation actually is equivalent to the standard deviation for each subtype/species (e.g., the standard deviations are 1.7 and 1.4 for the H1 and H2 subtypes, respectively, in terms of the percentages of their predictable portions); (2) the inter-subtype/species variation is actually equivalent to the difference between the means for any two subtypes/species (e.g., the means for H1 and H2 are 36.6 and 36.4, respectively, in terms of their percentages of predictable portions, so their difference is 0.2, which is smaller than either of their standard deviations [1.7 and 1.4]); and (3) we can also say that any mutation in an H1 subtype would have a good chance to change into an H2 subtype, or to jump from H2 to H1, because their intra-subtype variations are larger than their inter-subtype variations, or in other words, the barrier between subtypes H1 and H2 is not strong enough to prevent a cross-subtype mutation. However, this type of analysis leads to many comparisons (see online supplementary material at
The small inter-subtype variation means that influenza A viruses can easily mutate from one subtype to another. In addition, the large intra-subtype variations indicate that a vaccine designed for a single subtype may easily lose its effectiveness against other subtypes. On the other hand, our analysis supports the idea of manufacturing vaccines that target matrix proteins, and thus to confer cross-subtype protection (30).
The small inter-species variation means that cross-species infection occurs easily. For example, there are no differences between avian and swine viruses in the H1N1, H1N2, H5N1, and H9N2 subtypes, and no differences between human and swine viruses in the H1N1, H1N2, H2N2, and H9N2 subtypes, as shown in Fig. 2. Thus it would not be difficult for avian influenza virus to infect swine, for swine influenza virus to inflect humans, and for avian influenza virus to infect humans, findings in agreement with experimental findings that avian influenza viruses can replicate in the upper respiratory tract of pigs (26). Our results partly answer why there have been many cross-species infections in recent years, particularly for H5N1 infections (47,49,50,53), and why pigs generally serve as a link between avian and human infection (56).
Conclusions
This study provides clear evidence of possible cross-species infections and cross-subtype mutations of influenza A viruses, indicating that new viruses with the potential to cause epidemics and pandemics can easily develop.
Footnotes
Acknowledgments
This study was supported by the Guangxi Science Foundation (grants 07-109-001A and 0991080), and the Guangxi Academy of Sciences (grants 0701 and 09YJ17SW07).
Author Disclosure Statement
No competing financial interests exist.
References
Supplementary Material
Please find the following supplemental material available below.
For Open Access articles published under a Creative Commons License, all supplemental material carries the same license as the article it is associated with.
For non-Open Access articles published, all supplemental material carries a non-exclusive license, and permission requests for re-use of supplemental material or any part of supplemental material shall be sent directly to the copyright owner as specified in the copyright notice associated with the article.