
Abstract
The dendritic cell subsets myeloid dendritic cells (mDCs) and plasmacytoid dendritic cells (pDCs) play an important role in HIV pathogenesis. While pDCs play a major role in the innate immune response, mDCs are important for induction of the antigen-specific immune response. We studied pDCs and mDCs at different stages of HIV infection, and found that there were decreased percentages of pDCs and mDCs in the advanced stage of the disease (p < 0.0001), and that slow progressors did not show as great a decrease as more healthy individuals. Persons who had acquired infection within the last year showed a normal mDC percentage but a lower pDC percentage (p = 0.0092) than healthy individuals (0.16%). pDC percentages in those with late-stage disease did not revert to normal after successful antiretroviral therapy (ART), whereas mDC percentages reverted to levels comparable to those seen in the healthy population (0.08% pre-ART to 0.18% post-ART; p < 0.0001). The pDC population had high levels of apoptotic markers in those with recent (p = 0.0025) and advanced (p = 0.0012) HIV infection, with no difference in their migratory capacity from controls and slow progressors, indicating that apoptosis is the major mechanism of declining pDC numbers in the circulation. mDCs showed increased levels of apoptotic markers (p = 0.0012), as well as migration (p = 0.03), in those with advanced-stage disease compared to controls, suggesting that both migration and apoptosis contribute to the decline seen in mDCs in the circulation. The irreversible loss of pDCs due to apoptosis seen early in HIV infection may be responsible for an impaired innate anti-HIV immune response. However, the presence of functionally-competent pDCs in slow progressors implies that the loss of pDCs early in infection may be critical to control of HIV infection through innate immune mechanisms, and may influence the progression of disease.
Introduction
Myeloid DCs (mDCs) and plasmacytoid DCs (pDCs) are two major subgroups of dendritic cells. These are considered to be precursor cells for type 1 and type 2 DCs, respectively (32). These cells differ in their function and distribution (6,17). CD11c+ mDCs are proficient at antigen uptake and presentation (16), since they express co-stimulatory molecules like CD80 and CD86 upon encounter with antigen. CD80/CD86 interacts with CD28 and CTLA-4 on T cells, and provide a secondary signal to T cells, which is required for the generation of specific immune responses (21). Expression of these molecules gives mDCs their exclusive capacity to prime naïve T cells. pDCs (CD11c−CD123+) also present antigen to T cells to some extent, but they primarily secrete copious amounts of type I interferons that activate the innate antiviral immune response and support the antigen-presenting function of mDCs (30,34). mDCs and pDCs exhibit some differences in their migratory properties as well. mDCs migrate to lymphoid areas through lymphatics (13,30,32), while pDCs are known to migrate through high endothelial venules (36). Migration of DC subsets is primarily regulated by chemokine receptor CCR7 and its ligands CCL19, CCL21 (13,30,32), and CXCL12 (36).
Owing to their unique localization at mucosal surfaces, along with expression of one or more receptors for HIV-1 (e.g., CD4, CCR5/CXCR4, and DC-SIGN), DCs are probably the first cells of the immune system to interact with HIV-1 during sexual transmission (22). The interaction of HIV-1 with different receptors on DCs is thought to dictate the subsequent fate of the virus within the DCs, either resulting in processing and antigen presentation, or viral capture, infection, and transmission (7). HIV infection results in the impairment of antigen presentation by Langerhans cells (2,19) and blood DCs (9,33). HIV has also been shown to influence DC function by blocking DC maturation, and by changing their cytokine secretion pattern (10,15,20). This may result in induction of T-cell tolerance instead of an adaptive response (28). Results from in vitro experiments suggest that HIV-1 nef (4) and vpr (24) proteins mediate downregulation of CD80/CD86 expression. Previous studies have shown depletion of one or both of DC subsets during HIV infection (10,12,27,34), and the effects of antiretroviral therapy (ART) (5,18). A majority of these are cross-sectional studies done on patients at a particular stage of disease, or groups of patients at different stages of disease progression. For the first time, in this study we report that the irreversible reduction in pDCs in early and chronic HIV infection can be attributed to apoptosis, while the loss of mDCs seen in later stages of disease (that is reversible after successful ART) may be due to their migration to lymphoid areas and apoptosis.
Materials and Methods
Study participants
This study was approved by the institutional ethics committee and written informed consent was obtained from all patients before enrollment in the study. Fifteen recently-infected individuals (within 1 y of acquiring HIV-1 infection), 11 slow progressors (asymptomatic patients with stable CD4 cell counts >500 cells/mm3 for more than 5 y), and 19 AIDS patients (CD4 count <200 cells/mm3) were enrolled in the study. None received ART prior to enrollment in the study. Demographic details of the patients are shown in Table 1. Recently-infected patients were subsequently followed every 3 mo for two more visits. After baseline assessment, 16 of the 19 AIDS patients were initiated on antiretroviral treatment (per national ART guidelines) and were followed after 6 mo of treatment. Twenty healthy HIV seronegative individuals were included as controls. Blood was collected in EDTA collection tubes, and the samples were processed within 6 h of collection. CD4+ T-cell counts were estimated by flow cytometry (FACSCalibur; BD Biosciences Pharmingen, Franklin Lakes, NJ) with a Trucount kit (BD Biosciences Pharmingen).
Abbreviation: NA, not applicable.
Plasma viral load
Plasma viral RNA load was measured by RT-PCR (Cobas Amplicor HIV-1 Monitor Test Kit, version 1.5; Roche Diagnostics Corp., Indianapolis, IN), according to the manufacturer's instructions. The lower detection limit of the assay was 400 RNA copies/mL, and the upper detection limit was 750,000 RNA copies/mL. For statistical analysis, values <400 RNA copies/mL were considered to be 400 RNA copies/mL.
Flow cytometry reagents
The following reagents and monoclonal antibodies from BD Biosciences were used for flow cytometry: sheath (#342003), BD FACS lyse solution (#349402), Lin 1 FITC (#340546, a cocktail of CD3, CD14, CD16, CD19, CD20, and CD56), CD11c APC (#559877), HLA-DR PerCP (#347364), and CD80 PE (#557227) or CD86 PE (#555658). CD123 PE Cy7 (#25-1239) was purchased from eBioscience (San Diego, CA). Matched isotype controls were used.
Identification of blood myeloid DCs and plasmacytoid DCs using flow cytometry
Blood mDCs and pDCs were identified as reported previously by Levy et al. with some modifications (11,18). In brief, 100 μL of blood was incubated with Lin 1 cocktail, anti-HLA DR, anti-CD11c, and anti-CD80 or anti-CD86 for 30 min in the dark at room temperature. Erythrocytes were subsequently lysed with 1x lysing solution. The stained cells were washed and fixed in 3% paraformaldehyde. Flow cytometric analysis was performed on a FACSCalibur using Cell Quest software. Initially 25,000, 50,000, and 100,000 gated events were acquired for a few control samples. Analysis indicated that all three gated events showed the same results (data not shown). Hence it was decided to acquire 50,000 gated events of blood mononuclear cells for all samples in order to quantitate the two subpopulations of blood DCs. A progressive gating strategy was used to identify the DCs, as defined by an absence of labeling with cell lineage–specific antibodies and expression of HLA-DR. Two subpopulations of DCs were differentiated by the presence or absence of CD11c expression, and histograms were plotted to assess expression of CD80 and CD86 (as mean fluorescence intensity, MFI; Fig. 1A–E). Quantitative comparison of levels of expression of different surface molecules was possible, as all data were collected using identical instrument settings.
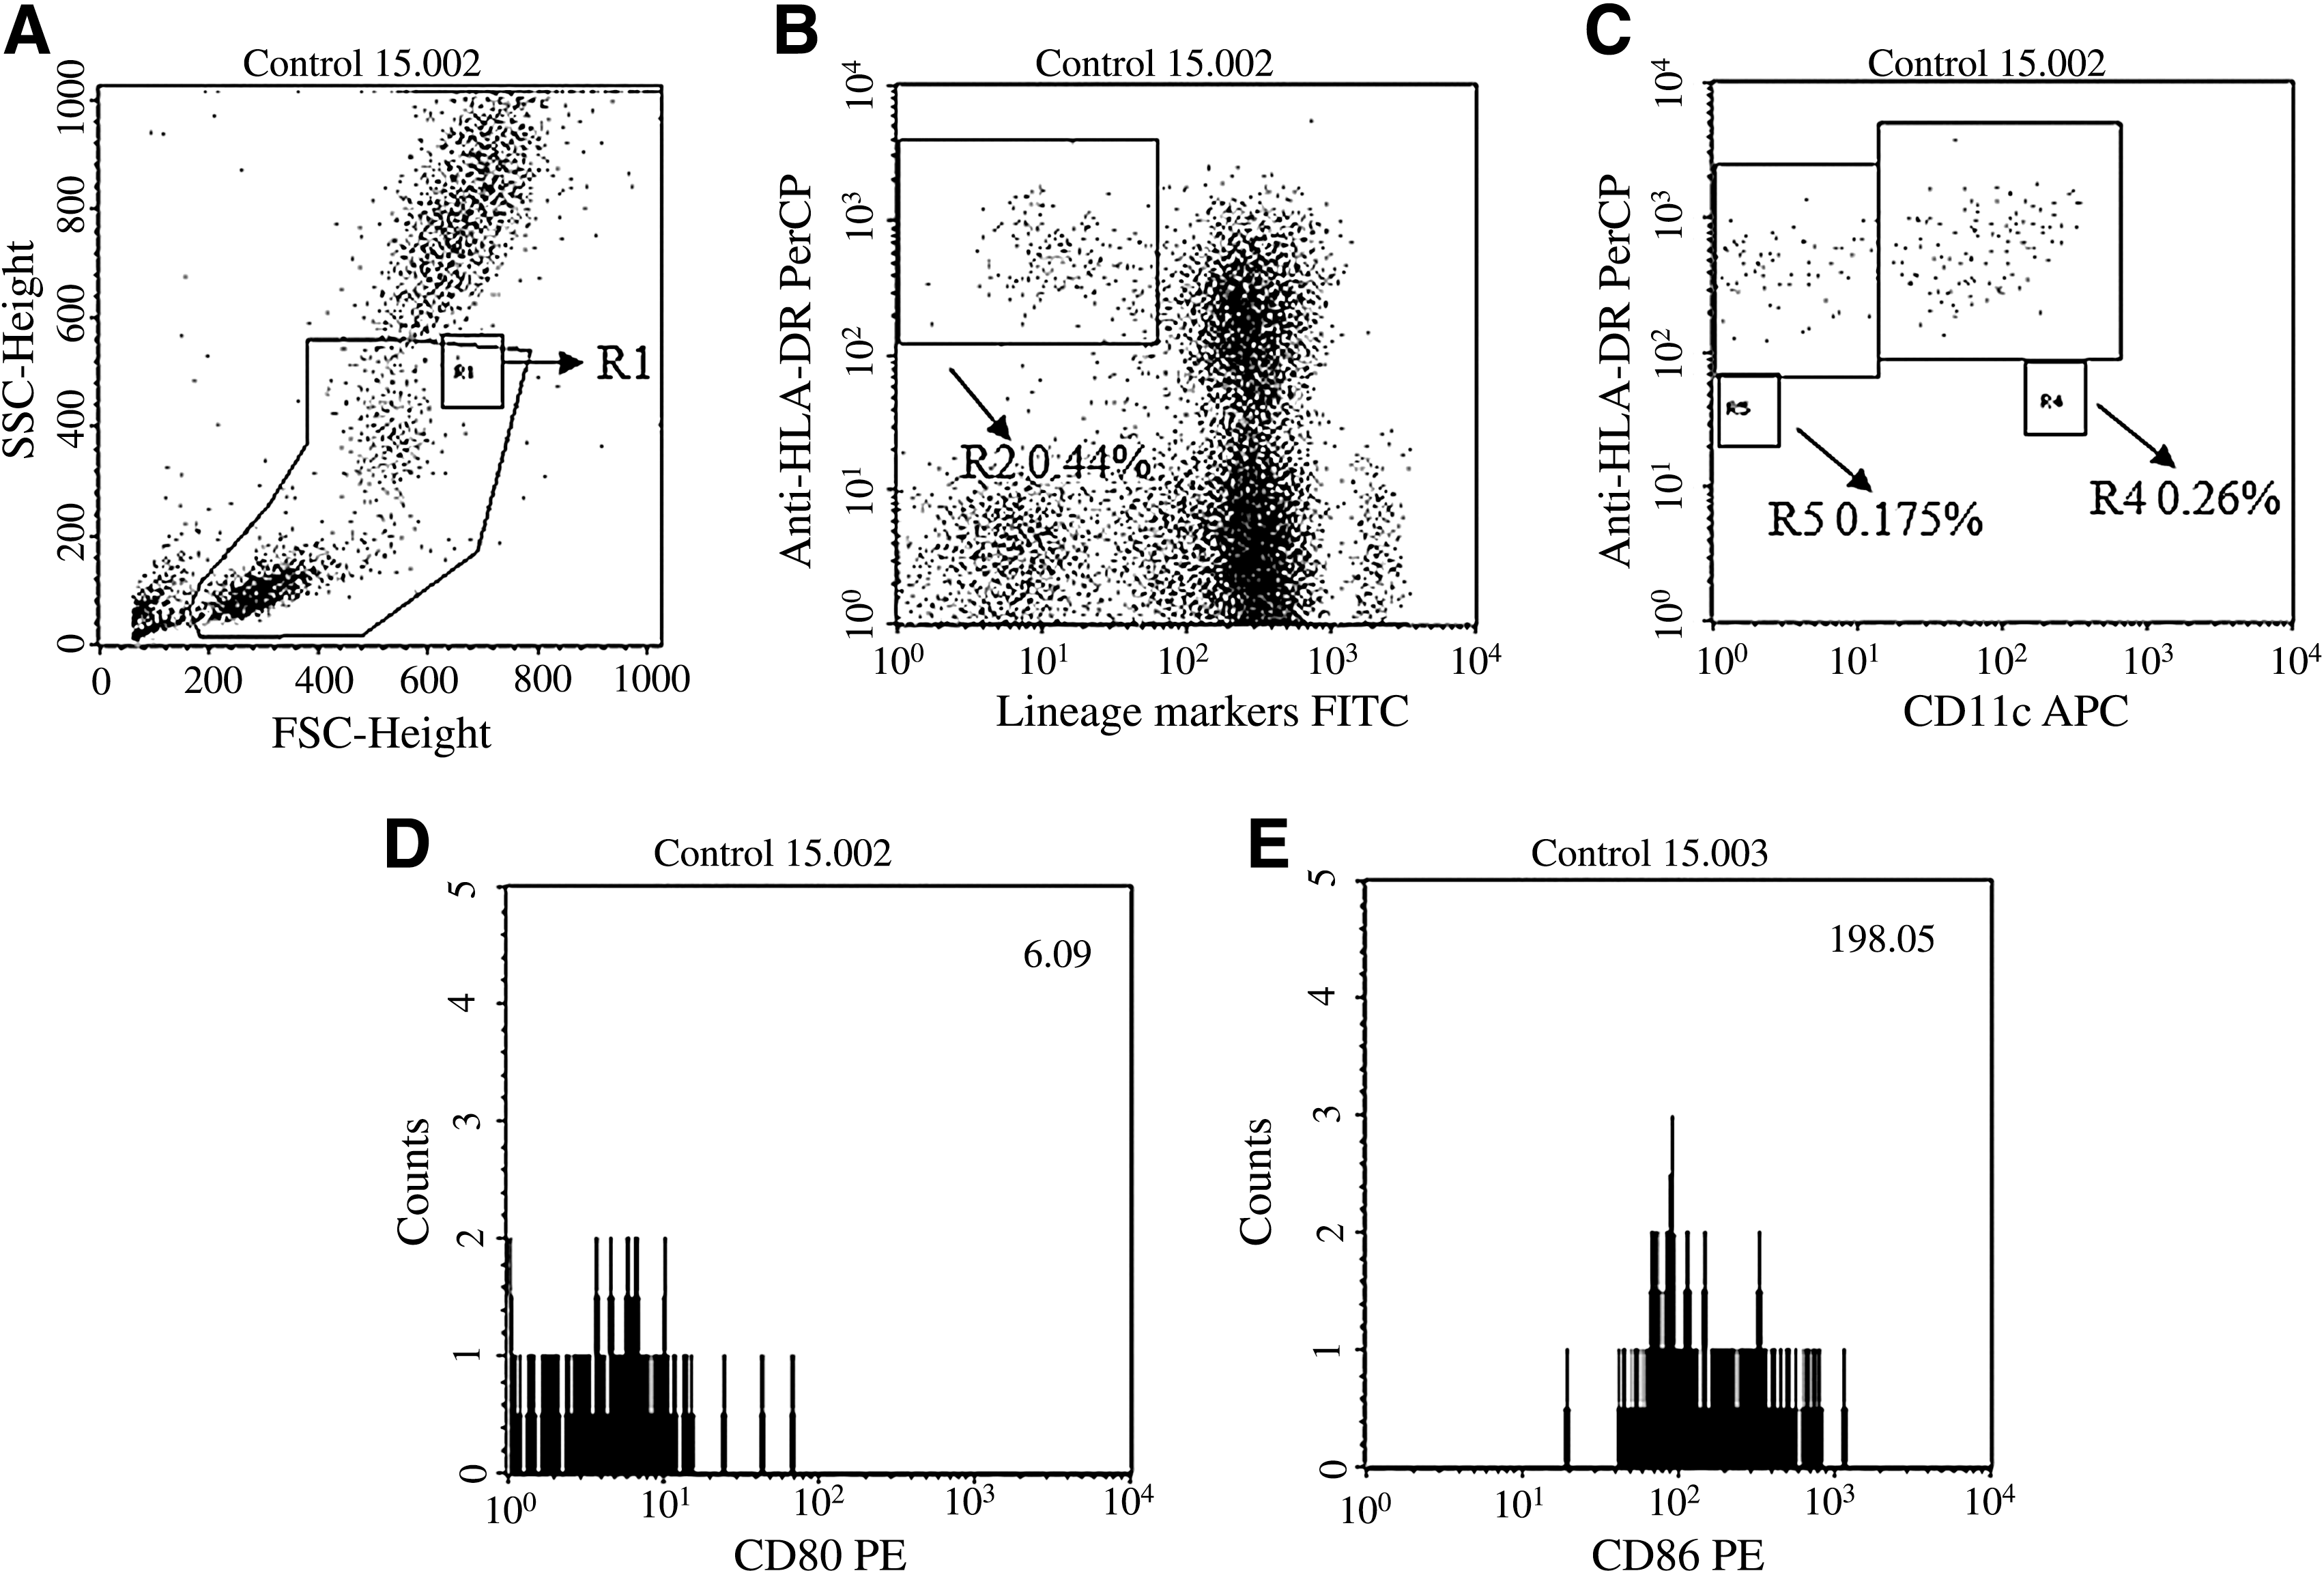
Identification of circulating DC subsets. Peripheral blood mononuclear cells (PBMCs) were stained with antibodies against lineage markers, HLA-DR, CD11c, and CD80 or CD86. Here we have shown results of a representative sample. (
Measurement of plasma interferon-α (IFN-α) levels
A sandwich immunoassay was used for quantitative measurement of IFN-α in plasma (#41100; PBL InterferonSource, Piscataway, NJ) by following the manufacturer's instructions. In brief, the ELISA plate was coated with monoclonal antibody against IFN-α. The binding of IFN-α to the coated monoclonal antibody was detected with a second anti-IFN-α antibody conjugated to horseradish peroxidase. IFN-α levels were calculated by interpolation with readings from a serially-diluted IFN-α standard provided with the kit. All plasma samples were tested undiluted.
Flow cytometric detection of apoptotic markers
Peripheral blood mononuclear cells (PBMCs) from seven controls, five recently-infected patients, six slow progressors, and six AIDS patients were separated using Ficoll density gradient centrifugation. First, 1.5 × 10⁶ cells were stained with antibodies against Lin1, HLA DR, CD123, CD11c, annexin V, and 7AAD (#88-8007 and #00-6993; eBioscience). Then 100,000 gated events were acquired via lymphocyte-monocyte gate on a FACS Aria (BD Biosciences). The DC subsets were then analyzed for percentage of early apoptotic (EA; Annexin V+ 7AAD−), late apoptotic (LA; Annexin V+ 7AAD+), and live (double-negative) cells.
Detection of dendritic cell subset migration using a chemotaxis assay
mDCs and pDCs from seven controls, five recently-infected patients, six slow progressors, and six AIDS patients were tested for migration toward chemokines using a transwell assay as previously reported by Bertho et al. (1) with some modifications. The transwell plates used were 24-well plates with 5-μm membrane pore size (#RZ-19480-09; Corning Life Sciences, Lowell, MA). In order to identify the input number of blood mDCs and pDCs, 1.5 × 10⁶ PBMCs were stained with antibodies against Lin1, HLA DR, CD11c, and CD123, resuspended in 500 μL sheath, and acquired three times at the same flow rate for 60 sec on a FACS Aria. The mean of three mDC and pDC counts thus obtained was considered the number of mDCs and pDCs present in the circulation. Another 1.5 × 10⁶ PBMCs were added to the upper chamber of the transwell plate. The lower chambers were filled with 600 μL medium with or without chemokines, CCL19 (300 ng/mL), CCL21 (250 ng/mL), and CXCL12 (100 ng/mL). The cells were incubated at 37°C for 3 h in a CO2 incubator. The cells from the lower chamber were harvested and stained with the antibodies mentioned above and acquired using the same parameters as those described above. The mean mDC and pDC counts obtained were then used to calculate the percentage of migration.
Statistical analysis
DC percentages and MFI values for CD80 and CD86 expression, pre-ART and post-ART values of DC percentages, the percentage of apoptotic DCs and the percentage of migration among the different groups were compared using the Mann-Whitney U test. Correlations between CD4+ T-cell counts, viral load, and blood DC percentages was done using Spearman's correlation coefficient, and a p value of <0.05 with a 95% confidence interval was considered statistically significant. IFN-α ELISA results were analyzed using a sigmoid curve with variable slope. GraphPad Prism 5.0 software was used for statistical analysis (GraphPad Software, San Diego, CA).
Results
CD4+ T-cell counts and viral load estimation
The mean CD4 count was 550 cells/mm3 for recently-infected individuals (range: 226–898/mm3), 702 cells/mm3 for slow progressors (range: 521–1163/mm3), and 97 cells/mm3 for AIDS patients (range: 18–187/mm3). The mean viral load for patients with recent HIV infection was 0.306 × 10⁵ RNA copies/mL (range: 0.0217–1.39 × 10⁵), for slow progressors was 0.107 × 10⁵ RNA copies/mL (range: <400–0.35 × 10⁵), and for AIDS patients was 2.01 × 10⁵ RNA copies/mL (range: 0.012–6.65 × 10⁵) before the initiation of ART. After 6 months of ART, plasma viral load in the AIDS patients had reduced to <400 RNA copies/mL in all except three patients. Their CD4 counts increased significantly, from 97 to 305 cells/mm3 (p < 0.0001; range: 123–537 cells/mm3).
The circulating myeloid DC population and expression of CD80 and CD86 on myeloid DCs
There was a significant reduction in the mean percentage of mDCs in the AIDS patients (0.086%; range: 0.040–0.145%; p < 0.0001), whereas the percentages of mDCs in recently-infected individuals (0.14%; range: 0.075–0.23%), and slow progressors (0.15%; range: 0.06–0.205%) were comparable to the percentages seen in the control group (0.16%; range: 0.05–0.26%; Fig. 2A). The mDC percentages did not change during the 2-year follow-up period for the recently-infected individuals (data not shown). After the initiation of ART, a significant increase was observed in the mean percentage of mDCs (0.086% to 0.18%; n = 16; range: 0.095–0.35; p < 0.0001) at the 6-month follow up visit (Fig. 2B). There was no significant difference in the expression of CD80 and CD86 on mDCs in recently-infected patients or slow progressors, whereas in the AIDS patients CD86/CD80 expression was found to be significantly higher (8.52; range: 5.28–15.72 for CD80, and 188.18; range: 89.98–525.97 for CD86) than that in the control group (6.53; range: 4.69–8.73 for CD80, and 110.08; range: 76.19–198.05 for CD86), even though there was a statistically significant reduction in mDC percentages (p = 0.0004 and p = 0.0042 respectively; Fig. 2C and 2D).
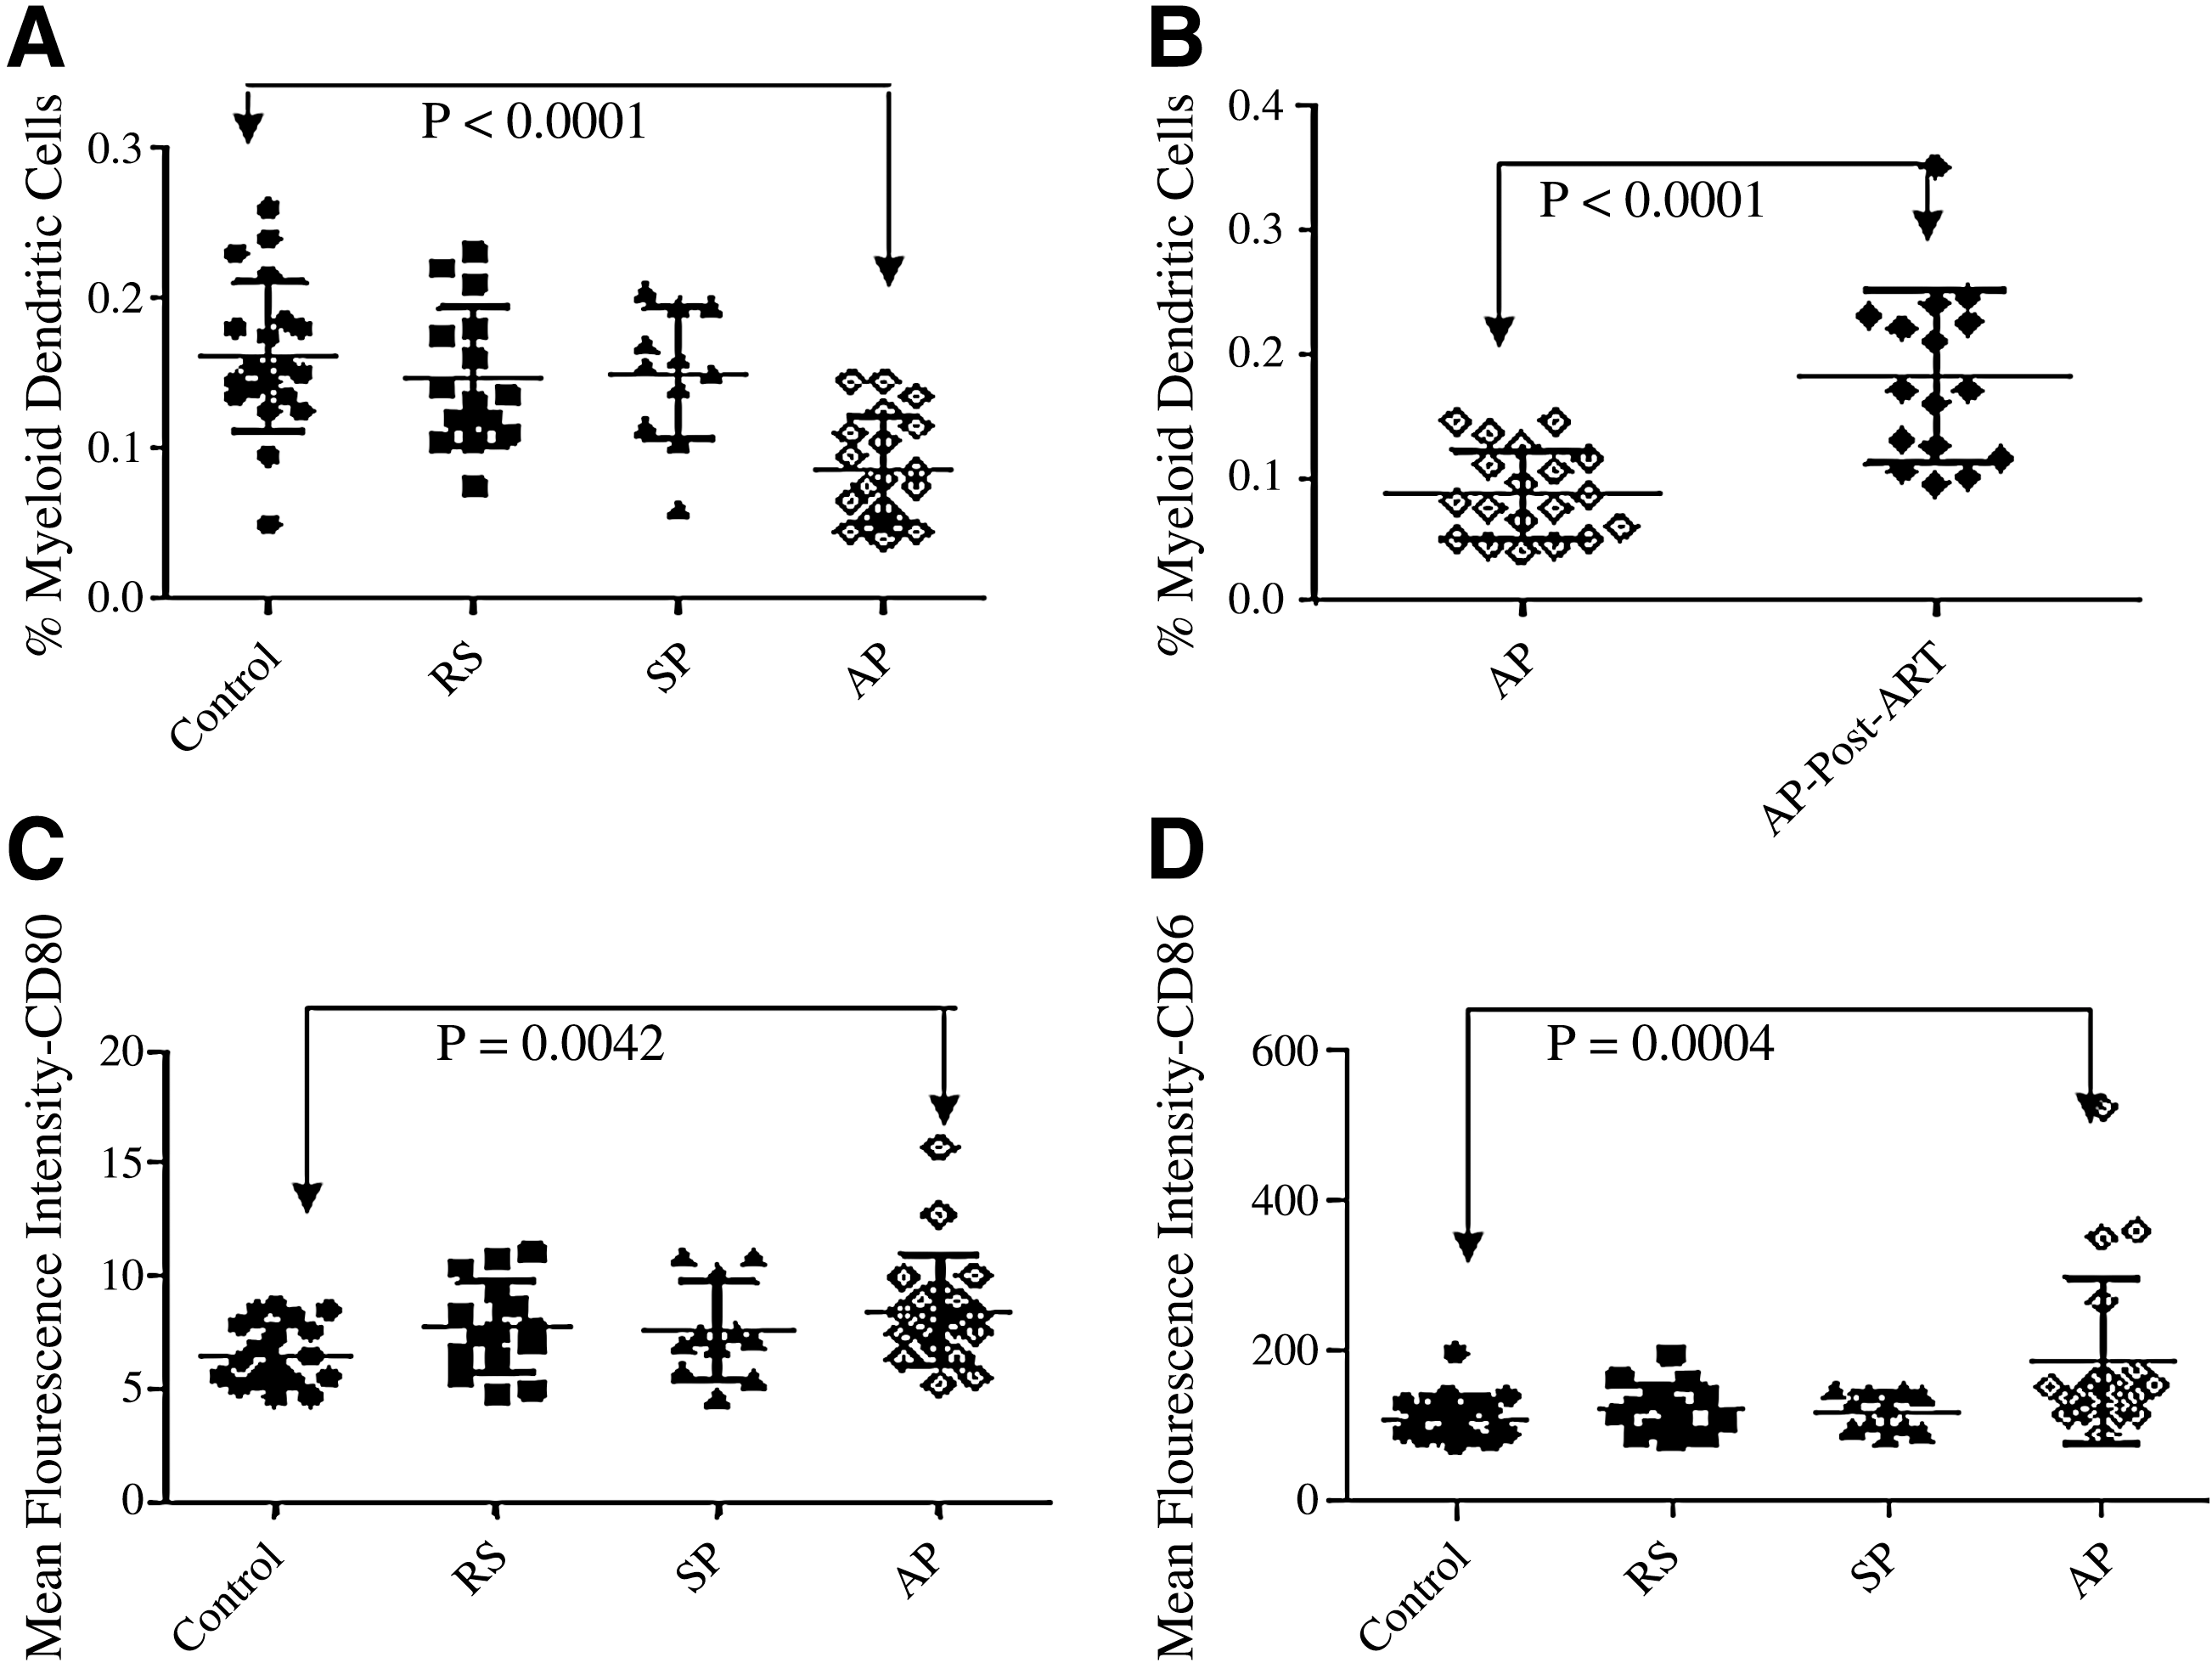
Frequencies of blood mDCs and CD80 and CD86 expression before and after ART. On the x axis, RS indicates recently-infected patients, SP represents slow progressors, and AP represents AIDS patients. (
Peripheral blood plasmacytoid DCs and plasma IFN-α levels
Mean pDC percentages were found to be significantly lower in patients with recent HIV infection (0.12%; range: 0.06–0.185: p = 0.0092), and in AIDS patients (0.079%; range: 0.015–0.165; p < 0.0001), than in controls (0.18%; range: 0.075–0.345; Fig. 3A). Slow progressors (0.14%; range: 0.065–0.23) showed pDC percentages comparable to uninfected controls. pDC percentages remained lower during subsequent follow-up visits of recently-infected patients compared to controls (Fig. 3B). Successful ART in 16 of 19 AIDS patients also failed to restore the depleted pDC population (0.08%; range: 0.02–0.16; Fig. 3C).
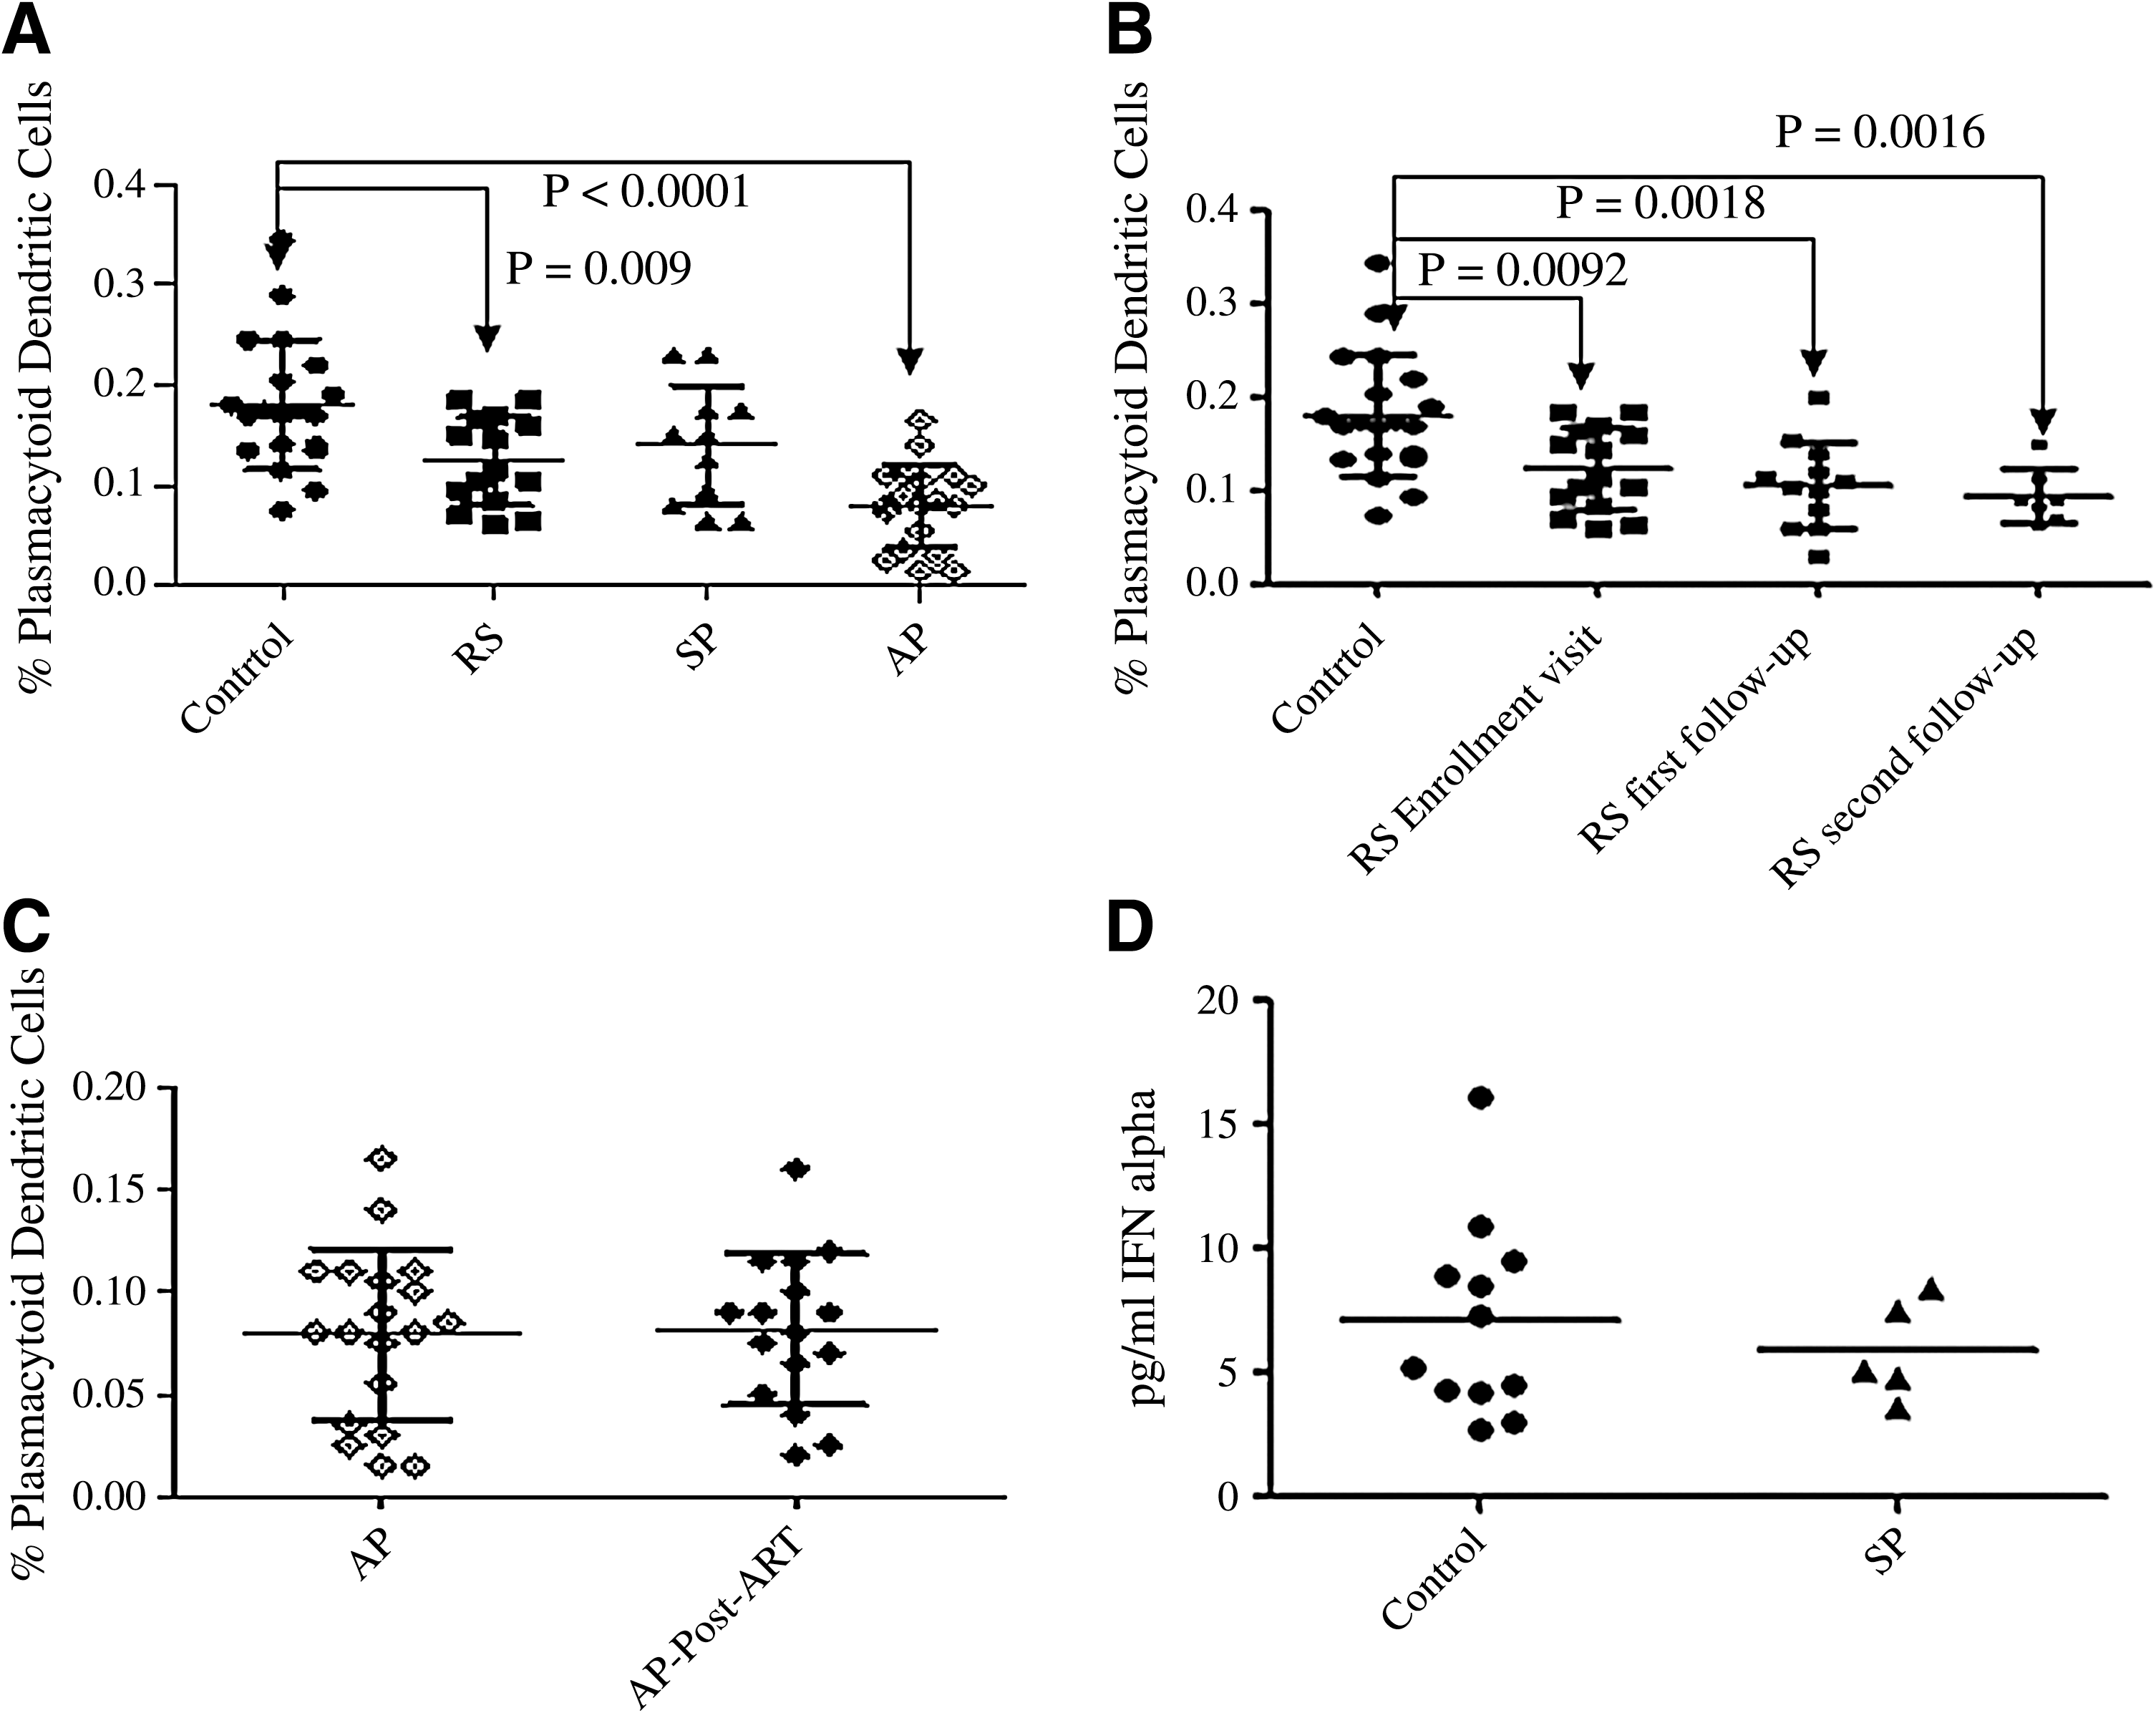
Quantitation of circulating pDCs and plasma IFN-α levels in study participants before and after ART. On the x axis, RS indicates recently-infected patients, SP, represents slow progressors, and AP, represents AIDS patients. (
Plasma IFN-α levels were undetectable in all samples from recently-infected individuals as well as AIDS patients. Interestingly, 12 out of 20 control individuals, and 5 out of 11 slow progressors showed detectable levels of IFN-α when interpolated using a non-linear four-parameter fit curve. HIV-uninfected individuals had 7.11 pg/mL of IFN-α (range: 2.76–16.13 pg/mL), whereas slow progressors had 5.89 pg/mL (range: 3.60–8.43 pg/mL). R2 of the best fit curve was 0.9996 with 99% confidence intervals (Fig. 3D).
Correlation of DC subsets with CD4+ T-cell counts and viral load
mDC and pDC percentages in all study participants correlated positively with CD4+ T-cell counts (r = 0.5183, p = 0.0003 for mDCs; r = 0.5244, p = 0.0002 for pDCs; Fig. 4A and 4B), and negatively with viral load (r = −0.4300, p = 0.0099 for mDCs; r = −0.4172, p = 0.0126 for pDCs; Fig. 4C and 4D).
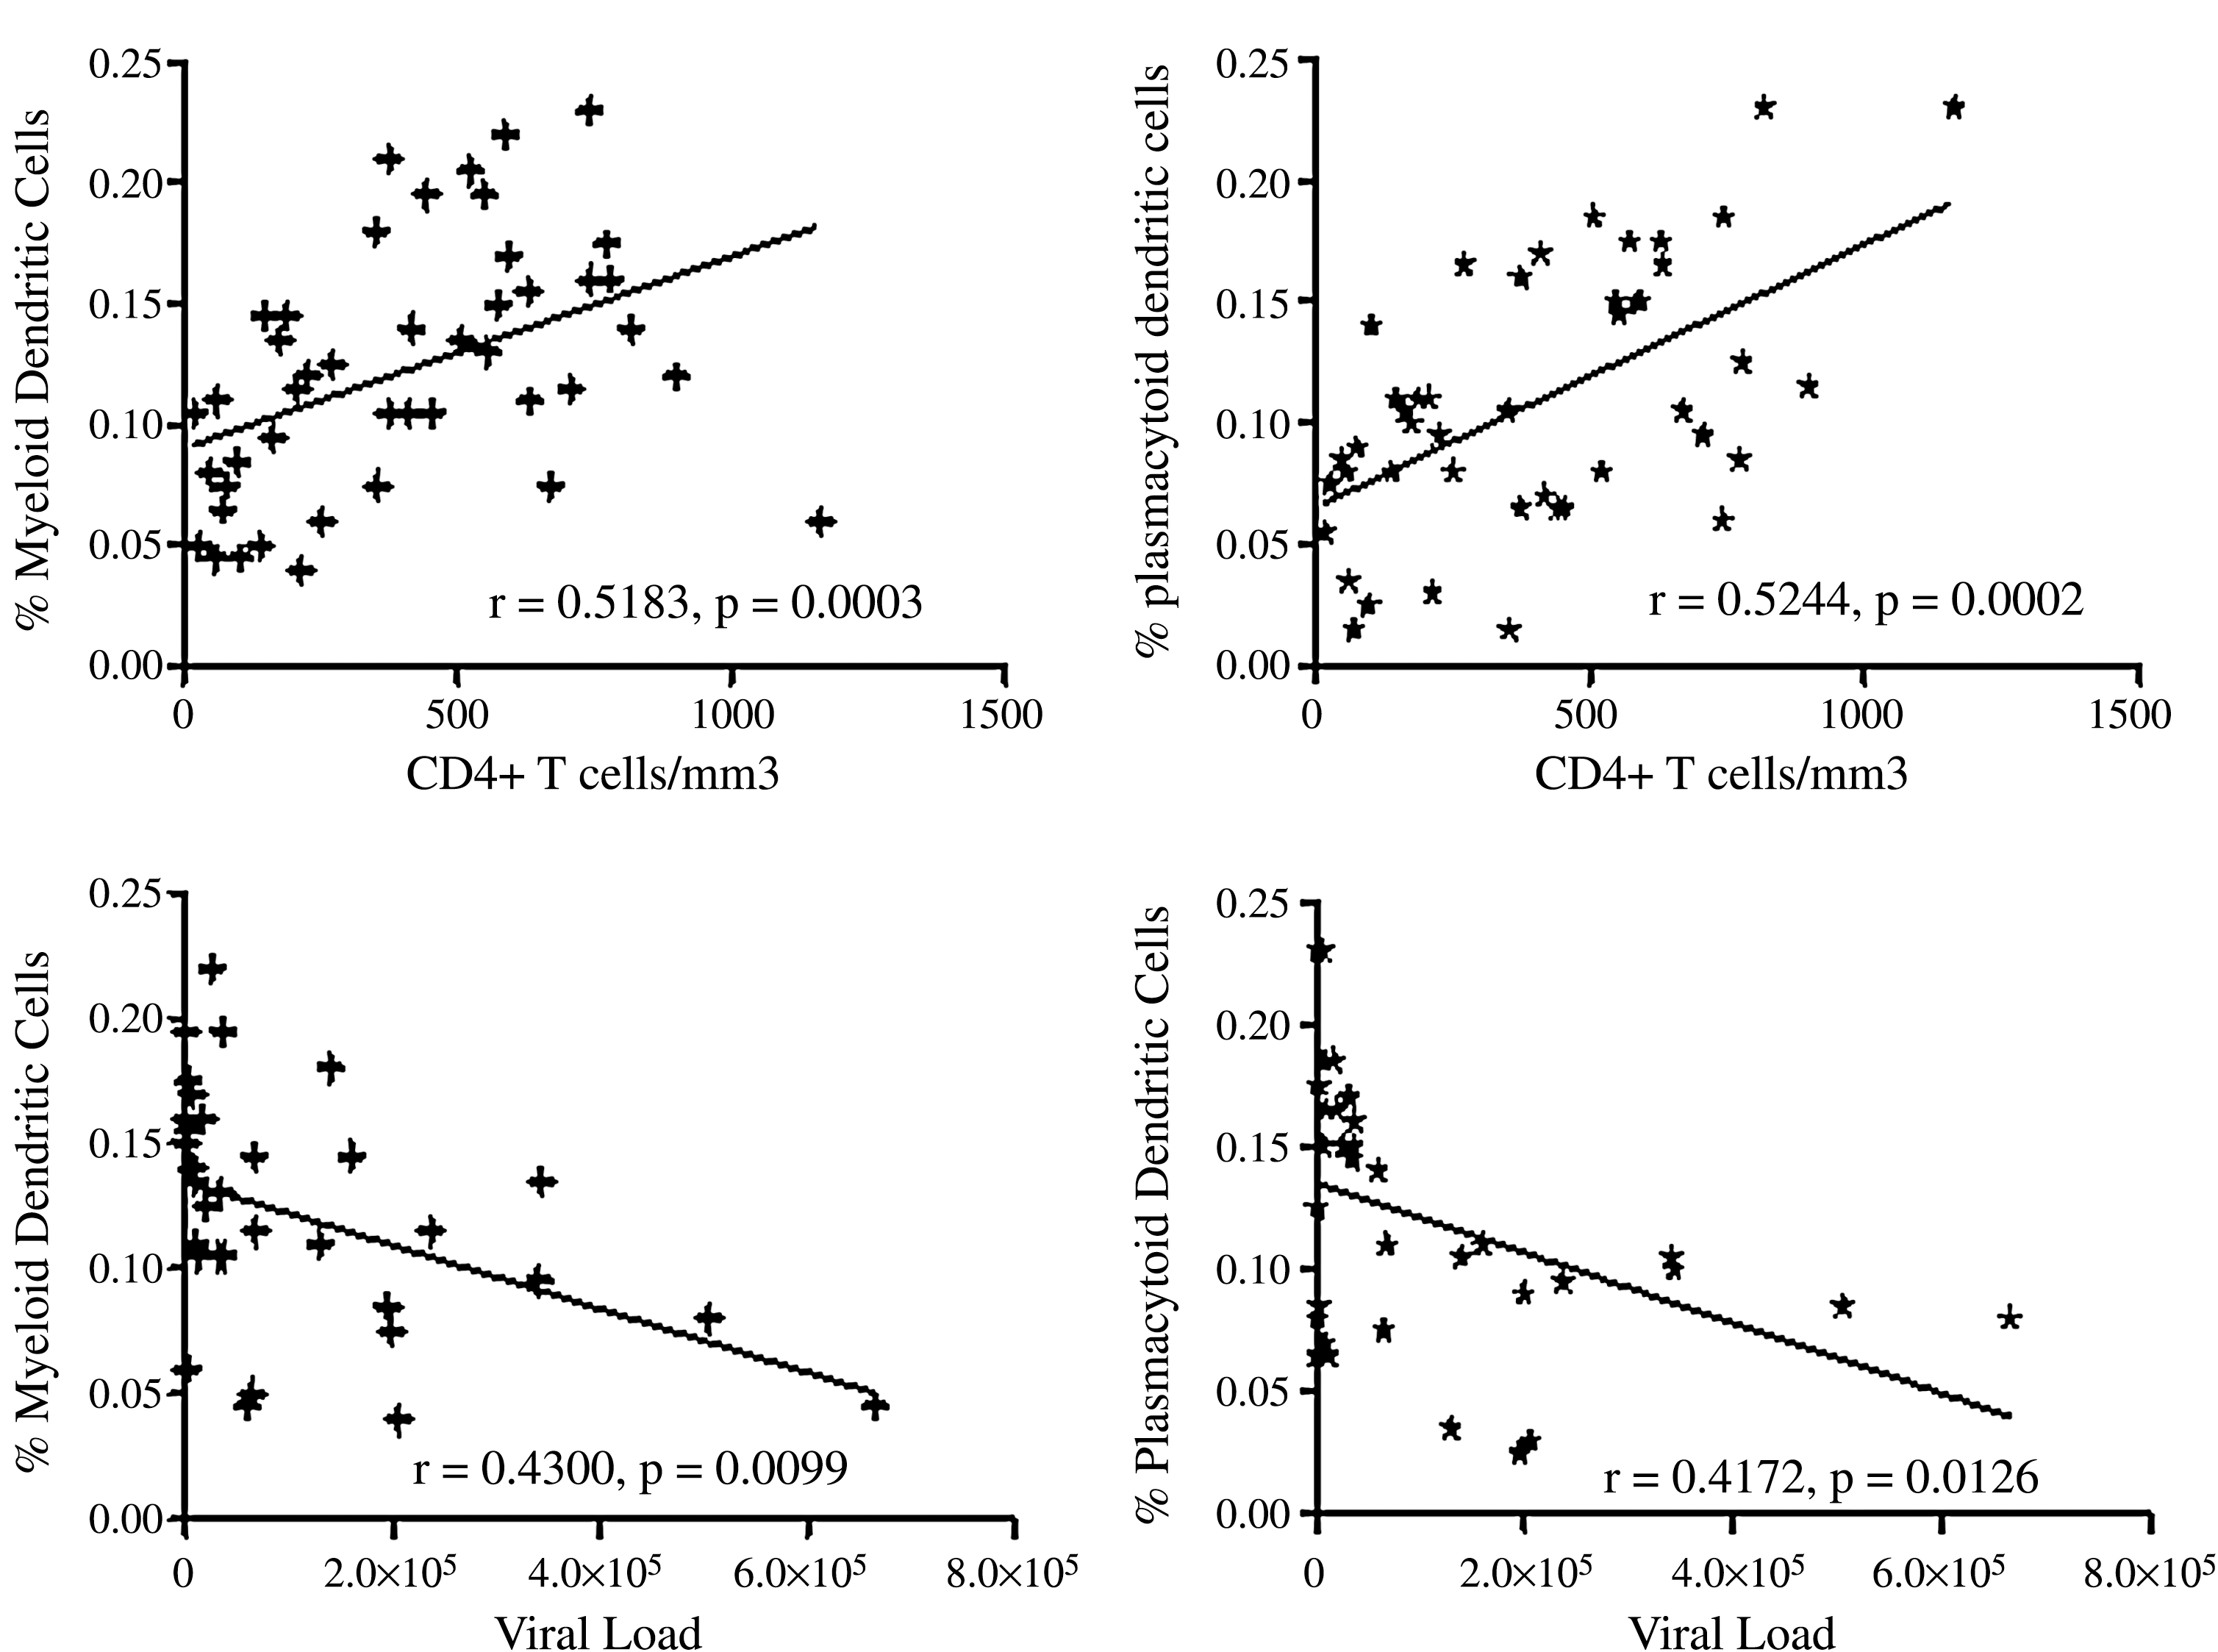
Correlation of mDC and pDC percentages with CD4+ T-cell counts and viral load values. Shown on the x axis are plots with CD4+ T-cell counts or viral load values, and on the y axis percentages of DC numbers. The diagonal line depicts linear regression. The mDC and pDC percentages correlate positively with the CD4+ T-cell counts, and negatively with viral load.
Detection of apoptotic markers on circulating DC subsets using flow cytometry
Flow cytometric analysis of annexin V- and 7AAD-stained DC subsets showed that the mean percentage of apoptotic mDCs was 38.82% (range: 12.85–78.8%) in recently-infected patients, was 80.24% (range: 71.95–89.39%; p = 0.0012) in AIDS patients, and 16.01% (range: 4.88–35.82%) in slow progressors, compared to 8.62% (range: 1.07–35.62%) in controls. One of the five recently-infected patients and one of the six slow progressors showed 0% apoptotic mDCs, and these two patients were not used in the statistical analysis. The mean percentage of apoptotic pDCs was 89.05% (range: 75.4–97.1%; p = 0.0025) in recently-infected patients, 93.02% (range: 81.48–97.14%; p = 0.0012) in AIDS patients, and 29.9% (range: 2.7–72.04%) in slow progressors, compared to 5.56% (range: 1.5–12.04%) in controls. The percentage of apoptotic mDCs in AIDS patients was significantly higher (p = 0.004) than in the slow progressors. The mean percentages of apoptotic pDCs (p = 0.002) in AIDS patients and the recently-infected (p = 0.004) were significantly higher than in the slow progressors (Fig. 5A–5E).
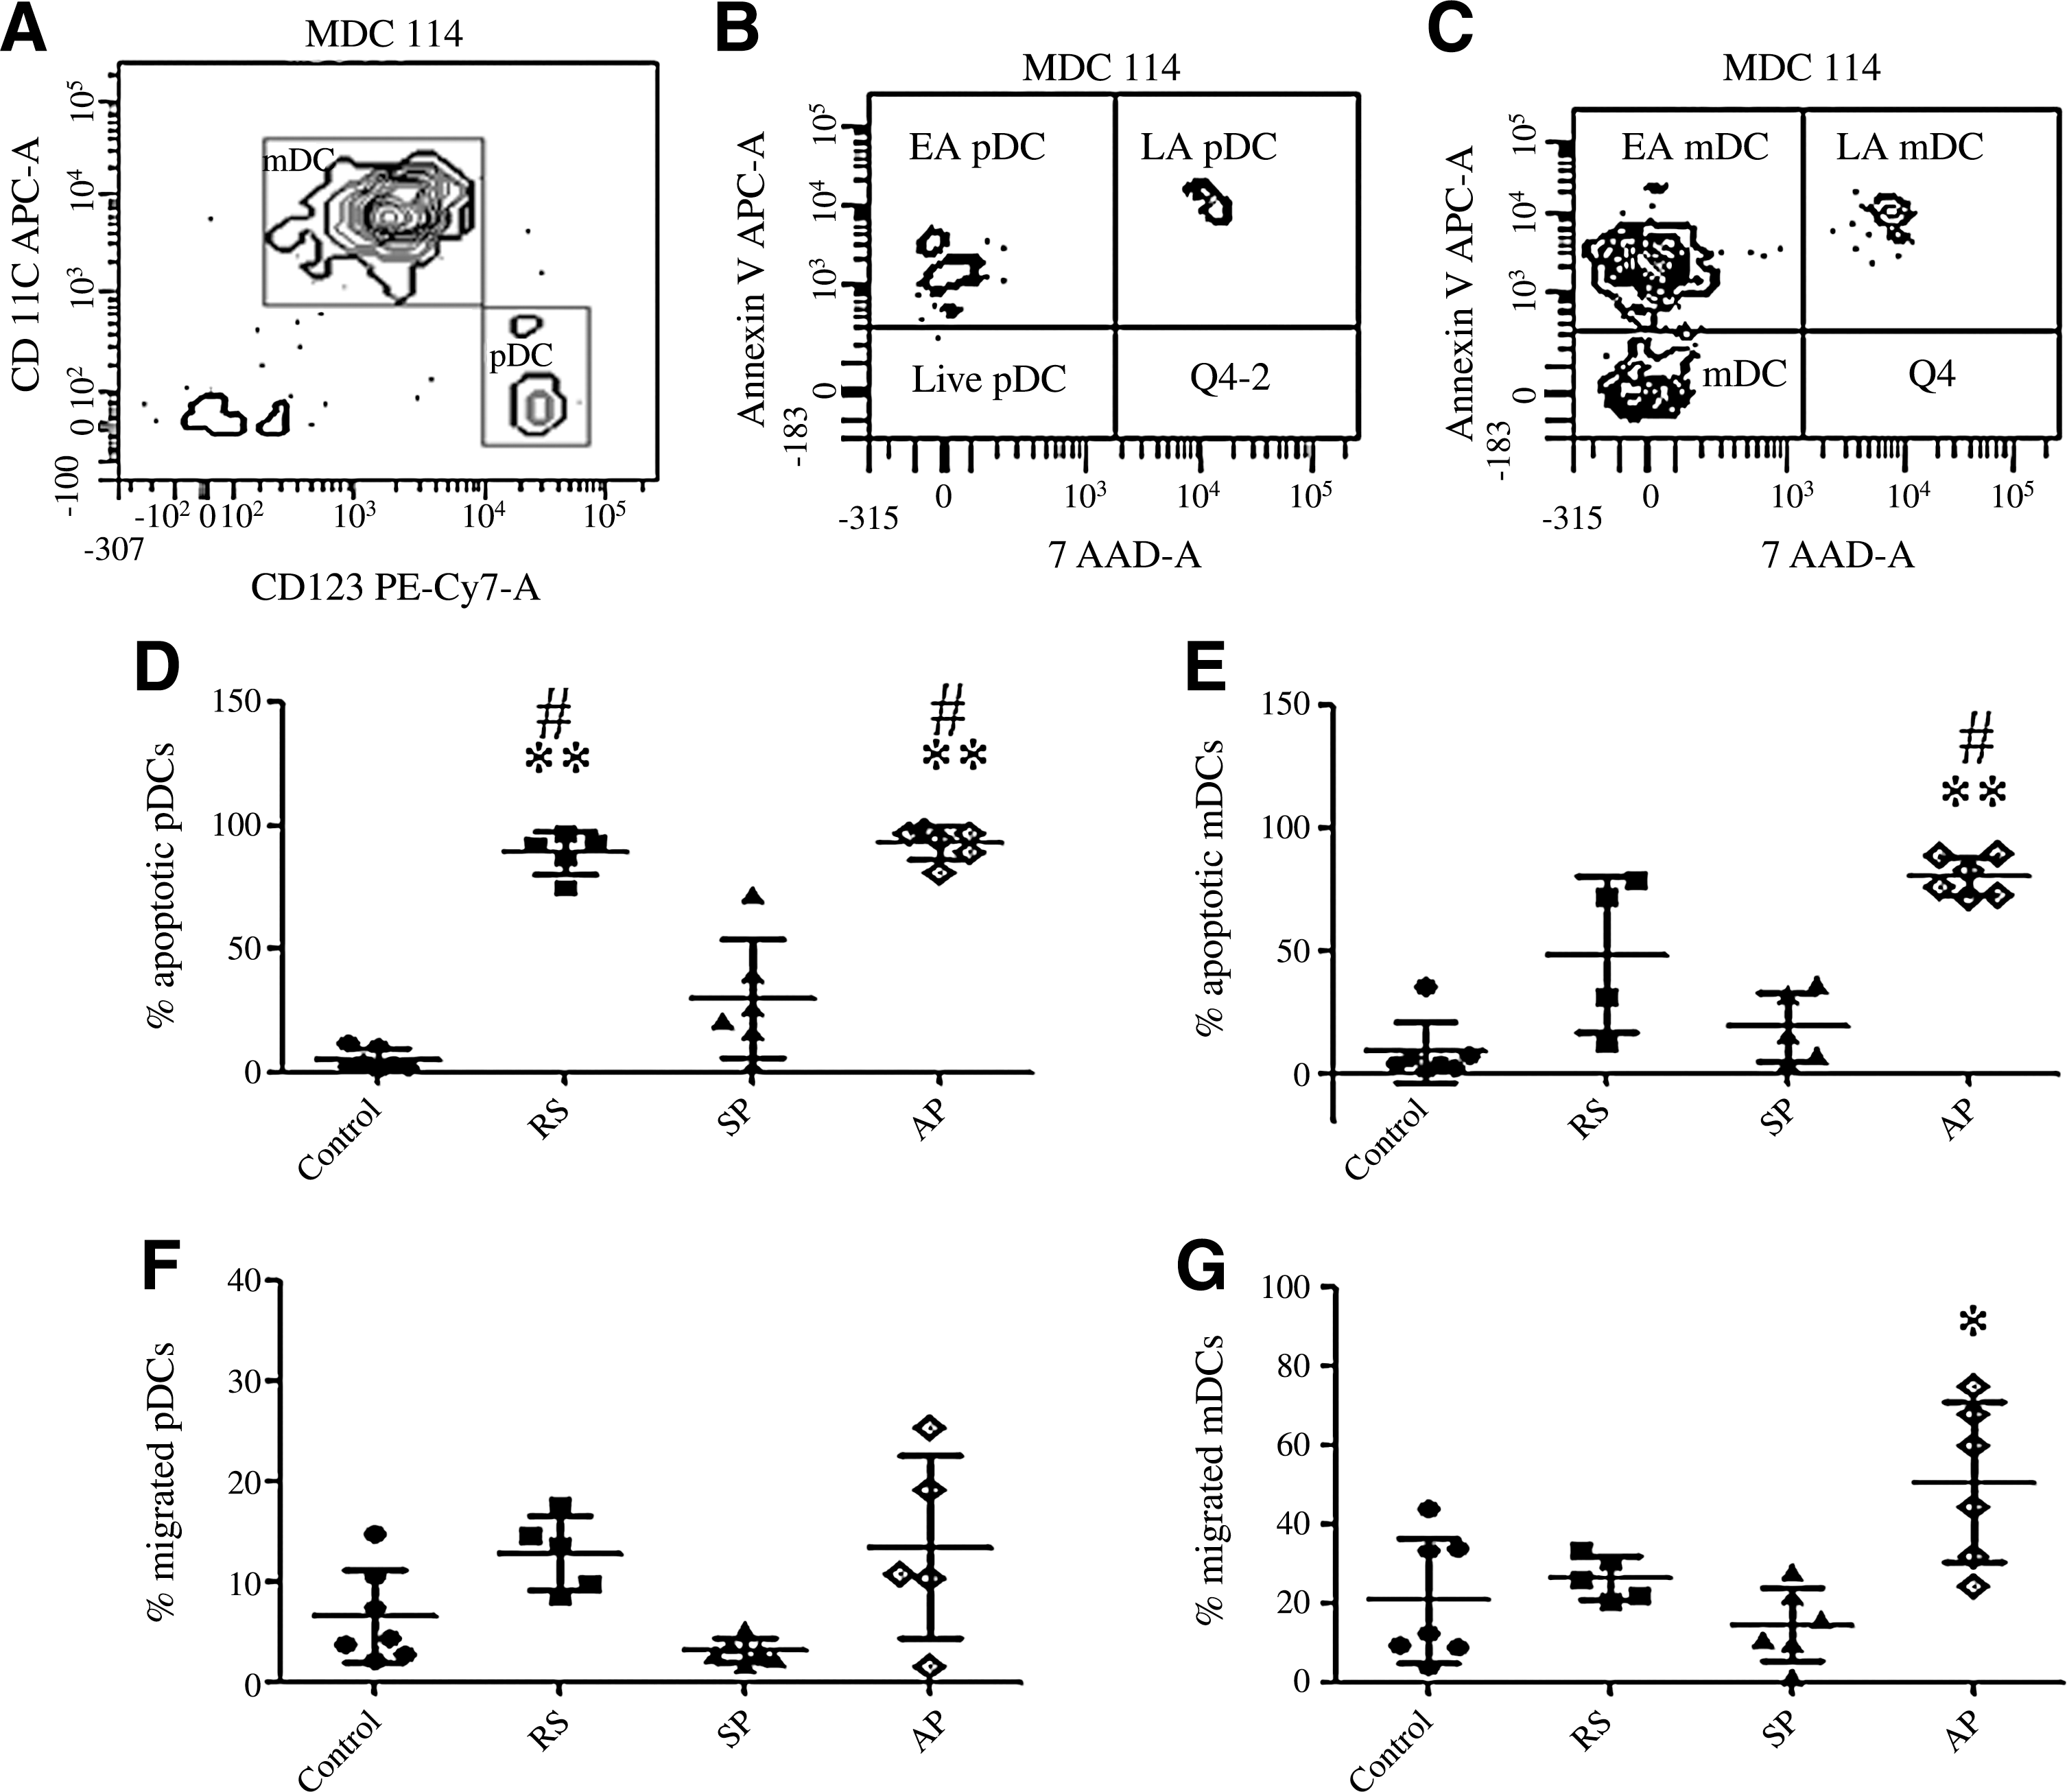
Detection of apoptotic markers on mDCs and pDCs, and assessment of the capacity of the circulating DCs to migrate towards chemokines. On the x axis, RS indicates recently-infected patients, SP represents slow progressors, and AP represents AIDS patients. (
Detection of mDC and pDC migration using a chemotaxis assay
An assay to detect migration of mDCs and pDCs using a transwell plate showed that the mean percentage of migration of mDCs was 26.64% (range: 20.51–33.59%) in recently-infected patients, 50.82% (range: 24.65–75%; p = 0.03) in AIDS patients, and 14.83% (range: 1.68–28.19%) in slow progressors, compared to 21.03% (range: 4.06–44.06%) in controls. The mean percentages of migrated pDCs were 12.88% (range: 8.57–17.64%) in recently-infected patients, 11.27% (range: 1.56–25.53 %) in AIDS patients, and 3.22% (range: 1.79–5.3%) in slow progressors, compared to 6.61% (range: 2.31–14.86%) in controls. One of the 6 AIDS patients showed 0% pDC migration and was not included in the statistical analysis. The percentages of pDC migration did not differ significantly between the HIV-1-infected and control groups; however, the slow progressors showed reduced pDC migration compared to the recently-infected and AIDS patients (Fig. 5F and 5G).
Discussion
While pDCs play a major role in the innate immune response, mDCs are important for induction of the antigen-specific immune response. HIV is known to cause dysfunction in DCs, but there are no data that explain the mechanisms responsible for the observed decrease in circulating DCs. We determined the percentages of pDCs and mDCs in the circulation, and studied markers of DC function, such as co-stimulatory molecules (CD80/CD86), and IFN-α secretion at different stages of HIV disease. Recently-infected patients were followed at two 3-mo follow-up visits after enrollment. AIDS patients were followed for one visit after 6 mo of ART to assess the effect of ART on DC numbers and function. The results were compared with the findings obtained in slow progressors and uninfected individuals. Here we show, for the first time, that during HIV infection apoptosis is main cause of pDC depletion, while migration to lymph nodes and apoptosis both contribute to reductions in circulating mDCs.
Although no difference was observed in the mDC percentages in early HIV infection and in slow progressors, there was a significant decrease in mDCs during the advanced stage (AIDS) compared to uninfected individuals. Successful ART in AIDS patients resulted in restoration of mDC percentages. Our findings are in agreement with those of previous reports (5,10,12,18,27,34). In addition, we looked at the effect of HIV infection on the expression of functionally significant co-stimulatory molecules on mDCs. We did not find any difference in the expression of CD80/CD86 on mDCs during early HIV infection and in slow progression. However, increased CD80/CD86 expression on mDCs in advanced disease (although mDC percentages were significantly lower) indicates the presence of activated mDCs. The migratory nature of these activated DCs (as shown by our results), and their capacity to interact closely with T cells in the lymphoid region may be a major contributing factor to the chronic generalized immune activation seen at this stage of the disease. ART did not have any noticeable effect on the expression of co-stimulatory molecules. Downregulation of expression of CD80/CD86 is shown to be mediated by HIV-1 Nef (4) and Vpr (24) in mouse DC cell lines. Interestingly, Lore et al. have shown reduced CD80/CD86 expression on DCs in lymphoid tissue during acute HIV infection (23). Our data fail to confirm these findings in vivo. One probable reason may be that we have only studied the peripheral compartment of the immune system, and this area may not completely explain immune interactions involving DCs in HIV infection.
pDCs, on the contrary, were found to be depleted in both recent and advanced HIV infection, compared to patients with slow progression and uninfected controls. In addition, a reduction in pDCs in recent HIV infection was evident during subsequent follow-up visits as well. Six months of successful ART in AIDS patients also failed to bring pDC numbers back to normal. This indicates that the depletion of pDCs inflicts permanent damage to the immune system that occurs at early stages of HIV infection. Assessment of plasma IFN-α levels in these patients as a marker of pDC activation and function revealed undetectable levels in the early and late stages of disease, as well as in treated patients. This may reflect already reduced pDC numbers that fail to recover, even after successful ART. HIV-uninfected individuals and slow progressors, however, showed very low but comparable levels of IFN-α. There are contradictory reports regarding the effect of HIV infection on IFN-α secretion by pDCs. Some studies have shown impairment in IFN-α secretion by pDCs in HIV-infected individuals (3,5,10), which may be due to inhibition of TLR9-mediated activation of pDCs by HIV-1 gp120 (25), while others suggest that despite the decrease in their numbers, the remaining pDCs are normally activated by a TLR agonist, and strongly suppress HIV replication via a IFN-α–mediated mechanism (26).
There are two plausible reasons for the depletion of circulating DCs seen after infection with HIV. First, the DCs may have homed to lymphoid areas (29,30), and may no longer be in circulation. Second, some of the DCs may be destroyed in the periphery by the virus itself through mechanisms like apoptosis. Such a phenomenon is reported in measles virus infection, in which the virus induces destruction of DCs via Fas-mediated apoptosis (14,31). Hence we looked for expression of the apoptotic markers annexin V and 7AAD in circulating DC subsets in HIV-infected individuals, and also assessed their capacity to migrate using transwell assays.
mDCs in the advanced stage of the disease showed increased percentages of apoptotic cells and higher migratory capacity compared to controls and slow progressors, while apoptotic pDCs comprised a significant proportion of circulating pDCs in recent and advanced HIV infection. Slow progressors also showed the presence of apoptotic pDCs; however, they were fewer than in individuals with recent and advanced HIV infection. pDCs from HIV-infected individuals did not show any difference in their migratory capacity compared to controls, but the slow progressors showed a lower percentage of migrated pDCs than in early and advanced HIV infection (though the difference was not statistically significant). Our findings on the migratory properties of DC subsets in slow progressors are similar to those reported by Dillon et al., who showed that mDCs and pDCs with a partial activation phenotype accumulate in lymphoid tissue during asymptomatic chronic HIV infection (8), and that this adds significantly to their migratory fate in early and advanced HIV infection. These findings in combination with our results indicate that the early and irreversible loss of pDCs seen during HIV infection is primarily due to virus-induced apoptosis, whereas both migration and apoptosis contribute to the loss of mDCs seen in advanced stages of disease. Thus the reduction in viral burden after suppressive ART reduces migration of mDCs to lymphoid areas, leading to their increased numbers in the circulation; however, it does not have any effect on pDCs.
Our results indicate that HIV infection results not only in a persistent decrease in pDC numbers by the induction of apoptosis, but it also impedes their function. pDC numbers correlated positively with CD4+ T-cell counts, and negatively with viral loads. Since pDCs are important mediators of the innate antiviral immune response, early irreversible loss of pDCs during HIV infection may be responsible for the impaired innate anti-HIV immune response. This compromised innate immune response in turn affects the HIV-specific response. Indeed, a decrease in pDC numbers has been found to be associated with clinical manifestations of acute HIV infection (18), and the presence of opportunistic infections in chronic infection (34). However, the capacity of slow progressors in our study, and that of LTNPs (34) to retain functional pDCs, imply that pDCs may play an important role in HIV virus control and the subsequent progression to AIDS. Preventing or reducing pDC apoptosis early in HIV infection may play an important role in controlling virus replication.
Footnotes
Acknowledgments
The authors would like to thank all of the study participants, our immunology laboratory colleagues, and clinic staff for the support they have given. We give special thanks to Ms. Rajni Bagul from the NARI clinic for her help with patient samples.
This work has been supported as an intramural project by the National AIDS Research Institute, and the Indian Council of Medical Research, and was financially supported by institutional funding sources. Ms. Singh is a Council of Scientific and Industrial Research Senior Research Fellow, and has been provided a 5-year research fellowship.
Portions of this work have been published in the following conferences: A poster presentation at the XVII International AIDS Conference held at Mexico City, Mexico, August 3–8, 2008 (Meera Singh, Madhuri Thakar, Snehal Suregaonkar, Manisha Ghate, Ramesh Paranjape. Plasmacytoid Dendritic Cells [pDCs] Play a Role in the Disease Progression Among Persons Infected with HIV-1). The abstract was accepted for a poster presentation at the 15th Conference on Retroviruses and Oppportunistic Infections (CROI 2008), held at Boston, Massachusetts, from February 3–6, 2008 (Meera Singh, Madhuri Thakar, Snehal Suregaonkar, Manisha Ghate, and Ramesh Paranjape. Reduction in the Absolute Number Myeloid Dendritic Cells [mDCs] and Plasmacytoid Dendritic Cells [pDCs] in HIV Infection Correlates with Disease Progression).
Author Disclosure Statement
No competing financial interests exist.