
Abstract
Varicella-zoster virus (VZV) causes both primary varicella, and through reactivation of the virus, herpes zoster. It is hypothesized that VZV-immune adults may reduce the probability of developing herpes zoster through exposure to varicella. In this study we examine the existence of immunological boosting in VZV-immune adults after close contact with primary varicella. We followed-up 18 parents with household exposure to primary varicella for 1 y. Fifteen age-matched healthy and 20 older volunteers served as control groups. Cellular (IFN-γ ELISPOT) and humoral responses were measured. Data analyses were performed by t-tests and linear mixed models. The young control group only showed higher cellular responses than the older control group and the exposed group 1 mo after exposure. The exposed group had a strong tendency toward higher cellular responses compared to the older control group, reaching significance 1 y post-exposure. The best fitting linear mixed model predicts a decline in cellular response of 50% between 1 wk and 1 mo post-exposure, followed by an increase to attain an 80% higher level at 1 y compared to the first week post-exposure. No significant results emerged based on the humoral response of the individual parents in the exposed group, despite a general tendency toward higher antibody concentrations in the exposed versus the control groups. No significant difference in humoral immunity was found between the control groups. One year after initial re-exposure to VZV, VZV-immune adults showed a rise in cellular response as assessed by IFN-γ ELISPOT, and steady-state levels for the humoral response.
Introduction
Materials and Methods
This study was approved by the local ethical committee (University Hospital Antwerp). Written informed consent was obtained from the study participants.
Recruitment and description of study participants
Twenty-three healthy parents of children with acute primary varicella were recruited through day-care centers in Antwerp (the exposed group, EG). As soon as possible (5 ± 2 d since the first appearance of clinical symptoms of primary varicella), 40 mL of peripheral blood was taken from the parents (A-dataset), in order to assess humoral and cellular immunity. After 1 mo (34 ± 3 d, B-dataset), 7 mo (213 ± 11 d, C-dataset), and 12 mo (372 ± 4 d, D-dataset), identical amounts of blood were taken. Five participants were excluded due to pregnancy or recollection of a herpes zoster episode less than 30 y ago, and 1 participant was excluded at 7-mo follow-up due to pregnancy. Thus 18 participants (9 female), aged 33 ± 5 y, met our inclusion criteria, and 17 (8 female) completed follow-up to 12 mo. A group consisting of young healthy individuals not recently exposed to VZV was chosen (age- and gender-matched) as a control group (healthy young control group [HYCG]; n = 15, aged 31 ± 5 y, 7 female). Twenty older healthy individuals (aged 71 ± 12 y, 6 female) were recruited through general practitioners as a healthy old control group (HOCG), to serve as a reference for the ages with higher herpes zoster incidence. Each individual in the control groups provided a single sample.
All participants in this study were VZV-immune as proven by the IgM-negative and IgG-positive status at time point A. None of the participants in this study had received VZV vaccination. Furthermore, any history of herpes zoster or any signs of immunodeficiency, any known recent exposure to chickenpox (we report three participants with earlier exposure to chickenpox with time since exposure being 3 y 4 mo, 4 y 6 mo, and 7 y), or herpes zoster were considered as exclusion criteria.
In our study we also examined a second small (n = 8) group consisting of healthy young age- and gender-matched individuals. This group was sampled and analyzed at a different time point than the HYCG. Although the antibody response was identical with the HYCG, this group showed overall much higher IFN-γ responses compared to all datasets (both exposed [factor 3 to 12], and control groups [factor 4 for HYCG and factor 9 for HOCG]). Although we could not identify any technical reasons for this great difference, we excluded this group from further analysis.
Isolation and preservation of peripheral blood mononuclear cells
Within 24 h after peripheral blood collection, peripheral blood mononuclear cells (PBMC) were isolated by Ficoll-Paque Plus gradient separation (Amersham Biosciences, Uppsala, Sweden). All PBMC were frozen in 90% fetal bovine serum (Perbio Science, Erembodegem, Belgium), supplemented with 10% dimethyl sulfoxide (Sigma-Aldrich, Steinheim, Germany), and stored at -80°C or -196°C (for long-term storage). All samples were thawed and analyzed at approximately 18 mo (datasets A and B), 12 mo (dataset C), 6 mo (dataset D), and 1 mo (datasets HYCG and HOCG), follow-up. According to the recommendations for ELISPOT published by Janetzki et al. (9), an overnight rest of the thawed PBMC was performed prior to measurement of viability and plating.
Flow cytometry
After thawing of the PBMC, cell viability was determined using annexin V (FITC-conjugated; BD Biosciences, Erembodegem, Belgium), and 7-AAD (BD Biosciences), or propidium iodide (PI; Sigma-Aldrich). Flow cytometry was performed on a FACScan device (BD Biosciences). About 1 × 10⁴ events per target population were measured and analyzed using CellQuest software (BD Biosciences), or FlowJo software version 7.2 (Tree Star Inc., Ashland, OR).
Detection of IFN-γ-secreting cells and IL-5-secreting cells by ELISPOT
Thawed PBMC (2.5 × 10⁵ viable cells per well) were stimulated in triplicate for 18 h with varicella-zoster cell lysate (10 μL/mL; Microbix Biosystems, Missisauga, Ontario, Canada) in 96-well ELISPOT plates coated with IFN-γ or IL-5 capture antibody (Millipore, Cork, Ireland). Positive controls consisted of PBMC stimulated with phytohemagglutinin (PHA; Sigma-Aldrich), and ionomycin (Sigma-Aldrich), and negative controls were medium supplemented with BSA (Fig. 1). ELISPOT assays were performed according to the manufacturer's instructions (Diaclone, Besançon, France). Spot-forming cells (SFC; Fig. 1) were automatically counted by the AID ELISPOT Reader System (AID Autoimmun Diagnostika, Straßberg, Germany), and analyzed using AID ELISPOT Software version 4.0. All SFC counted by the ELISPOT reader were manually audited to ensure that only true spots were included. Results (with subtraction of negative controls) are expressed as the mean number of SFC per 2.5 × 10⁵ PI-negative cells.
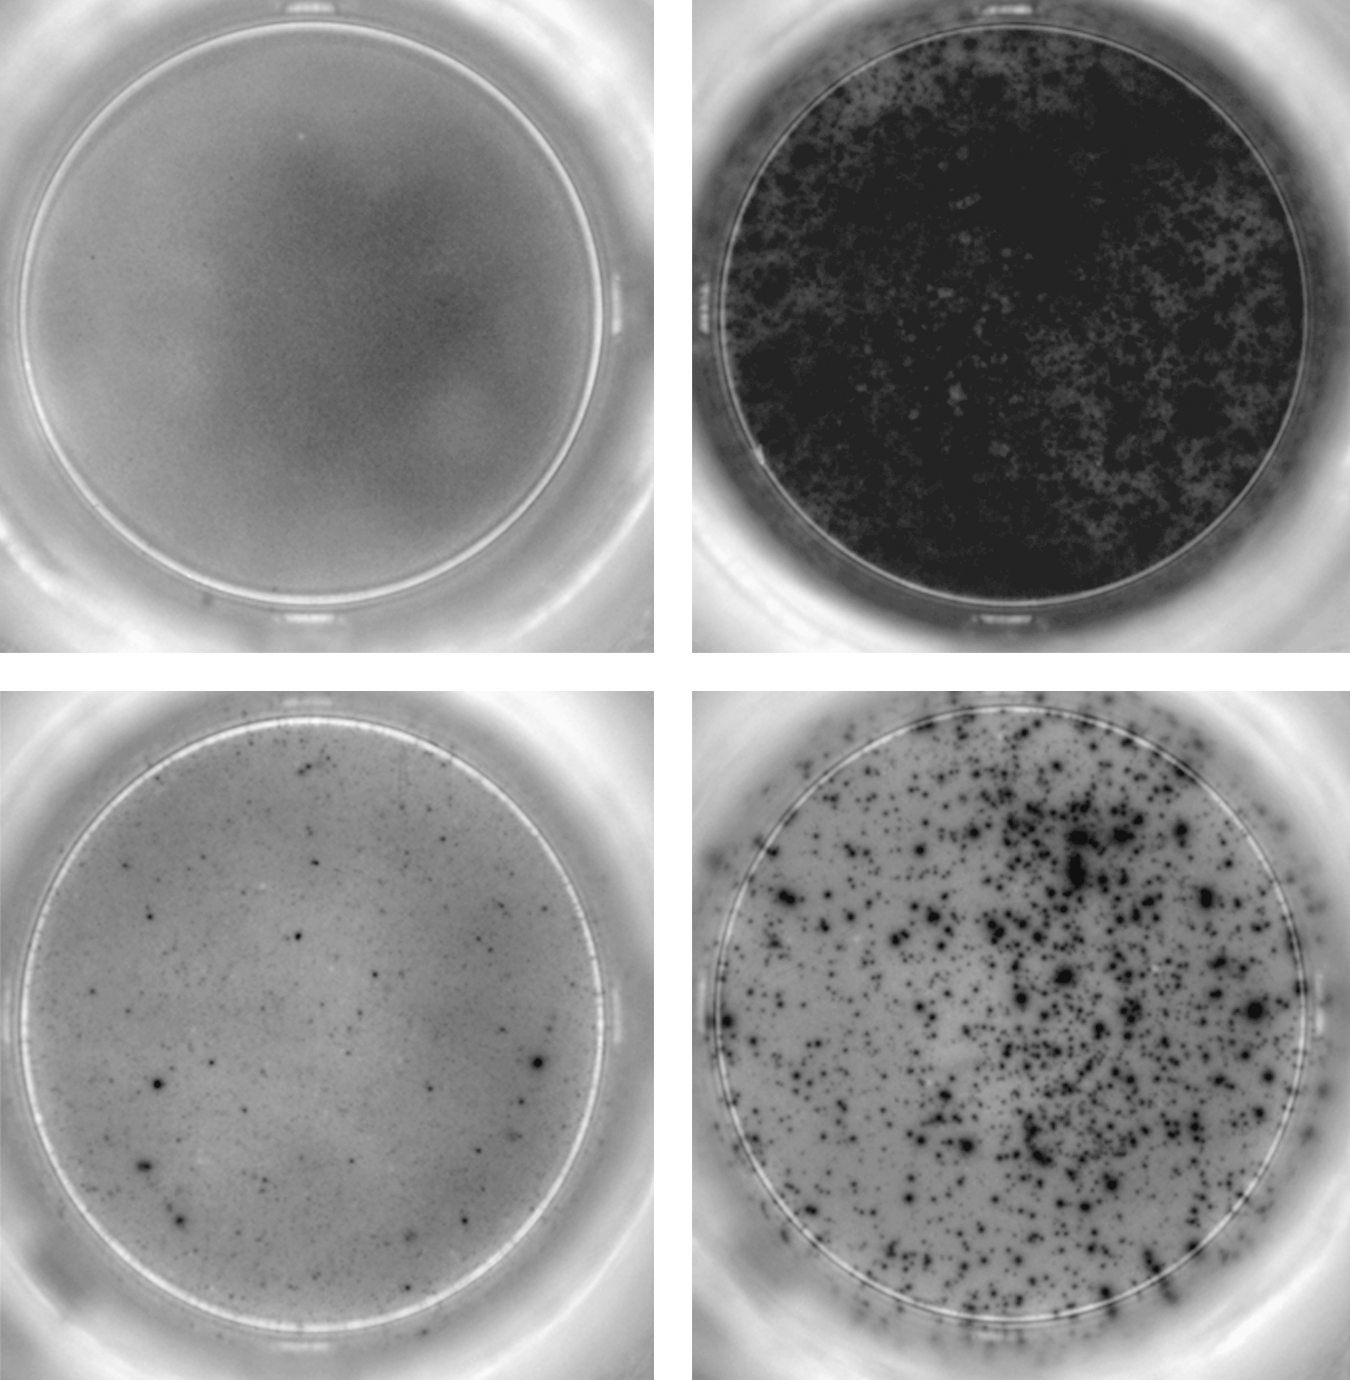
IFN-γ ELISPOT responses visualized. This figure shows representative wells of IFN-γ ELISPOT responses for the exposed group. Upper left panel, negative control (medium with BSA); upper right panel, positive control (PBMC stimulated with PHA and ionomycin); lower left panel, VZV antigen-stimulated PBMC, low response; lower right panel, VZV antigen-stimulated PBMC, high response (PBMC, peripheral blood mononuclear cell; VZV, varicella-zoster virus; IFN-γ, interferon-γ; BSA, bovine serum albumin; PHA, phytohemagglutinin).
Assessment of humoral immunity
Humoral samples were stored at −37°C. For final testing, all samples were transported at −20°C. Testing was performed with the LIAISON device (Diasorin, Stillwater, MN) for VZV IgG and IgM. The results were expressed in mIU/mL. One result exceeding 4000 mIU/mL (the cut-off) was set to 4000 mIU/mL.
Statistical analysis
Descriptive statistics (paired and unpaired t-tests, without explicit corrections for multiple testing) were applied to the primary immunological dataset (results are shown ± 1 SD unless stated otherwise). Normality of data was assessed by means of the Shapiro-Wilk test statistic. Logarithmic transformation was performed to obtain normally-distributed variables. Results were deemed significant when p < 0.05.
The linear mixed models (16) methodology was applied to analyze the longitudinal variation of the samples of the exposed group. Briefly, a general dependent outcome variable Y is modeled as a function of independent predicting variables called factors (F) when discrete, and covariates (C) when continuous. In this formulation Y = f (F,C) + ɛ, where f denotes a pre-specified linear predictor term, and ɛ a normally distributed error term (
Results
Cellular immunity
The viabilities of the different datasets after thawing were 60 ± 15% (dataset A), 67 ± 12% (dataset B), 78 ± 12% (dataset C), 77 ± 9% (dataset D), 85 ± 7% (HYCG), and 82 ± 5% (HOCG).
IFN-γ ELISPOT
The individual results of the IFN-γ ELISPOT assay for the different datasets are shown in Table 1. A graphical representation is shown in Fig. 2.
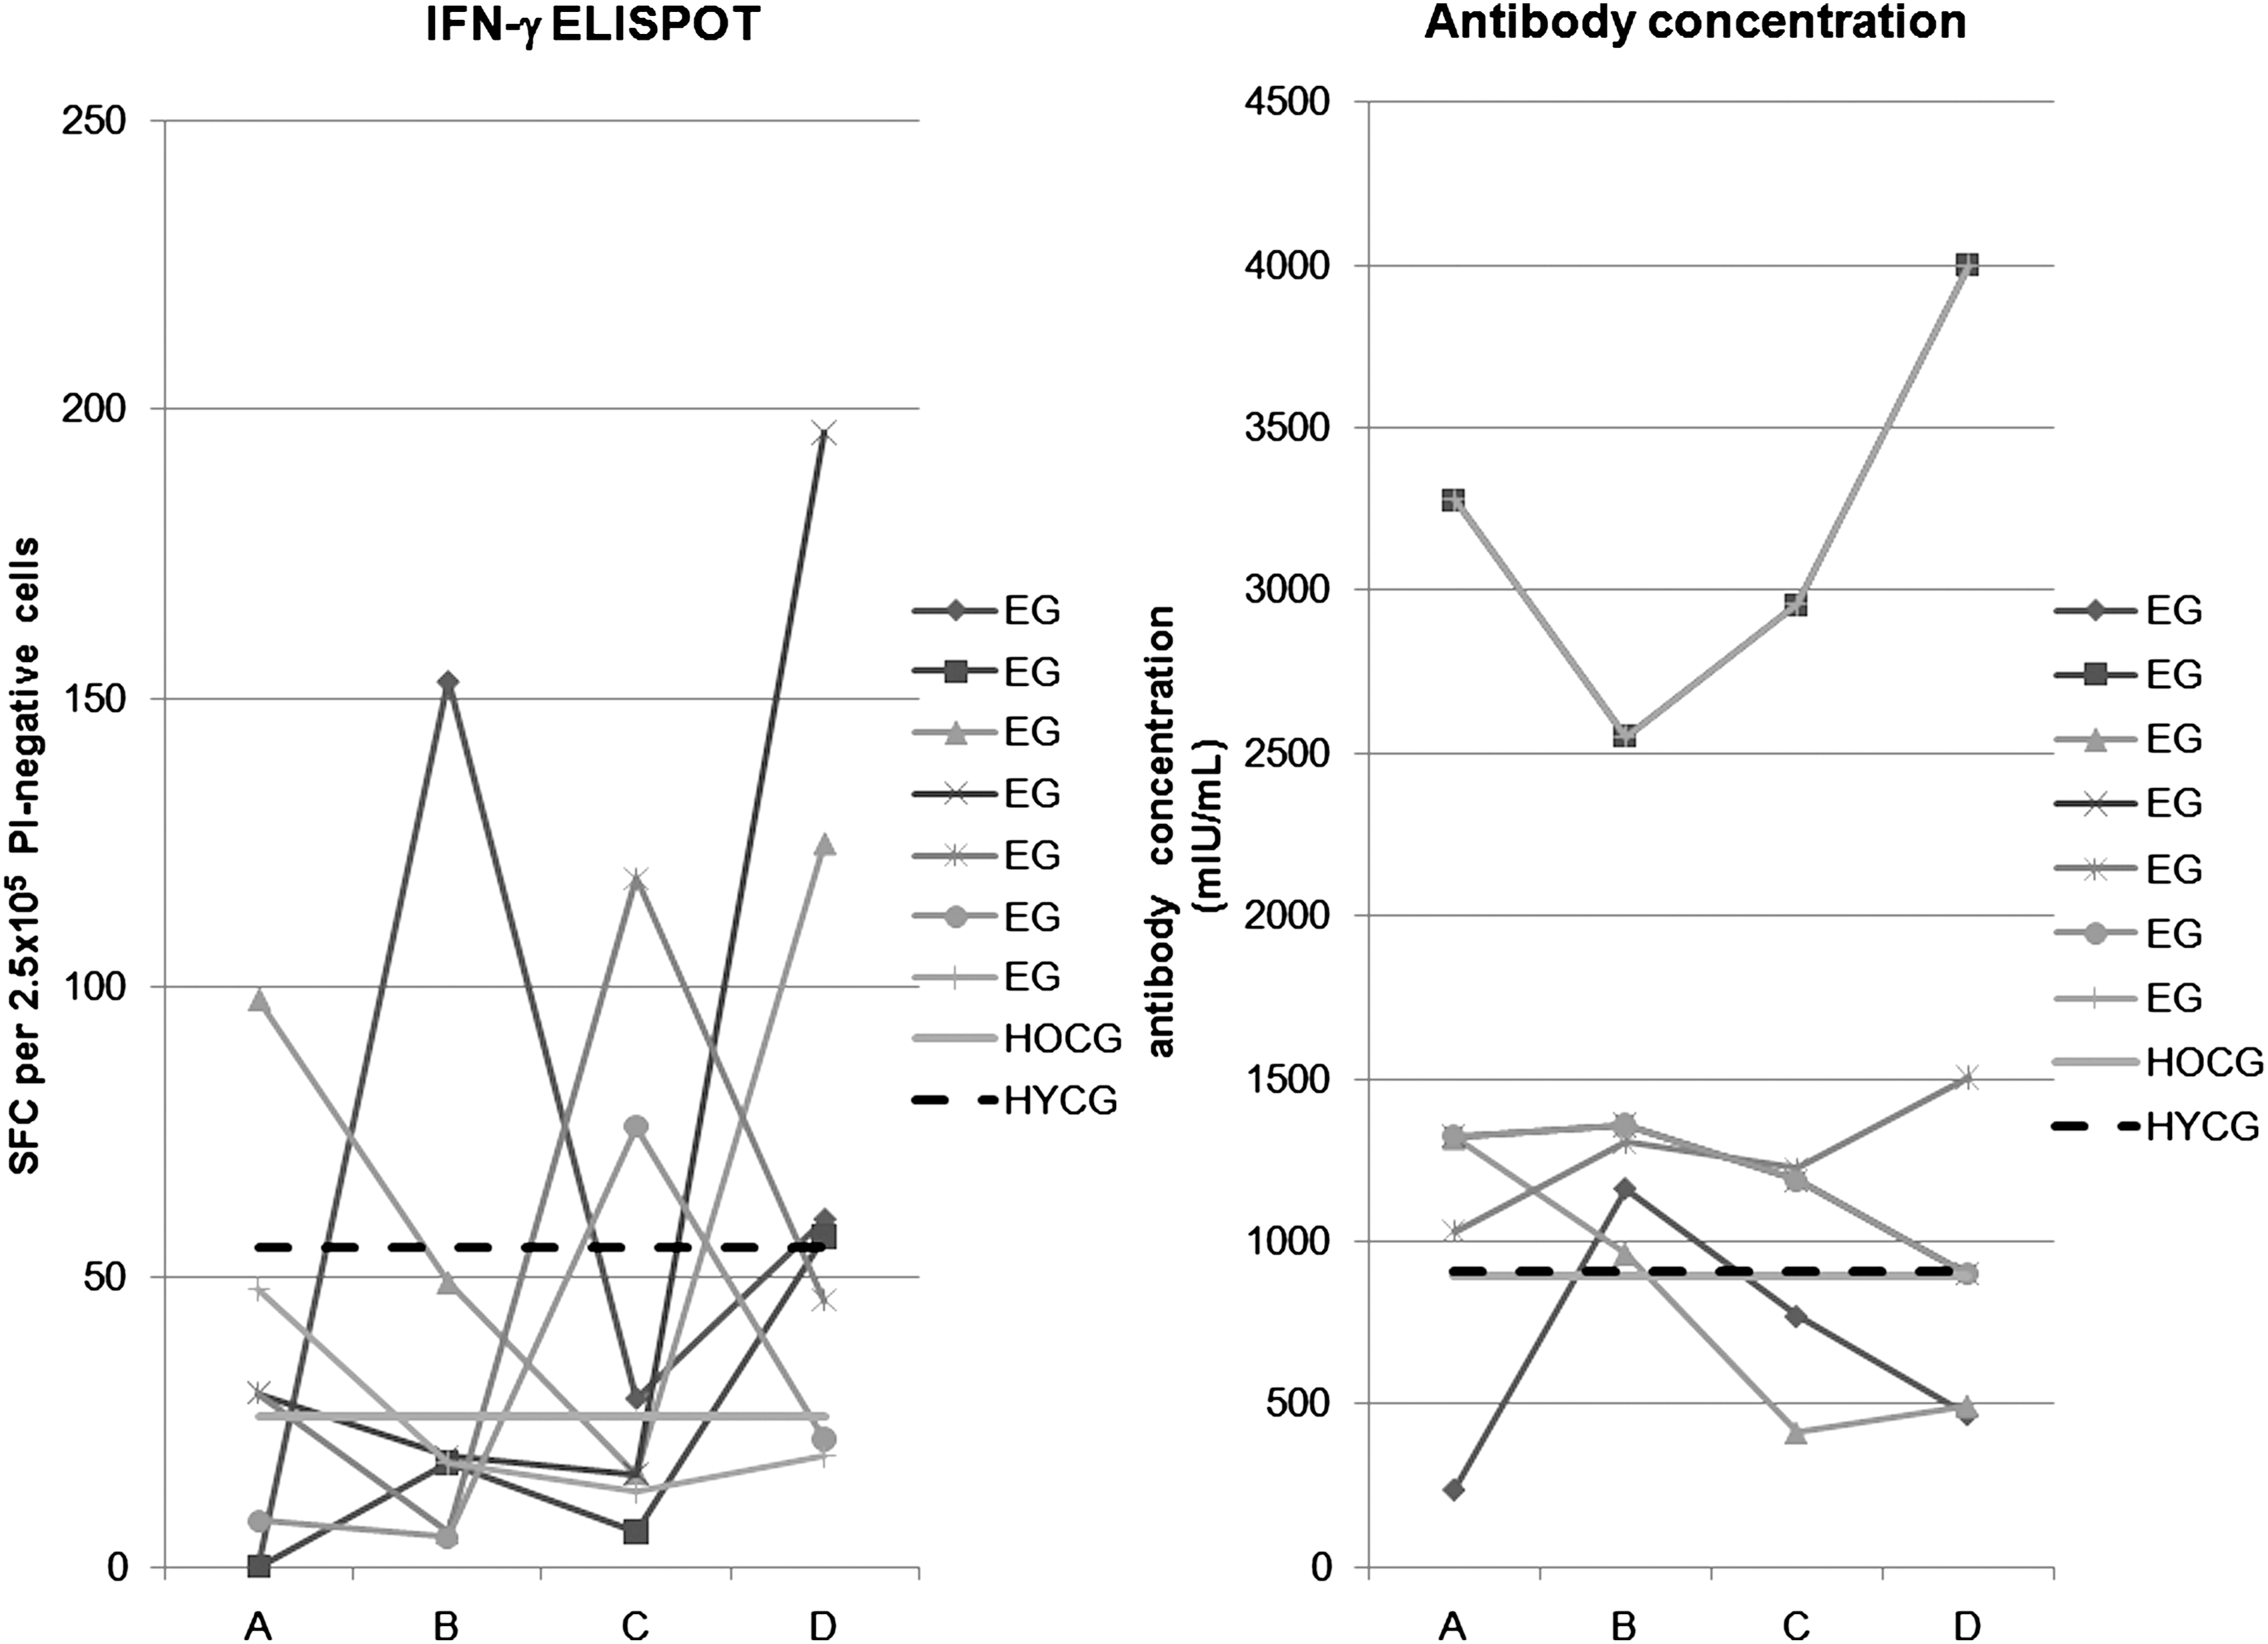
IFN-γ ELISPOT and antibody concentration results for the different datasets. As a concise way of presenting the most representative results, here we show the longitudinal results for all subjects in the exposed group (EG) having a minimum, a maximum, or a median result for time points A and B. We also show the median results of the control groups by means of straight lines. The left panel shows the IFN-γ ELISPOT responses, whereas the right panel shows the antibody concentrations (SFC, spot-forming cell; HOCG, healthy old control group; HYCG, healthy young control group; A, B, C, D, different time points for the EG, with on average 5 d after clinical exposure to primary varicella for A, 34 d for B, 213 d for C, and 372 d for D).
This table shows the individual results per dataset for both the IFN-γ ELISPOT assay (expressed as SFC per 2.5 × 10⁵ PI-negative cells), the antibody concentration, and the geometric mean response (GMR) antibody concentration (expressed as mIU/mL).
SFC, spot-forming cell; SE, standard error; /, missing data; HOCG, healthy old control group; HYCG, healthy young control group; EG, exposed group; A, B, C, D, different time points for the exposed group with on average 5 d after clinical exposure to primary varicella for A, 34 d for B, 213 d for C, and 372 d for D.
The HYCG showed a significantly higher IFN-γ ELISPOT response than the old control group, and than the exposed group at time point B (Table 2).
p < 0.10; **p < 0.05; ***p < 0.01.
This table shows the results of the t-tests (paired t-tests for the different time points of the exposed group) between the different series for the logarithm of the ELISPOT response (Ln E), and the logarithm of the antibody concentration (Ln AB). Mean differences are stated as “column variable – row variable.”
HOCG, healthy old control group; HYCG, healthy young control group; EG, exposed group; A, B, C, D, different time points for the exposed group with on average 5 d after clinical exposure to primary varicella for A, 34 d for B, 213 d for C, and 372 d for D.
The exposed group had a significantly higher response at time point A than at time point B (p < 0.01), whereas the IFN-γ ELISPOT response at time point C tended to be higher than at time point B (p < 0.10), but lower than at time point D (p < 0.10). Furthermore, the response at time point D was significantly higher than the response at time point B (p < 0.01).
In addition to comparing the different groups, we applied linear mixed models (16) to quantify the longitudinal profile of the exposed group. We examined the following structure: ln E = f (A,G,t), where ln E denotes the log-normal ELISPOT response. A and G represent age and gender of the subjects, respectively, and t denotes the time since re-exposure to primary varicella. Several functional forms f were chosen, such that a wide range of models could be compared. Furthermore, the time variable t was implemented both as a continuous variable and as a discrete variable. As best-fitting model, we found ln E = γi · ti , with AIC of 181.3. It is a discrete fixed-effects model with ti = A,B,C,D corresponding to the four different time points, and a scaled identity matrix as covariance structure for the repeated measurements. The term γ i had the following significant values (mean ± standard error): γA = 3.56 ± 0.22; γB = 2.86 ± 0.21; γC = 3.5 ± 0.21; γD = 4.15 ± 0.21. This analysis shows that the average IFN-γ ELISPOT response initially descended, after which there was a slow rise at 1 y of follow-up.
IL-5 ELISPOT
The IL-5 ELISPOT response was not statistically significant different from 0 for any of the datasets (data not shown).
Humoral immunity
Our results showed a tendency toward a higher antibody concentration in the exposed group than in the healthy young control group (0.047 < p < 0.133), and a significantly higher antibody concentration in comparison to the healthy old control group (0.02 < p < 0.03; Table 2). There was no difference between the young control group and the old control group (p = 0.32). We could not discern any longitudinal profile for the exposed group antibody concentrations. The lack of longitudinal time dependency also emerged through our best linear mixed model, AB = α · A. In this time-independent model AB stood for the antibody concentration, and A for the age of the subjects.
Correlation between humoral and cellular immunity
Our main expressions for the extent of humoral (Ln AB) and cellular (Ln E) immune responses showed a small but significant negative correlation for the exposed group (Pearson ρ = −0.246 with p = 0.045), and a significant positive correlation for the old control group (ρ = 0.49 with p = 0.029). However, we found no correlation for the young control group (ρ = 0.137 with p = 0.63).
Discussion
In order to gain insights into boosted immunity responses (8), we analyzed serial blood samples of parents exposed to varicella in the household, and compared these with a single sample from one young control group and one old control group.
The young control group showed significantly higher IFN-γ ELISPOT responses than the old control group. Previous studies also reported a decline in VZV-specific cellular immunity with age (4,11,12).
The HYCG had significantly higher IFN-γ ELISPOT responses than the exposed group compared with the sample point after 1 mo, and had higher IFN-γ ELISPOT responses than the old control group. The exposed group tended to show higher IFN-γ ELISPOT responses compared to the old control group, which reached statistical significance 1 y post-exposure. The best fitting linear mixed model predicted a decline in IFN-γ ELISPOT response of 50% between 1 wk and 1 mo post-exposure, followed by an increase to attain an 80% higher level at 1 y compared to the first week post-exposure. The initial decrease after 1 mo in IFN-γ ELISPOT response of the exposed group may be due to exhaustion of effector memory T cells, thereby decreasing the IFN-γ ELISPOT response. Although we did not discern a difference between CD4 and CD8 T-cell responses, we note that other researchers have found no or little evidence of VZV-specific CD8 memory responses (3,13).
Previous research using a lymphocyte transformation test found evidence of boosting between 3 d and 4 wk post-exposure in 70% of subjects (2). Based on intracellular cytokine staining, Vossen et al. (17) postulated the existence of boosting after re-exposure for 11/16 individuals in comparison to an unspecified control group. However, the cellular response in this control group is significantly lower than the response found by Asanuma et al. (3).
Since there appears to be natural variation in VZV-specific IFN-γ ELISPOT responses (10,13), we hypothesize that a single sample might not suffice for comparisons with controls. In this context, we believe that future research could include time-independent control antigens as a reference value to follow natural variations in cellular immune responses over time. Hayward et al. (7) recorded an increase in VZV-specific cellular immunity in individuals with herpes zoster only if they were older than 60 y. Furthermore, vaccine-boosting studies showed an inverse relationship between the pre-boosting cellular immune status and the boosting magnitude (11). This supports the possibility that exposed young individuals may have a high cellular immunity that is not prone to boosting. Therefore, further studies examining post-exposure immunity of older individuals may reveal more clear-cut effects of boosting.
We found no significantly higher individual humoral responses in the exposed group of parents, despite a general tendency toward higher antibody concentrations versus all control groups. This could imply the existence of a rapid and persistent antibody level response over time. The absence of an overall longitudinal profile is in accordance with previous research (2,17), as is our finding that humoral immunity did not differ significantly between all control groups (12).
For the exposed as well as for the old control group, we found a significant correlation between antibody concentration and IFN-γ ELISPOT response. This result is in contrast with previous research using the lymphocyte proliferation assay (4).
In conclusion, we observed a significant increase in cellular immunity of VZV-immune adults at 1 y compared to 1 wk after re-exposure to primary varicella. Furthermore, compared to both young and old control groups with no known recent VZV exposure, the results showed a tendency toward higher humoral immunity in the exposed group.
Footnotes
Acknowledgments
We would like to thank all of the participants for their blood donations. Furthermore, we would like to thank Drs. E. Van Aken and K. Verhulst for their help in recruiting participants and collecting blood samples. We also thank the anonymous referees for their constructive comments. This study was done as part of SIMID, a strategic basic research project funded by the institute for the Promotion of Innovation by Science and Technology in Flanders (IWT), project no. 060081. Further funding was received from the special fund for research of the University of Antwerp (grant no. 5/2145).
This work was presented at the 27th annual meeting of the European Society for Paediatric Infectious Diseases in Brussels, Belgium (June 9–13, 2009, abstract P712), and was selected for a poster walk.
Author Disclosure Statement
No competing financial interests exist.