
Abstract
Avian influenza is a highly contagious disease, and different subtypes of avian influenza virus (AIV) have different levels of pathogenicity. A microsphere-based fluorescent assay was initially established for subtyping AIV. DNA fragments were amplified with biotinylated primers. AIV subtype-specific DNA probes with an amino-linker at the 5′ end were covalently bound with carboxy-modified encoded beads. The modified beads and the denatured DNA fragments were mixed together for hybridization. Then, quantum dots-streptavidin (QDs-streptavidin) was added to conjugated biotinylated PCR products. The reaction products were screened by flow cytometry. AIV strains (such as H5N1 and H9N2) could be determined and subtyped according to their combination of encoded beads and fluorescent QDs. The method's combined sensitivity of the nucleic acids of H5N1 and H9N2 avian influenza virus at a threshold of 74 pg and 1 pg could be detected. This is a powerful method for detecting many pathogens or many types of a pathogen simultaneously.
Introduction
In the present work, we used DNA probes that were modified at the 5′ end during synthesis with an amino-linker. Encoded carboxyl-modified microspheres have shown the ability to couple to various biomolecules (e.g., terminal-NH2 modified oligo DNAs) (2). We used direct hybridization of a labeled PCR-amplified target DNA to microsphere sets bearing oligonucleotide capture probes specific for each sequence. Quantum dots-streptavidin (QDs-streptavidin) was added to the solution and the encoded carboxyl-modified microspheres were then used to detect the target sequence in solution with flow cytometric technology.
The process described here is designed specifically for aqueous systems, and is biocompatible with the natural structure of DNA. To illustrate the feasibility of this novel application, the H5N1 and H9N2 subtypes of AIV were selected as practical analytes. The microsphere-based fluorescence assay by flow cytometry offers sensitivity that is higher than traditional assays, such as gel electrophoresis. In addition, because of the small amount of assay reagents that are required, the microsphere-based fluorescence assay technique is inexpensive.
Materials and Methods
RNA extraction
Viral RNA was extracted from allantoic fluid samples by combining 100 μL of infectious allantoic fluid with 900 μL of Trizol reagent (Molecular Research Center, Inc., Cincinnati, OH) and mixed by vortexing. Trizol reagent was used for viral RNA extraction according to the manufacturer's instructions.
Coupling of the oligonucleotide probes to the carboxy-modified microspheres
Each of the 5′ amine-labeled nucleotide probes (Invitrogen Biotechnology Co. Ltd., Shanghai, China) was designed for the amplification regions of the RT-PCR amplicon sequences, and contained a 10-dTTP spacer at the 5′ end. The probe sequences are listed in Table 1. Microspheres (5.6 μm in diameter) with surface carboxyl groups were used as solid carriers. The encoded microspheres were internally dyed with a red and orange fluorophore. The probe was coupled to carboxylated microspheres using a modification of the carbodiimide coupling method (7). The coupled microspheres were stored in TE buffer (pH 8.0) in the dark at 4°C.
RT-PCR protocol
Target RNA (H5 or H9) was RT-PCR amplified using PCR amplification primers that were biotinylated. The primers and probes used for the PCRs are listed in Table 1. All primers were synthesized by Invitrogen Biotechnology. RT-PCR amplification was carried out in a reaction mixture (50 μL) containing 25 μL 2× Access Quick Master Mix, 1 μL oligo (dT), 1 μL reverse transcriptase, primers H5-200B F, H5-200B R, H9-219B F, and H9-219B R (400 nmol/L each), 5 μL RNA template, and DEPC H2O to make 50 μL. Ultra-pure sterilized water was used in place of RNA as a negative control. The cycling conditions were 1 cycle at 95°C for 3 min, 30 cycles at 95°C for 30 sec, 60°C for 30 sec, and 72°C for 45 sec, with a final extension of 5 min at 72°C. RT-PCR products were verified using 0.1% agarose electrophoresis.
Hybridization of the arrays
Each hybridization reaction was performed in a mixture containing 1 μL PCR product, and 1 μL TE buffer containing 5000 microspheres of each conjugate, made up to a final volume of 50 μL with hybridization solution. The hybridization protocol was as follows: one initial denaturing step of 10 min at 95°C; an incubation step for 3 h at room temperature in the dark; separation of microspheres by centrifugation, after which the pellet was washed twice with washing buffer; a final incubation step for 1 h at room temperature with 50 μL of 5 μg/mL QDs-streptavidin (Invitrogen Biotechnology). Each tube corresponds to one test sample. The product of the RT-PCR negative control was used as the hybridization negative control.
Flow cytometric analysis
A Coulter EPICS ALTRA HyPerSort™ system (Beckman Coulter, Inc., Fullerton, CA) equipped with an air-cooled argon ion laser (488 nm) and a HeNe ion laser (633 nm) was used in this study. The 633-nm red diode laser excited the fluorochrome held within the microsphere, and the 488-nm laser excited fluorescent molecules bound to the microsphere surface. The microspheres and QDs were measured on PMT5 (675 nm) and PMT4 (605 nm) detectors, respectively. The fluorescence of thousands of microspheres was analyzed with EXPO™ 32 MultiCOMP software (Beckmann Coulter). A protocol for subtyping dual-sign was designed, and the fluorescent light intensities of individual microspheres were measured and adhesion ratios were calculated. To determine the adhesion ratio, a region of interest (ROI) was drawn around the microspheres, and the adhesion ratio within the ROI was measured.
Results
All primers were tested by amplifying the two subtypes (H5N1 and H9N2) to ensure that the extracted RNA produced RT-PCR products of the expected size (Fig. 1).
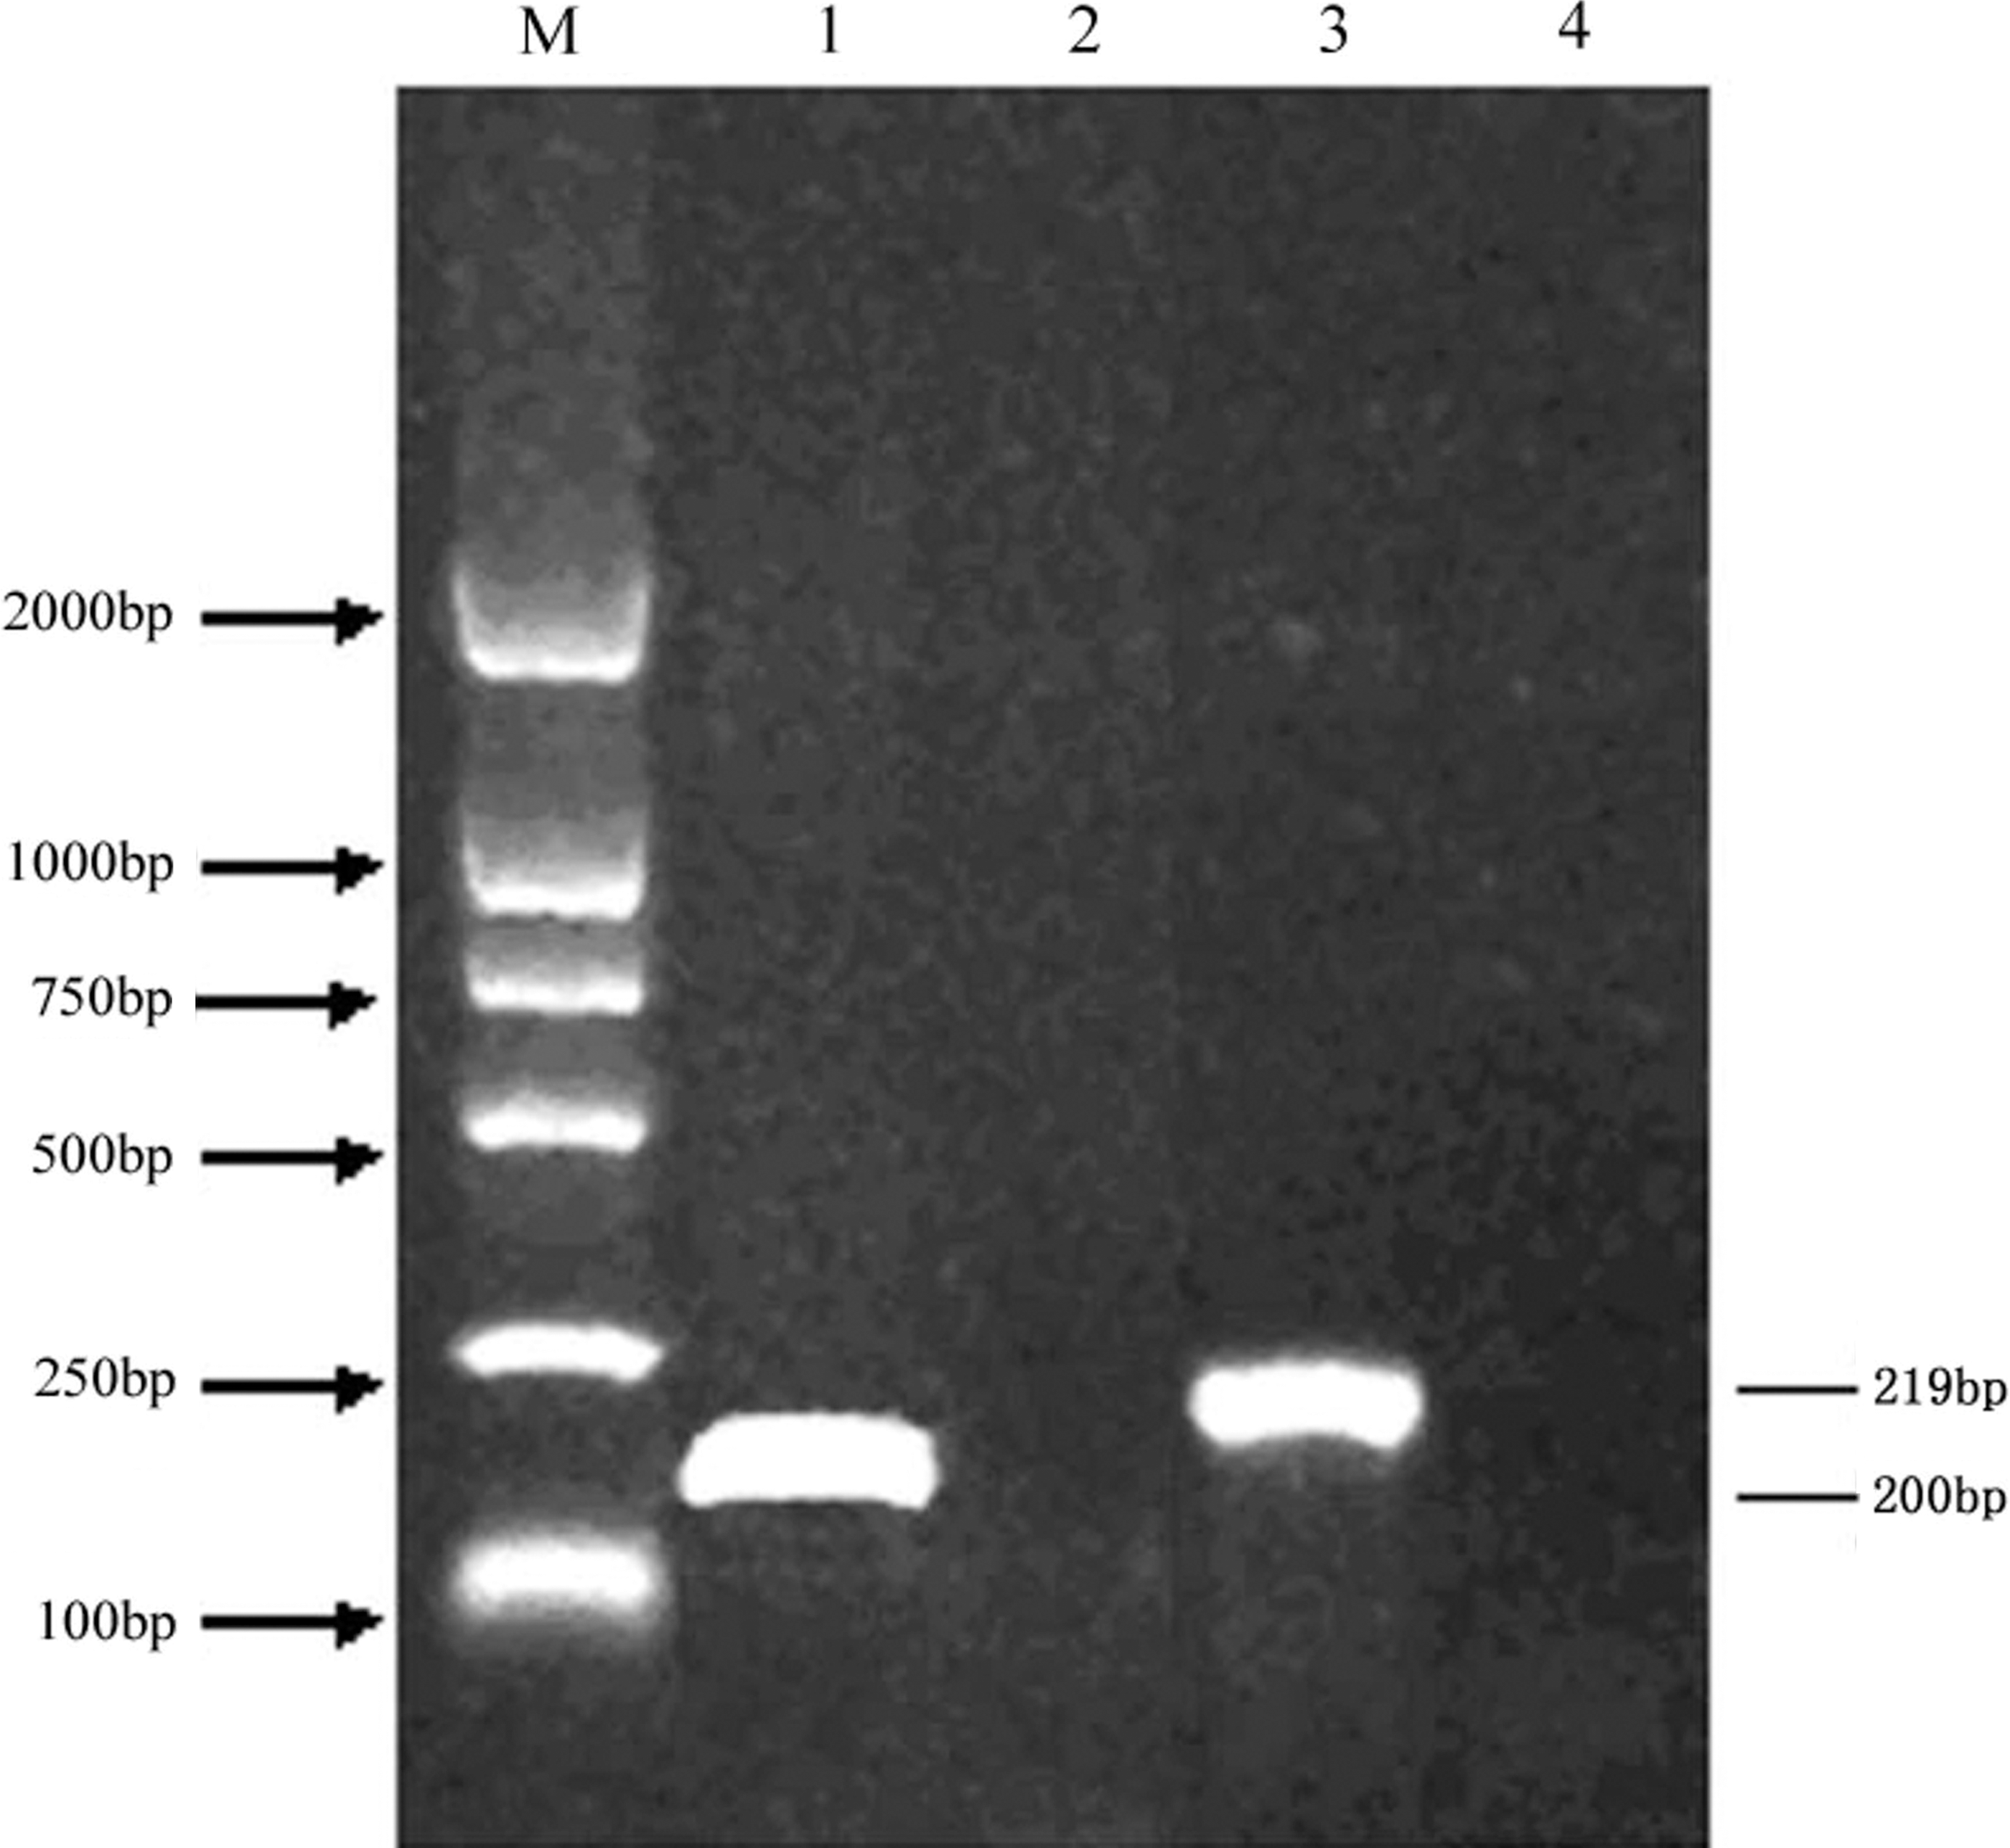
Gel electrophoresis (1% agarose gel) of the amplification products by RT-PCR lane 1, H5; lane 2, the H5 negative control; lane 3, H9; lane 4, the H9 negative control; M, the DL2000 DNA marker.
The encoded microspheres were able to capture the different AIV nucleotide probes, H5N1 and H9N2. The encoded microspheres and the PCR products were hybridized for 3 h, and then incubated with QDs-streptavidin for 1 h. Microsphere no. 20 captured the H5N1 probe, and microsphere no. 55 captured the H9N2 probe. In the absence of AIV, flow cytometry displayed high adhesion ratio signals for the functionalized fluorescent microspheres bound to QDs-streptavidin.
A ROI was drawn around the microspheres (Fig. 2a). The microspheres were measured on a PMT5 (675 nm) detector. Microspheres no. 20 and no. 55 are seen as two separate peaks (B and F) in PMT5 (Fig. 2b). The QDs-streptavidin signals were observed using a PMT4 (605 nm) detector. The results for the blank sample show that, as expected, the adhesion ratio within the ROI is very low (Fig. 2c). The QDs signals for microspheres no. 20 (captured H5N1) and no. 55 (captured H9N2) show high adhesion ratios (Fig. 2d and e), indicating that H5N1 and H9N2 were captured in the respective samples. The simultaneous detection of QDs signals for microspheres no. 20 (captured H5N1) and no. 55 (captured H9N2) gives high adhesion ratios (Fig. 2f), confirming the presence of H5N1 and H9N2 in the sample.
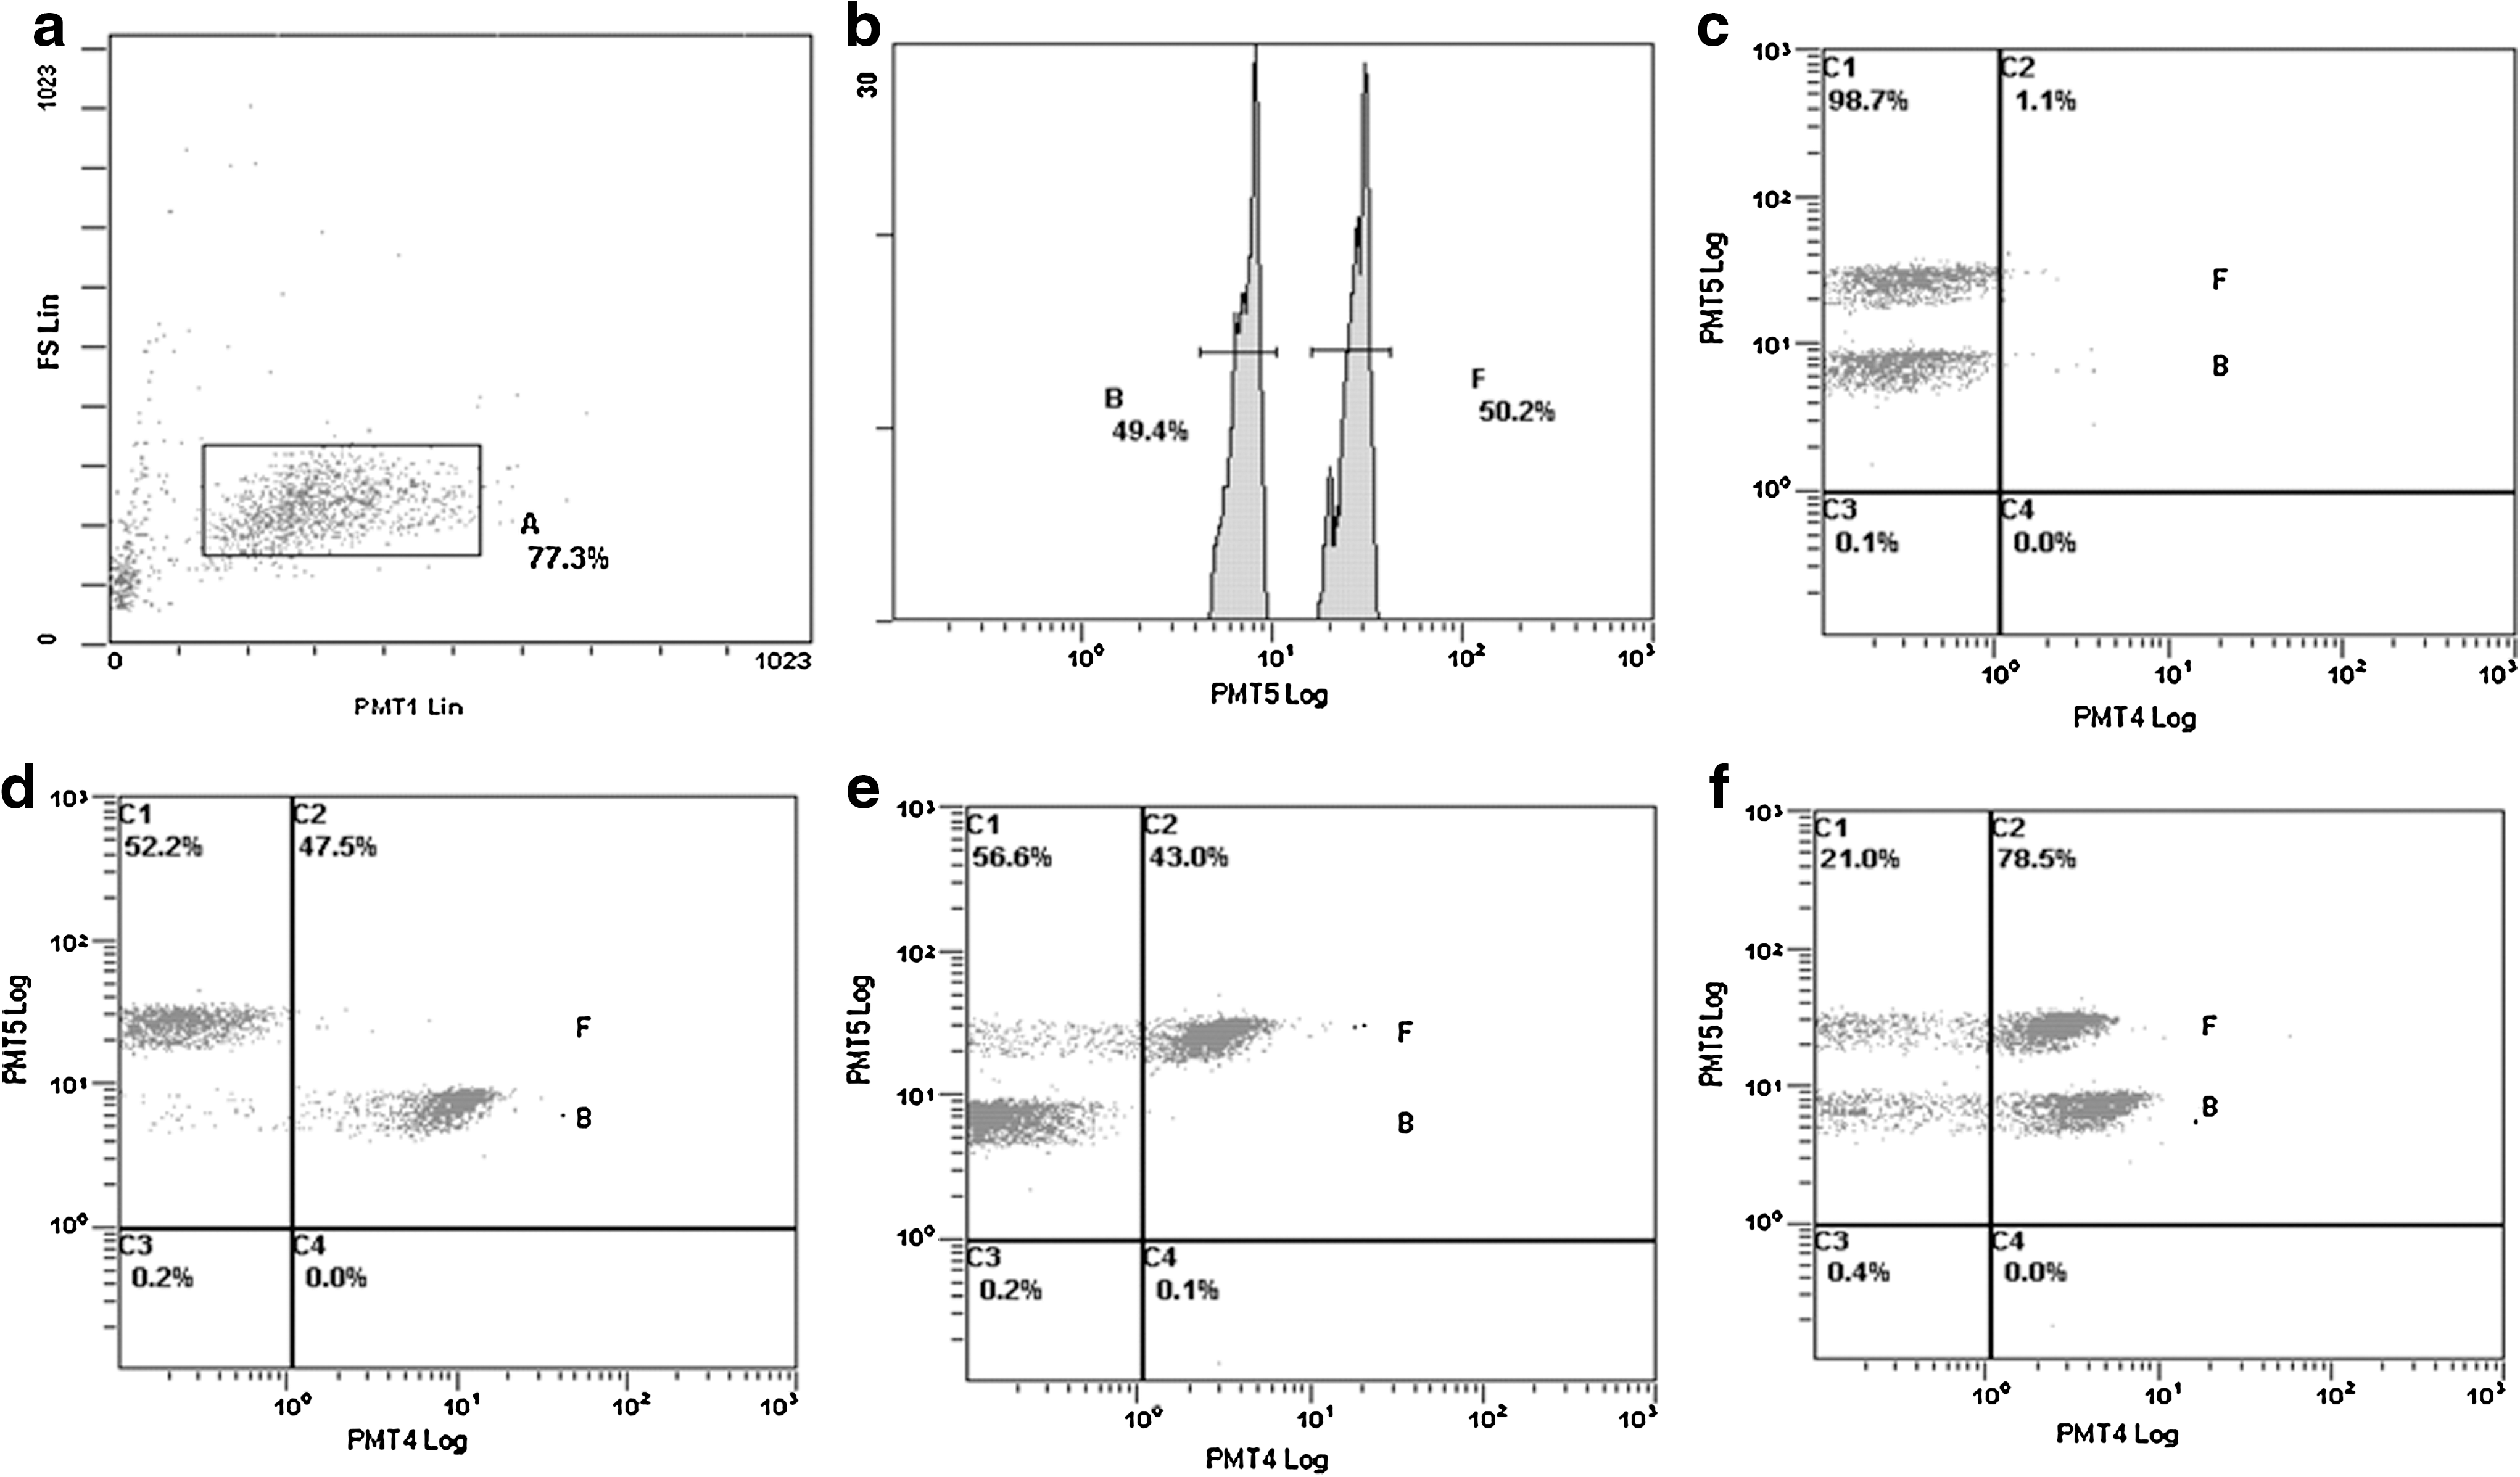
Flow cytometric analysis (B, microsphere no. 20 with captured H5N1; F, microsphere no. 55 with captured H9N2). (
The adhesion ratios for the simultaneous detection of H5N1 and H9N2 were analyzed separately (Fig. 3). As mentioned above, Fig. 2f shows the total adhesion ratio. The adhesion ratios of the QDs on microspheres no. 20 (captured H5N1) and no. 55 (captured H9N2) are displayed in Fig. 3. The blank values for the QDs on microspheres no. 20 (captured H5N1) and no. 55 (captured H9N2) were 1.5% and 0.8%, respectively. A positive result was assumed when the adhesion ratio of the sample was at least 2.1 times higher than the blank value (i.e., when P/N=2.1). Therefore, as we have shown, this method can detect a number of different viruses at a time, and may be used for subtyping AIV.
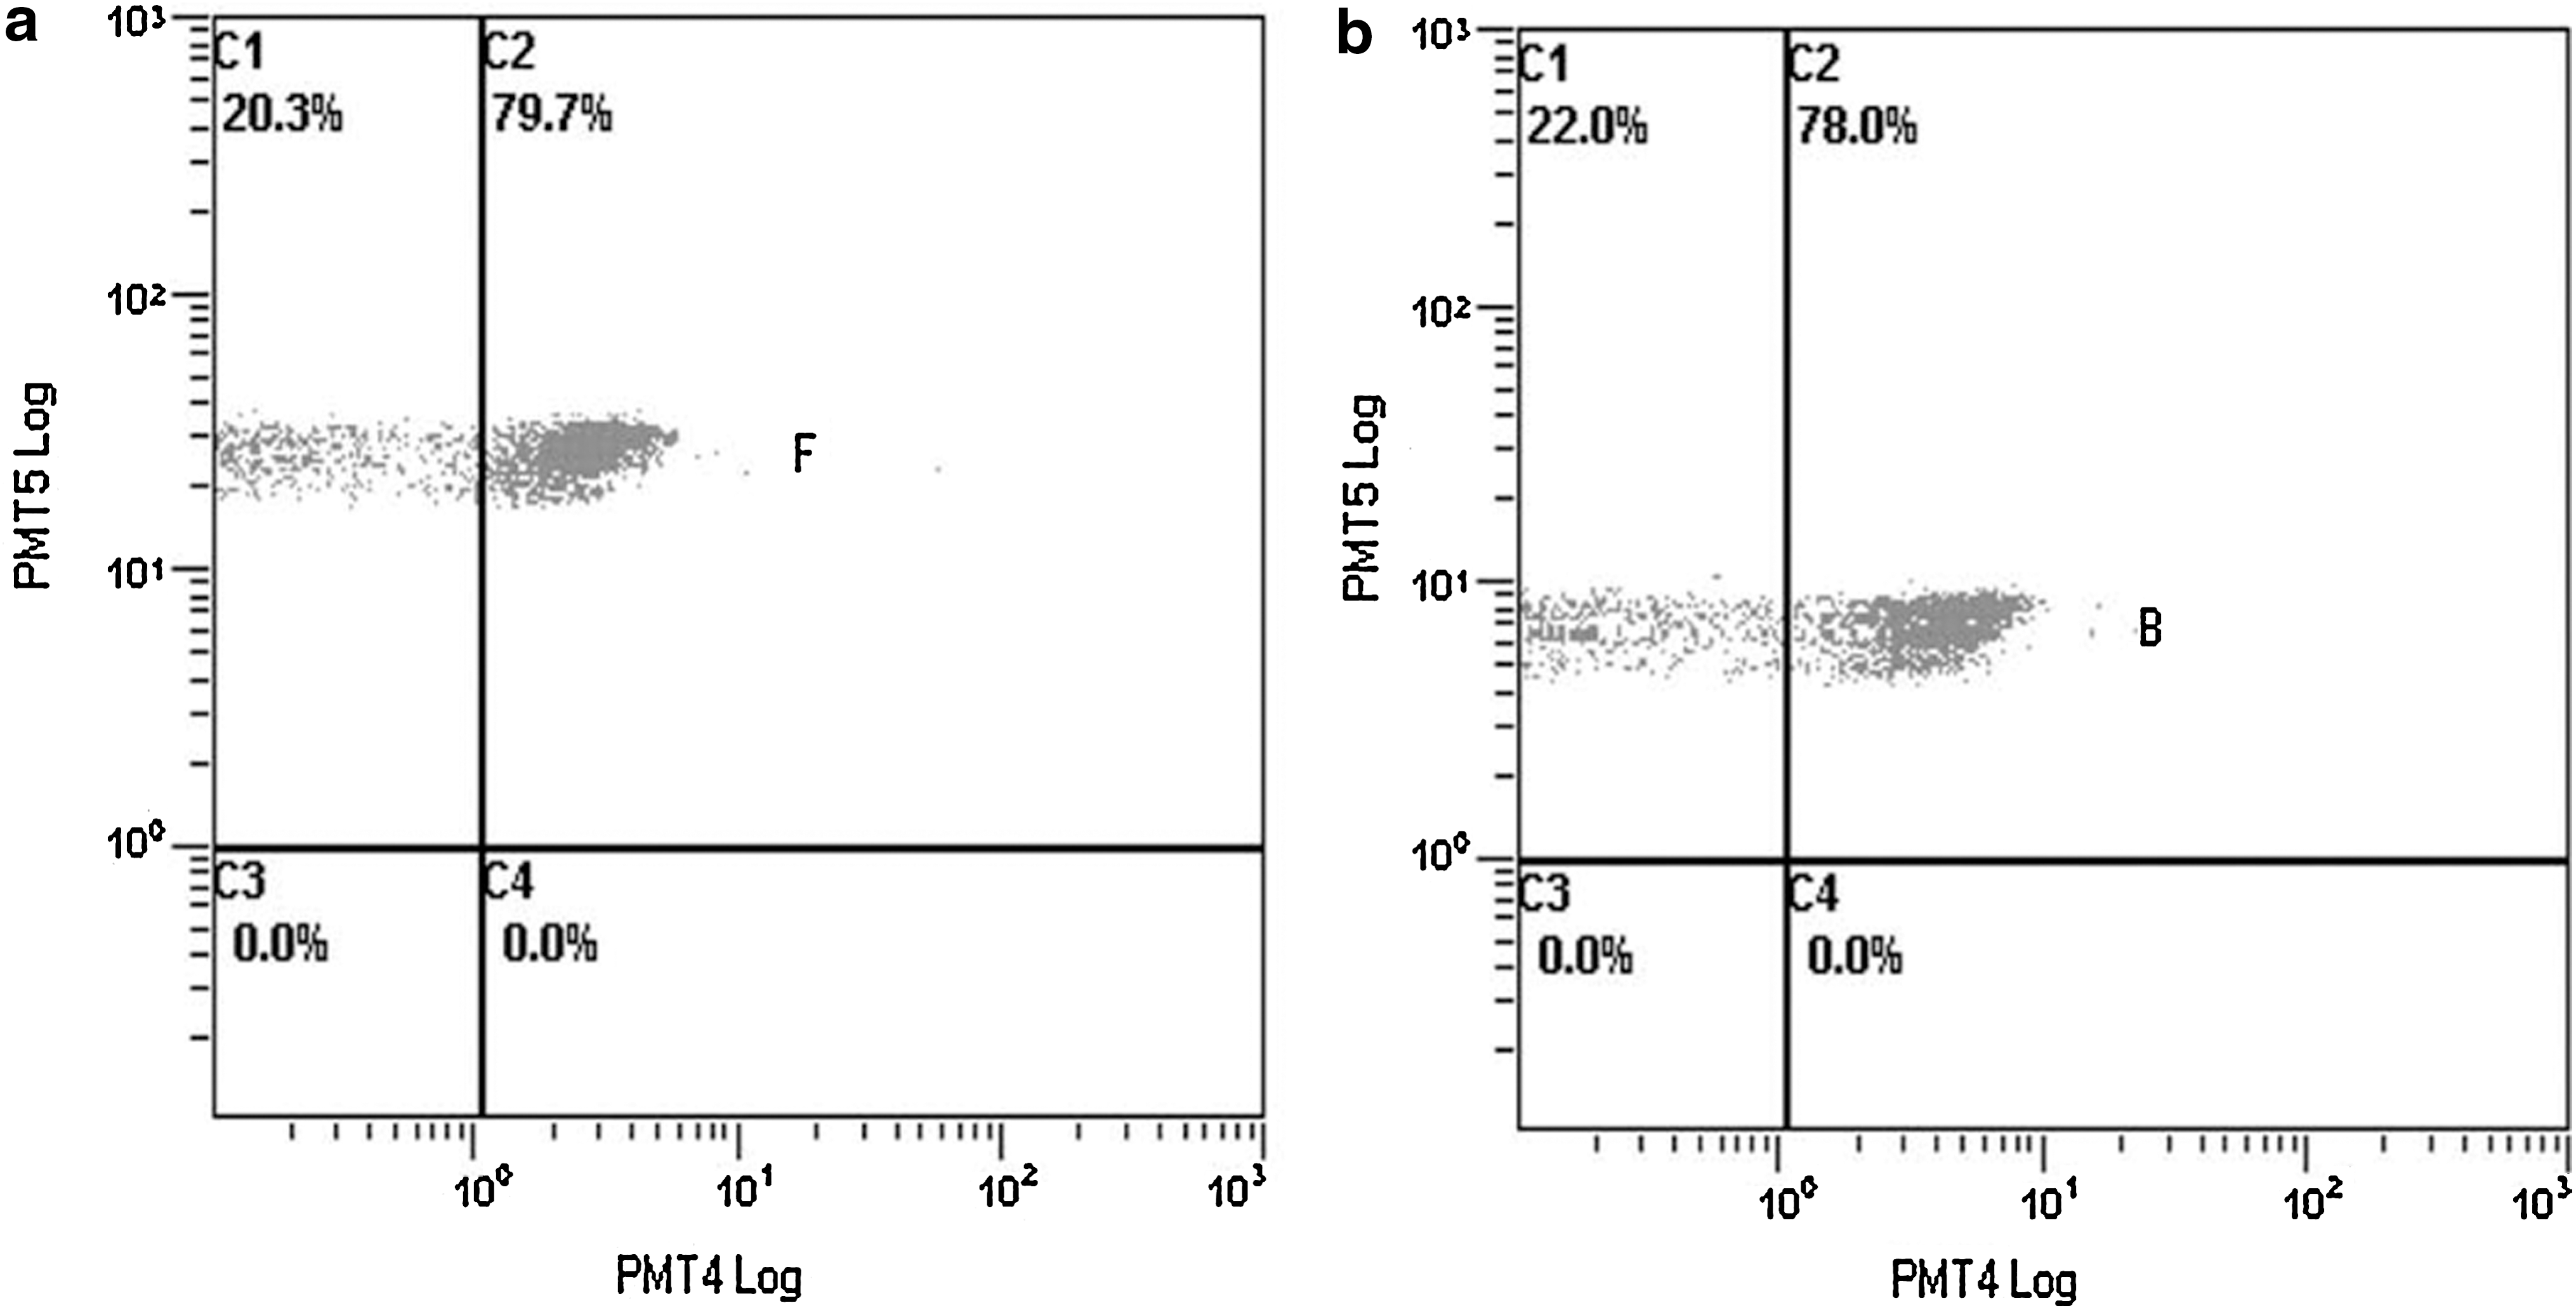
The simultaneous detection of H5N1 and H9N2 using flow cytometric analysis. (B) Microsphere no. 20 with captured H5N1. (F) Microsphere no. 55 with captured H9N2. (
When compared to gel electrophoresis, the microsphere-based fluorescence assay by flow cytometry offers higher sensitivity (Table 2). The detection limits of H5N1 and H9N2 were 74 pg and 1 pg, respectively. The sensitivity of this method is 10 times higher than electrophoresis. It also has the advantage of being able to simultaneously detect diverse subtypes of avian influenza virus.
Discussion
We have devised and optimized an assay for subtyping AIV and used H5N1 and H9N2 subtypes as practical analytes. The most significant advantage of the microsphere-based flow cytometric assay is its potential to carry out multi-virus analysis. The microspheres were filled with special red and infrared-emitting fluorochromes. By adjusting the concentrations of each fluorochrome, optically-encoded microsphere sets were obtained (3,10,14). Each analyte was individually coded for by a specific set of microspheres. As the level of multiplexing increases, the throughput correspondingly increases (1). Therefore, optically-encoded arrays of microspheres can be considered as a more flexible and higher-throughput alternative to the more commonly used flat surface arrays or chips. QDs, new fluorochromes, are conserved longer and are more stable than FITC in light. This feature of QDs allows one to label different target molecules with different colored QDs. The various combinations of optically-encoded microspheres and different colored QDs offer us the tools required to test for hundreds of different entities (e.g., viruses, residues, and pathogens) simultaneously. We have shown that the simultaneous high-throughput detection of two virus subtypes using this microsphere-based fluorescence assay is currently possible.
In conclusion, for the first time, we used a microsphere-based fluorescence assay in an aqueous system to detect virus subtypes (H5N1 and H9N2 were used as a representative sample). We have shown that the sensitivity of measurement of the microsphere-based fluorescence assay is superior to conventional gel electrophoresis. Furthermore, the microsphere-based fluorescence assay offers the advantage of multiplexed analysis. After the multiple fluorescent microspheres are conjugated to the different tested viruses, the solid phase constitution for detecting viruses can be determined using multiplexed assays and small samples. This novel method may be exploited for the rapid determination of the immune responses to AIV in a variety of complex systems
Footnotes
Acknowledgments
This work was financially supported by the National Natural Science Foundation of China (NSFC; no. 20775076 and 20875084), and The International Science and Technology Cooperation and Exchange Foundation (no. 2009DFA32720).
Author Disclosure Statement
No competing financial interests exist.