
Abstract
The rules of T cell positioning within virus-infected respiratory tract tissues are poorly understood. We therefore marked cervical lymph node or spleen cells from Sendai virus (SeV) primed mice and transferred lymphocytes to animals infected with SeV expressing an enhanced green fluorescent protein (SeV-eGFP). Confocal imaging showed that when T cells entered a field of infected respiratory tract epithelium, they assumed a spatial distribution that maximized distances between each donor cell and its nearest neighbor. We therefore hypothesized that lymphocytes repelled one another by altering their chemokine/cytokine microenvironment. Subsequent in vitro tests confirmed that when SeV-primed lymphocytes were co-cultured with infected respiratory tract stroma, there was a profound upregulation of chemokines including RANTES, CXCL9, CXCL10, and CCL2. Based on these data, we propose that newly resident lymphocytes within virus-infected respiratory tract tissues may create halos of chemokines/cytokines to mark their territories; lymphocyte cross-talk may then inhibit cell overlap and redundancy to expedite virus clearance.
Introduction
T
While lymphocyte migration has been well studied, less attention has been focused on the configuration of lymphocytes upon their arrival in an infected tissue. Our study was therefore designed to examine such configurations. To monitor lymphocyte residence, we harvested cervical lymph node (CLN) or spleen cells from Sendai virus (SeV) primed mice, marked cells with dye, and transferred cells to host mice, previously or subsequently infected with SeV expressing an enhanced green fluorescent protein (SeV-eGFP) (5). Confocal imaging was then used to monitor patterns of lymphocyte residence within infected epithelial cell monolayers lining the respiratory tract. Results showed that the positioning of incoming cells was non-random; cells were well dispersed across infected fields and rarely overlapped. Additional tests suggested that lymphocytes might use chemokine/cytokine halos to mark their territories and repel other effectors in their vicinity. Via lymphocyte cross-talk, resident cells may possibly claim individual territories, reduce functional redundancies, and ensure expeditious clearance of a virus-infected field.
Materials and Methods
Animals and housing
Six–eight week old female C57BL/6 mice were purchased from Jackson Laboratories. Animals were housed in filter-top cages under specific pathogen-free conditions in a Biosafety Level 2+ containment area as specified by the Association for Assessment and Accreditation for Laboratory Animal Care (AAALAC) guidelines. All experiments were performed repeatedly.
Cell transfers and confocal microscopy using an in vivo infection model
Donor cells for transfer were from the CLN or spleens of mice that had been intranasally infected with 250 PFU SeV 10–14 days earlier. Cells were suspended and, in the case of spleen cells, red blood cells were lysed with red blood cell lysis buffer (Cat# R7757, Sigma Aldrich, Inc, MO). In some cases, cells were enriched for total T cells or CD8+ or CD4+ cell subsets. T cell enrichment was with Dynabeads FlowComp Mouse Pan T (CD90.2) kit (Cat#114.65D, Life Technologies™, Invitrogen). CD8+ T cells were enriched either with a Dynal mouse negative Isolation Kit (Cat#114.17D) or by adhering cells to plastic coated with AffiniPure goat anti-mouse IgG (H+L, Jackson ImmunoResearch Laboratories, Inc, West Grove, PA) for 1 h, and then suspending nonadherent cells in 10 mL PBS containing 1 mL of anti-CD4 (clone GK1.5) on ice for 30 min, followed by CD4+ T cell removal with sheep anti-rat IgG Dynabeads® (Cat# 110.35, Invitrogen Dynal AS, Oslo, Norway) and a Dynal MPC-L magnet. In some cases CD4+ T cells were enriched by (i) incubating in 10 mL medium with a 1:10 dilution of anti-CD8 (clone 53.6.7.2) on ice for 30 min and then with sheep anti-rat IgG DynaBeads® for 30 min at 4°C on a rotating platform, followed by removal on a magnet, and (ii) incubating with Dynabeads® Mouse Pan B (B220, Cat#114.41D, Invitrogen Dynal AS), followed by removal on a magnet. Cells were then stained with 10–50 μM Cell Tracker™ Orange CMTMR (Cat#C2927, Life Technologies™, Invitrogen) or CellTrace™ CFSE Cell Proliferation Kit (C34554, Life Technologies) in PBS for 30 min, washed with PBS, and incubated in Complete Tumor Medium (CTM, a Modified Eagles Medium (Invitrogen, Grand Island, NY) supplemented with dextrose (500 μg/mL), glutamine (2 mM), 2-mercaptoethanol (3×10⁻⁵ M), essential and nonessential amino acids, sodium pyruvate, sodium bicarbonate, and antibiotics (19,35) containing 10%FBS for 30 min at 37°C. Cells were washed and injected into the retro-orbital sinus of host animals using 1×10⁶—1×10⁷ cells/mouse in a volume of 100 μL. Host mice were infected either prior to or after donor cell injection as specified for individual experiments. Infections were with 1×10⁵ EID50 SeV-eGFP (5) or 1×10⁴ PFU SeV. Animals were sacrificed 0–3 days after cell transfer and 2–3 days after infection. Mice were sacrificed by anesthetizing with avertin and then exsanguinating by clipping the axillary artery. Upper respiratory tract (URT) tissues were harvested by removing skin, lower jaws, soft palates (including the attached o-NALT), muscles, cheek bones, and incisors from the heads (2,6). Remaining snouts were separated from the heads and fixed in 4% formaldehyde for 20 min. Snouts were then sliced along the sagittal plane and in some cases stained with DAPI at 2 μg/mL (Life Technologies™, Invitrogen). They were then placed with the exposed nasal cavity pointing downward on the cover glass bottom of a FluoroDish™ (Cat# FD35-100, World Precision Instruments, Inc, FL). Images were acquired through the 0.17 mm thick glass bottom with an inverted confocal microscope (3i Marianas™ system, Intelligent Imaging Innovations, Inc. Denver,CO) using a 10X objective. Data were analyzed using SlideBook™ Software (3i Marianas™ system, Denver,CO). Single XY planes were first examined. 20–60 sections were also merged in a Z-stack to view larger areas of the respiratory tract epithelial cell lining (3–6 microns per section along the Z axis).
Stromal/lymphoid cultures and chemokine analyses
Immediately prior to sacrifice, mice were anesthetized with avertin and exsanguinated by clipping the axillary artery. Mice were perfused with PBS retro-orbitally and also via the left ventricle of the heart. To prepare stromal cell cultures, lungs were removed and chopped into small pieces with a straight-edged blade. To release cells, samples were treated with collagenase (200 U/mL) and dispase (50 U/mL) in PBS for 30 min at 37°C with shaking, 10 mL per gram tissue. DNase was then added to a concentration of 15 U/mL for an additional 30 min incubation at 37°C with shaking. CTM with 10% heat-inactivated FCS was added and cells were passed through a 70 micron BD Falcon filter. Cells were then depleted of T and B cells per manufacturer's directions (Cat# 114.43D and 114.41D respectively, Invitrogen Dynal AS). Cells were washed and cultured at 37°C, 5% CO2 until confluent in 24-well cell culture plates (Cat# 353047, Becton Dickinson and Company, Franklin Lakes, NJ). Nonadherent cells were removed on the second day after plating by gently washing the wells and then removing the supernatant and replacing with fresh cell culture medium. Approximately 4 days from the start of cultures, the supernatants were removed and the monolayers were gently washed with PBS. Wells were infected with 5 MOI of nonrecombinant SeV or mock-infected with infection medium (DMEM containing 0.15% BSA, supplemented with dextrose (500 μg/mL), glutamine (2 mM), 2-mercaptoethanol (3×10⁻⁵ M), essential and nonessential amino acids, sodium pyruvate, sodium bicarbonate, and antibiotics, in a volume of 200 μL. Plates were incubated at 37°C for 1 h with intermittent rocking. Some wells then received CLN cells (1×10⁶ cells/well) from nonrecombinant SeV-infected mice (taken 10–17 days following infection) or from uninfected mice in 800 μL of infection medium and incubated overnight at 37°C. Control wells received CLN with or without virus. In some cases, cells were first enriched for CD4+ or CD8+ cell populations by adhering to plastic coated with goat anti-mouse IgG (100 μg/mL in PBS, Jackson ImmunoResearch Laboratories, Inc, West Grove, PA) and depleted of CD8+ or CD4+ cell populations respectively, using rat anti-mouse CD8 (clone 53.6.7.2) or rat anti-mouse CD4 (clone GK1.5) antibodies, followed by incubation with sheep anti-Rat IgG DynaL beads (Cat# 110.35, Invitrogen Dynal AS) and removal of magnet-bound cells. In this case, cell cultures were with 3×10⁵ cells/well. After overnight incubation, supernatants were collected for testing with mouse chemokine/cytokine kits (Cat# LMC0005 for MIP-1α, KC, MCP-1 (CCL2), MIG (CXCL9), IP-10 (CXCL10), LMC1031 (RANTES), and LMC1051 (MIP-1β), Invitrogen™, Carlsbad, CA). Values were determined by comparison to a standard curve as recommended by manufacturers.
Statistical analyses
For analyses of in vivo cell positioning, each merged confocal image was evaluated independently. In each case, a polygon defined the border of the infected (green) fields. Within the polygon, each donor cell was scored for distance from its nearest neighbor, and data were averaged for all cells within the polygon. This average value was termed 'mean minimum distance' or MMD. Mathematica 8 software was next used to generate 400 random uniform bivariate distributions using the same polygon and the same number of resident donor cells or points, yielding an approximately normal distribution. Each test MMD was compared to its polygon-specific, software-generated normal distribution to determine Z-scores in units of standard deviation and p values. Negative and positive Z-scores respectively indicated the extent to which cells were positioned either (i) closer to their nearest neighbor or (ii) farther from their nearest neighbor, on average, than would typify a cell population in a random uniform bivariate distribution. For analyses of chemokines and cytokines, statistical analyses were with Student T tests using Prism software.
Results
Responding lymph node cells assume a non-random spatial configuration within virus-infected epithelial tissues of the respiratory tract
To examine the positioning of lymphocytes within virus-infected respiratory tract epithelium, transfer experiments were designed. In first experiments, donor cells were isolated from CLN of Sendai virus-infected mice (day 10 after infection) and marked with CMTMR. They were then transferred into syngeneic host mice that were infected one day later with a recombinant SeV expressing enhanced green fluorescent protein (SeV-eGFP). After 2 additional days, mice were sacrificed. Snouts were removed, stained with DAPI, and imaged using confocal microscopy. Confocal microscopy captured monolayers of infected airway epithelial cells (the known targets of SeV infection) and associated lymphocytes, but did not penetrate underlying tissues. Our analyses of individual xy sections captured limited areas of tissue and confirmed that infected cells and donor cells were co-localized (Fig. 1A). To view larger areas of infected epithelial cell monolayers that were not perfectly aligned with a single xy plane, we scanned up and down the z axis by 3–6 micron increments and merged images (Figure 1B). We could then observe full blankets of infected epithelial cells. Donor cells (red) were distributed across infected fields (green) with only rare overlap. Rather than residing in clusters, the transferred, labeled cells appeared to maximize distances from each other within infected areas. Patterned cell distributions were evident both in individual xy sections (Fig. 1A) and images from merged Z-tracks (Fig. 1B).
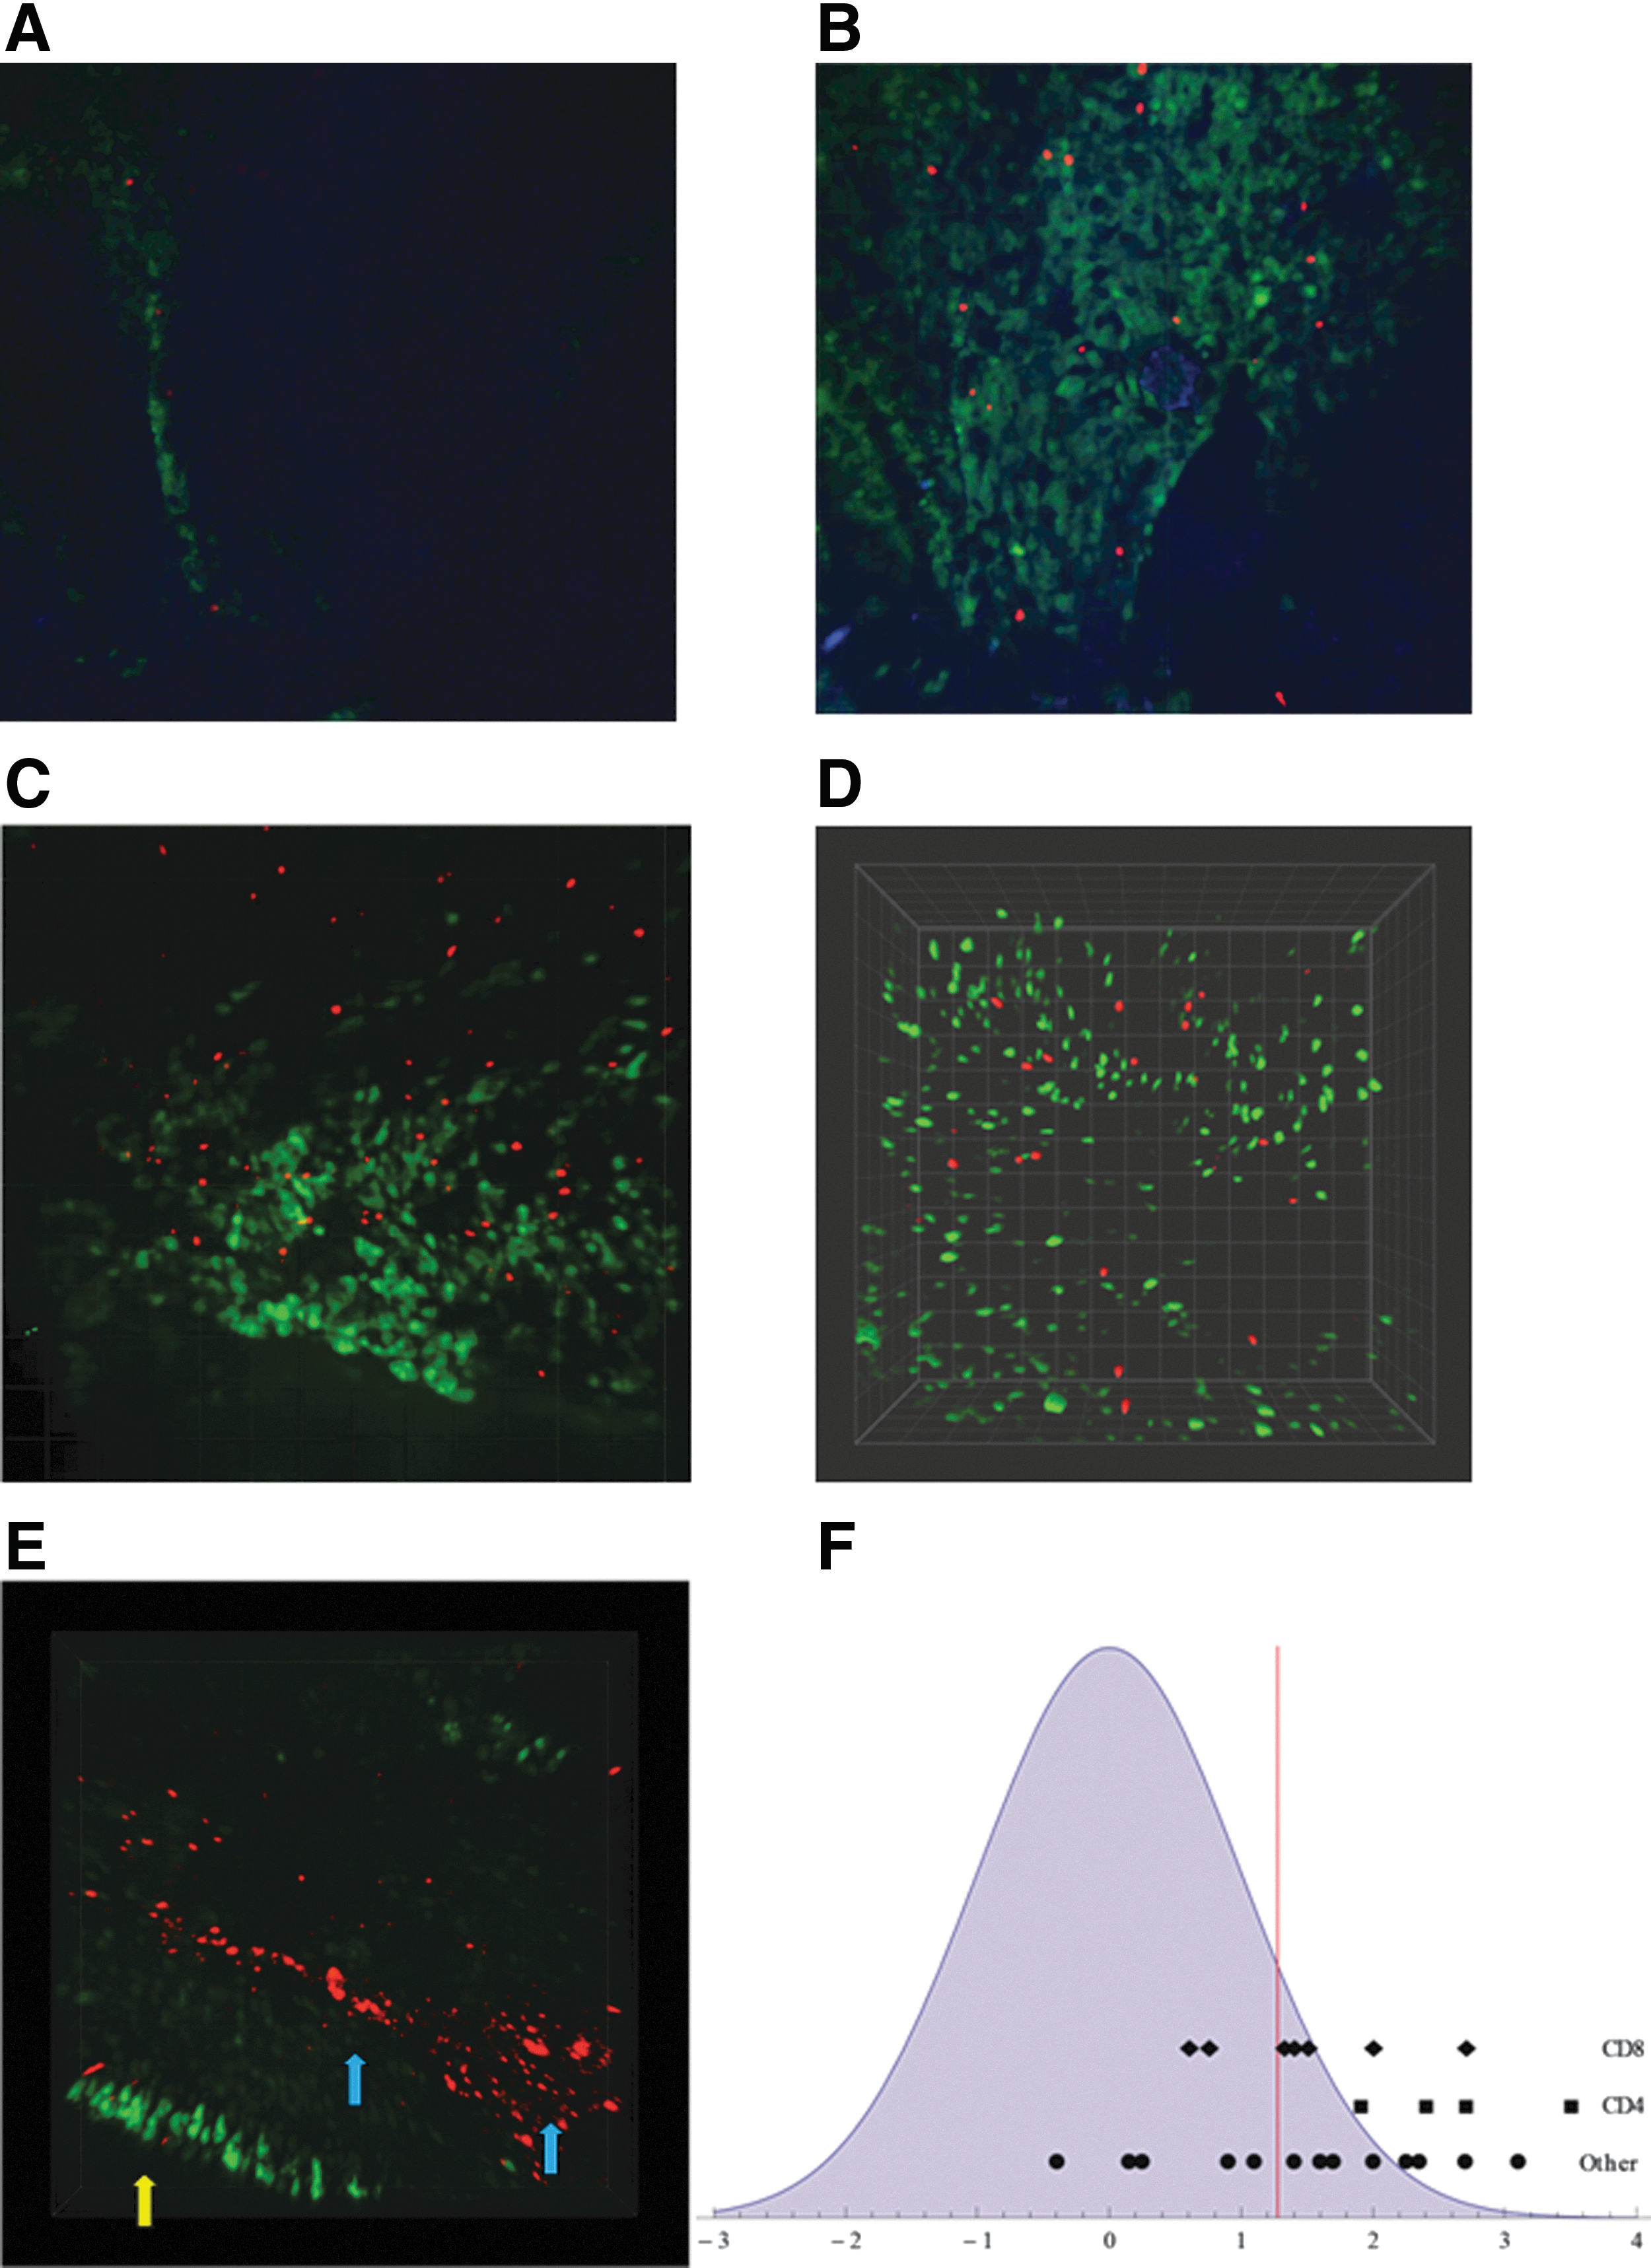
Donor cells distributed within SeV-infected upper respiratory tract tissue.
The patterned configurations that were observed with unseparated, primed donor cells in infected tissues were also visualized when cells were enriched for CD8+ (Fig. 1C) or CD4+ (Fig. 1D) lymphocytes prior to transfer and when virus infection either preceded or followed the administration of marked donor cells. When primed donor cells (red) were found in areas of the upper respiratory tract that were not green, perhaps indicative of cells within vessels (e.g., Fig. 1E, blue arrows), the patterned configurations typifying green, infected areas were not apparent. When mice were uninfected, the green fluorescent fields were not evident and marked donor cells were rarely identified in DAPI-stained tissues. When unprimed donor cells were used, they were relatively difficult to locate in infected tissues, perhaps because their migration was not halted by receptor-epitope engagement.
To evaluate data numerically, each merged image of infected tissues was scored for ‘mean minimum distance (MMD)’, the average distance between each donor cell and its nearest neighbor in the infected field (see Materials and Methods). For each image, results were then compared with a random uniform bivariate distribution based on the same number of cells and the same imaged area. Evaluations were conducted independently and repeatedly for CD4+ T cells, CD8+ T cells, and unseparated CLN. Figure 1F shows Z-scores from individual images plotted on the X axis. These images were from an experiment with enriched CD4+ cells, an experiment with enriched CD8+ cells, and two combined experiments with unseparated cells ('other') to show Z-score ranges. For the majority of cases, Z-scores were positive. Points to the right of the vertical marker in Figure 1F represent p values that were less than 0.1. The probability that the composite of data was a chance observation for CD4+ T cells, CD8+ T cells, or unseparated cells was less than 1 in 1000, confirming that average distances between donor cells were unusually high in infected fields, atypical of a random uniform bivariate distribution. In total, thirteen experiments were conducted, including more than twenty mice and hundreds of imaged cells, demonstrating that the vast majority of marked, transferred cells were spatially distant from one another within infected fields.
To explain how one donor cell might influence the positioning of another in the Sendai virus model, we hypothesized that a newly resident cell in an infected tissue may alter expression of chemokines/cytokines in its microenvironment, thus marking territory and repelling other cells to minimize co-localization. To test this hypothesis, we co-cultured virus-primed or unprimed lymph node cells with respiratory tract stroma and virus. As demonstrated in Figure 2A–D, the presence of naïve cells (1×10⁷ per well) in virus-infected cultures marginally enhanced chemokine expression, while the presence of primed cells greatly enhanced chemokine expression. Affected factors included RANTES, MIG (CXCL9), IP-10 (CXCL10), and MCP-1 (CCL2), shown in Figure 2A–D, respectively. MIP1α (CCL3) and MIP1β (CCL4) were also enhanced (data not shown). The experiment was additionally performed with enriched CD4+ or CD8+ cells from primed lymph nodes. In this case, smaller numbers of lymphocytes were added to wells (3×10⁵ cells per well). Nonetheless, both CD4+ and CD8+ cells were able to enhance chemokine expression in virus infected cultures (Figure 2E–H). Results supported the concept that lymphocytes can alter their cytokine milieu in an infected field and in so doing might influence patterns of cell migration and residence in vivo.
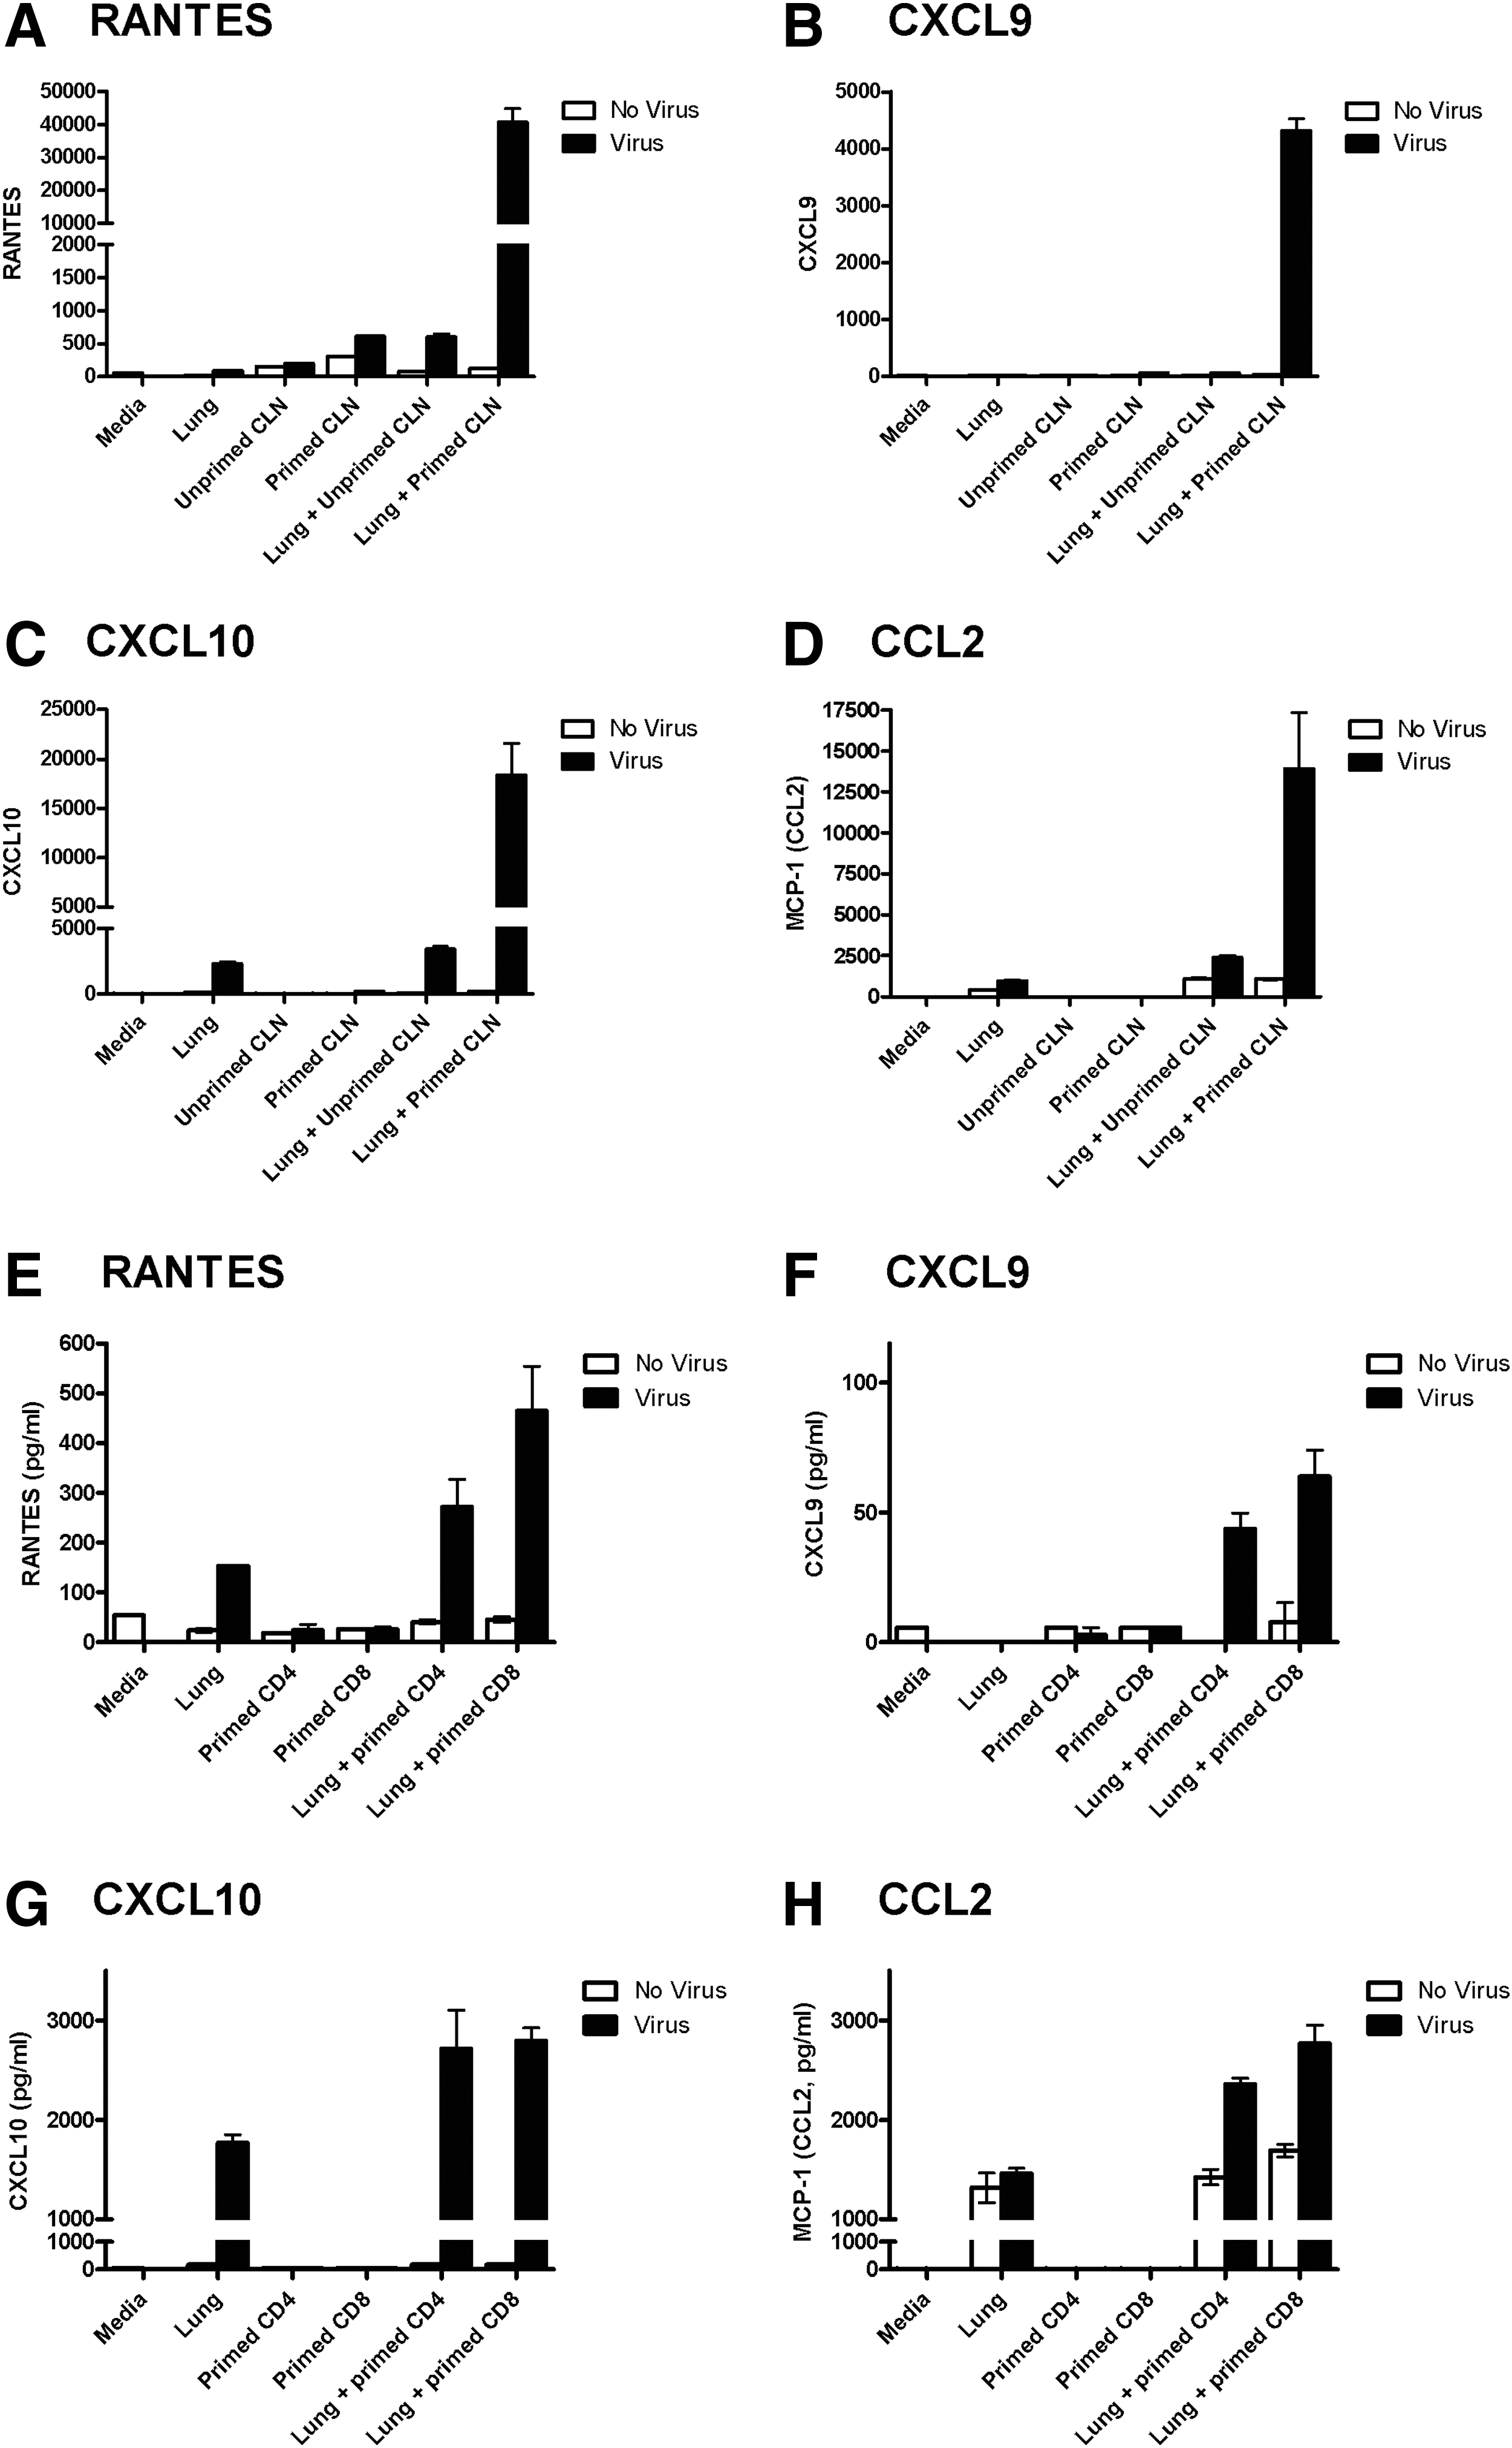
CLN cells alter the chemokine/cytokine milieu of virus-infected stroma.
Discussion
There is a wealth of information available in the literature describing the chemokine/cytokines secreted by antigen presenting cells or stromal cells to summon lymphocytes into an infected tissue (14,32). These include RANTES, MIP1α, MIP1β, CXCL9, CXCL10, and CXCL12, to name a few. Previous studies have focused primarily on signals from DCs and stromal cells, but results from the current study suggest that lymphocytes may influence their own chemokine/cytokine milieu to impact cross-talk, migration, and co-localization. Our first indication of this concept was upon examination of donor cells that had migrated into an infected field of respiratory tract epithelial cells. We found that donor cells were arranged in a non-random distribution across infected tissues. They were rarely found in an overlapped or clustered configuration. Non-random configurations were also evident when donor cells were first enriched for CD4+ or CD8+ lymphocytes indicating that patterns typified more than one T cell type. The patterning of effectors may be a means of expediting viral clearance by avoiding redundant kill of infected targets.
Multiple potential explanations exist for the non-random distribution of incoming lymphocytes in an infected field. First, the time and space required for cell extravasation across blood vessels may be limiting. Perhaps two cells cannot easily cross endothelium at the same position or time, thus distancing cells from one another as they enter parenchymal tissues. Another explanation for cell dispersal is that there is lymphocyte cross-talk mediated by the creation of chemokine/cytokine halos. The latter concept is supported by our in vitro studies in which chemokines were tested after co-cultures of effectors with respiratory tract stromal cells and virus. Experiments showed that unseparated, lymph node cells (particularly primed cells), before or after enrichment for either CD4+ or CD8+ lymphocytes instructed an increase in chemokine production (including RANTES, CXCL9, CXCL10, and CCL2). The chemokines were likely produced both by lymphocytes (e.g., RANTES) and by stromal cells (e.g., CCL2).
Based on these data, we hypothesize that T lymphocytes are first summoned into the infected respiratory tract by 'danger' signals emitted by stroma and antigen presenting cells, and might advance toward the center of an infected tissue where stromal cell signals may be maximal. Both antigen-specific and nonspecific lymphocytes may enter tissues (9), but the cells that encounter their specific antigen and engage antigen receptors are more likely to establish residence. At this point, a cell may mark its territory by altering the production of various chemokines and cytokines in its vicinity. Other lymphocytes might then be repelled to avoid co-localization. Signals are known to accelerate, inhibit or redirect migrating cells, in part due to up- and downregulation of cytokine/chemokine receptors (8,12,15,25). Migrating lymphocytes will not only receive complex signals from other neighboring lymphocytes and stroma, but will receive feedback signals following autologous chemokine/cytokine expression.
One final consideration prompted by these data pertains to transfer experiments that may be influenced by lymphocyte cross-talk, perhaps explaining some discrepancies in the literature (1,21,28,39,34). Often transfer experiments are designed to include two different lymphocyte populations that are mixed prior to injection, to compare homing potentials. It is often presumed that each cell's behavior is independently defined by phenotype. One may now consider that lymphocyte cross-talk might alter behaviors when two populations of cells are mixed. Routine, parallel tests of individual and mixed populations may reveal new potentials in that one migrating cell population may alter the behavior of another.
In conclusion, the data in the current report show that lymphocytes are positioned to maximize distances from each other in infected fields. Data also show that primed lymphocytes alter their chemokine environment when exposed to virus and stromal cells in vitro, suggesting a mechanism by which one cell might repel another to avoid overlap and functional redundancy in vivo. These results are not surprising as cell communication is instrumental in the success of virtually all biological functions involving both eukaryotic and prokaryotic cells (17) (e.g., quorum sensing by bacteria provides a means to improve nourishment, movement, virulence, and protection at the population level) (31). Among T cells, cross-talk based on cytokine secretion patterns has been realized for decades (23,24). Most often cytokines/chemokines have been evaluated in the context of cell development and activation signals, whereas we now focus attention on the localization of cells in an infected field. Future studies may define comprehensively the decision-making processes of lymphocytes during their migration. New state-of-the-art intravital imaging technology (13) now provides increased capacity for comprehensive and longitudinal assessment of immune cell migration to define the population dynamics with which lymphocyte populations recognize and clear virus-infected targets in the respiratory tract.
Footnotes
Acknowledgments
We thank the Animal Resources Center at St. Jude for animal care. Research was funded in part by NIH P30 CA21765, We thank Victoria Frohlich and Jamshid Temirov of the St. Jude imaging core for assistance with confocal microscopy. P01 AI054955, R01 AI088729 and the American Lebanese Syrian Associated Charities (ALSAC).
Author Disclosure Statement
No competing financial interests exist.