
Abstract
Dendritic cell–specific ICAM-3-grabbing nonintegrin (DC-SIGN) is an essential process for virus infection, such as HIV and hepatitis C, and plays a role in immune escape. However, the role of DC-SIGN in hepatitis B virus (HBV) infection is still unknown. The aim of this study was to investigate the role of DC-SIGN in mediating the maturation and activation of dendritic cells (DCs) when infected by HBV. Highly mannosylated HBV particles were obtained by treating HBV-producing HepG2.2.15 cells with the a-mannosidase I-inhibitor kifunensine. Highly mannosylated HBV or wild type HBV was added to infect the DCs of the DC-SIGN gene-silencing group and normal group, respectively. Then, the expression of CDla, CD80, CD83, CD86 and HLA-DR on DCs was detected by flow cytometry, the capacity of stimulating lymphocyte proliferation was tested by MTT assay, the level of IL-12p70 that was released by DCs was measured by enzyme-linked immunosorbent assay, and the expression of the proteins NF-κBp65 and p38 was detected by western blot. Both wild type and highly mannosylated HBV could promote DCs maturation and activation. However, the highly mannosylated HBV could promote DCs immune activation more strongly. The difference in the effect on DCs between the two types of HBV could be eliminated by DC-SIGN gene silencing. DC-SIGN can promote the maturation and activation of DCs when recognized HBV, but wild type HBV can escape recognition by DC-SIGN to a certain extent with the help of demannosylated modification, leading to defective DCs function and chronic HBV infection.
Introduction
M
DC-specific ICAM-3-grabbing nonintegrin (DC-SIGN) is an important CLR that is exclusively expressed by DCs. DC-SIGN is a type II membrane protein that was discovered by American scientists in 2000 (7). DC-SIGN plays an important role in the recognition of pathogen-associated molecular patterns. A broad range of glycosylated pathogens can be recognized by DC-SIGN through mannose- or fucose-containing carbohydrates, including HIV-1, hepatitis C virus, Ebola virus, Dengue virus, measles virus, human herpesvirus 8, SARS coronavirus, cytomegalovirus, Mycobacterium tuberculosis, Helicobacter pylori, Streptococcus pneumonia, and Neisseria meningitides (4,14). The outcome of this interaction depends on the pathogens. Many of these pathogens subvert the immune surveillance function of DC-SIGN for their own benefit and redirect the internalization route for protection and transmission to target cells (8). Some pathogens can modulate adaptive immune responses through interaction with DC-SIGN; for example, M. tuberculosis targets DC-SIGN to suppress immune function of DCs (1).
There are rich mannose oligosaccharides on the HBV envelope (12). Because DC-SIGN mainly recognizes mannose- or fucose-containing carbohydrates, it is likely involved in HBV infection. An in vitro study demonstrated that HBsAg- or HepG2.2.15-derived HBV do not bind DC-SIGN, but highly mannosylated HBV, which was obtained by treating HBV-producing HepG2.2.15 cells with the a-mannosidase I-inhibitor kifunensine, was recognized by DC-SIGN (5). However, the outcome of the interaction between HBV and DC-SIGN is still unknown. Whether this interaction will promote DC maturation to activate the immune response or, in contrast, inhibit DC maturation to induce immune tolerance remains a mystery. Therefore, this study was performed to investigate the function of DC-SIGN in the persistence of HBV infection.
Materials and Methods
HepG2.2.15-derived HBV
HepG2.2.15 cells (serotype ayw, genotype D) were cultured in Dulbecco's modified Eagle's medium (DMEM; HyClone, Logan, UT) that was supplemented with 10% fetal calf serum (FCS; Gibco, Paisley, United Kingdom). HepG2.2.15 cells were treated with the a-mannosidase I inhibitor kifunensine (5 days, 20 μg/mL; Calbiochem, Darmstadt, Germany) to obtain highly mannosylated HBV. Untreated HepG2.2.15 cells served as negative controls. HBV particles were concentrated from the medium using a previously described method (13). HBV DNA was isolated using the High Pure System Viral Nucleic Acid Kit (Roche Diagnostics, Penzberg, Germany) and quantified by COBAS TaqMan HBV Test (Roche Diagnostics GmbH, Mannheim, Germany). The final concentration of HBV particles was 5×10⁶/mL.
Isolation of DCs from peripheral blood
Peripheral blood mononuclear cells were isolated from the heparinized blood of healthy donors by Ficoll centrifugation and were cultured in RPMI-1640 medium (HyClone) without FCS for 4 h. Then, the suspended cells were removed. The remaining adherent cells were cultured in a medium consisting of RPMI-1640/FCS 10%, rhGM-CSF 500 μ/mL (PeproTech, London, United Kingdom), and rhIL-4 1,000 μ/mL (PeproTech). DCs were isolated and matured in the presence of HBV, HepG2.2.15-derived HBV, or the appropriate controls. After 48 h, the mDCs and supernatant were harvested for analysis.
Expression of the cell surface molecules on DCs
DCs were stained with combinations of the following antibodies: human anti-CD1a-FITC (clone HI149; eBioscience, San Diego, CA); human anti-CD80-FITC (clone 2D10.4; eBioscience); human anti-CD83-FITC (clone HB15e; eBioscience); human anti-CD86-PE (clone IT2.2; eBioscience); and human anti-HLA-DR-PE (clone LN3; eBioscience). The DCs were then analyzed by flow cytometry with corresponding isotype-matched control antibodies to determine the background staining.
Cytokine production by DCs
The levels of interleukin-12p70 (IL-12p70) in the harvested supernatant were determined using an enzyme-linked immunosorbent assay (ELISA) using a kit from Diaclone (Besancon, France).
T cell stimulatory capacity of DCs
The T cell stimulatory capacity of mDCs was determined in an allogeneic mixed lymphocyte reaction (MLR). The isolated mDCs were cultured in the presence of lymphocytes or the appropriate controls. After 72 h, a MTT assay was performed to calculate the DC stimulation index (SI).
DC-SIGN gene silencing
An aliquot of 5 nmol of DC-SIGN siRNA (Table 1; Guangzhou RiboBio Co. Ltd., Guangzhou, China) was dissolved in 250 μL double-distilled water to obtain 20 μmol/L siRNA mother liquid. The DCs were cultured in six orifice plates. The medium was changed with 1 mL of OMEM per orifice on day 5, to which 10 μL of DC-SIGN siRNA mother liquid was added into 200 μL of OMEM, and 10 μL of liposome (QIAGEN, Germany) was added into another 200 μL OMEM before being mixed and incubated for 20 min. A total of 420 μL of OMEM solution was added to the DC medium per orifice. After 6 h, the culture medium was changed with 2 mL of RPMI-1640 containing 12% fetal bovine serum per orifice, and DCs continued to be cultivated.
Negative control sequence is confidential, as requested by Guangzhou RiboBio Co.
DC-SIGN, dendritic cell–specific ICAM-3-grabbing nonintegrin.
Reverse transcription polymerase chain reaction
Upstream and downstream primers were designed for reverse transcription polymerase chain reaction (RT-PCR; Table 2). The DCs were digested in Trizol reagent (Invitrogen, Carlsbad, CA) and dissolved in chloroform. Then, the DCs were centrifuged at 20800×g for 15 min at 4°C. The supernatant was isolated and added to isovolumetric isopropyl alcohol. The solution was freeze-thawed and centrifuged at 20800×g for 15 min at 4°C. The precipitant was dissolved in 75% alcohol and centrifuged at 20800×g for 15 min at 4°C. The supernatant was thoroughly discarded, and a suitable amount of deionized water was added to obtain a RNA solution. The reverse transcription reaction for the experimental samples and negative control was set up. Once prepared, RNA solution 2 μL, 5×RT Buffer 4 μL, dNTP (10 mmol/L) 2 μL, Oligo(dT)20 (10 pmol/μL) 1 μl, RNase free H2O 9 μL, RNase inhibitor (10 IU/μL) 1 μL, and ReverTra Ace 1 μL were mixed and incubated at 42°C for 20 min before being heated to 95°C for 5 min and cooled to 4°C for 5 min to obtain the cDNA. The total RT-PCR system of 20 μL included: SYBR®Green Mix 10 μL, primer (2.0 pmol/μL) 2 μL, ddH2O 6 μL, and the above-mentioned cDNA 2 μL (all TOYOBO Co. Ltd., Osaka, Japan). The PCR conditions were as follows: step 1, 95°C for 3 min; step 2, 95°C for 15 sec; step3, 58°C for 20 sec; and step 4, 72°C for 30 sec. The last three steps were cycled 40 times using a RT-PCR instrument (StepOnePlus; Applied Biosystems, Carlsbad, CA).
The concentration of primer storage liquid was 100 μm/L, and before use, 4 μL upstream primer and 4 μL downstream primer was added to 192 μL deionized water to achieve the concentration of 2.0 pmol/μL.
RT-PCR, reverse transcription polymerase chain reaction.
Western blot
The DCs were washed with phosphate-buffered saline and were split with a moderate amount of RIPA cracking liquid. The protein concentration was measured, and 50 μg of total protein was used for electrophoresis. The Western blot was performed under wet conditions as follows: P38, 200 mA, 90 min; and NF-KBp65, 200 mA, 120 min. A polyvinylidene difluoride (PVDF) membrane was soaked with TBST fluid containing 5% skimmed milk powder with shaking for 2 h at room temperature and incubated with primary antibody (HRP-labeled sheep antirabbit antibody and rabbit antisheep antibody and β-actin antibody; Beyotime Institute of Biotechnology, Shanghai, China) at 4°C overnight. The PVDF membrane was washed with TBST and soaked in a second antibody (NF-KBp65 antibody; Epitomics, Burlingame, CA; p38 antibody; BioWorld, Shanghai, China) incubation medium that was diluted 1:70,000 with closed fluid, shaken for 2 h at room temperature. The PVDF membrane was washed with TBST, to which several drops of ECL substrate were added, and incubated for a few minutes. The membrane was developed and photographic fixed on an X-ray film (Eastman Kodak Company, Rochester, NY). BandScan analysis was used to value the gray level on the film. The relative protein expression is shown by the ratio of the gray level of the objective starp to the internal reference starp. The following tools were used: acrylamide and methylenebisacrylamide (AMRESCO, Solon, OH); mitomycin C (Sigma, St. Louis, MO); BCA Protein Assay Kit and PVDF Membrane (Beyotime Institute of Biotechnology); and ECL substrate (Thermo Scientific, Waltham, MA).
Statistical analysis
The data were analyzed using IBM SPSS Statistics for Windows v19.0 (IBM Corp., Armonk, NY), and a p-value of <0.05 was considered statistically significant.
Results
Choosing suitable DC-SIGN siRNA
The cultured DCs were divided into six groups at the beginning of maturity. Flow cytometry was used to detect the DC-SIGN relative expression quantity (Fig. 1a), and RT-PCR was used to detect DC-SIGN mRNA expression on DCs (Fig. 1b). Compared with the blank control group, the siRNA-1 could obviously inhibit DC-SIGN mRNA expression and inhibit the expression of DC-SIGN on DCs. Meanwhile, the liposome group and the blank control group exhibited no obvious differences in these indicators. Therefore, siRNA-1 was chosen for the following experiment.
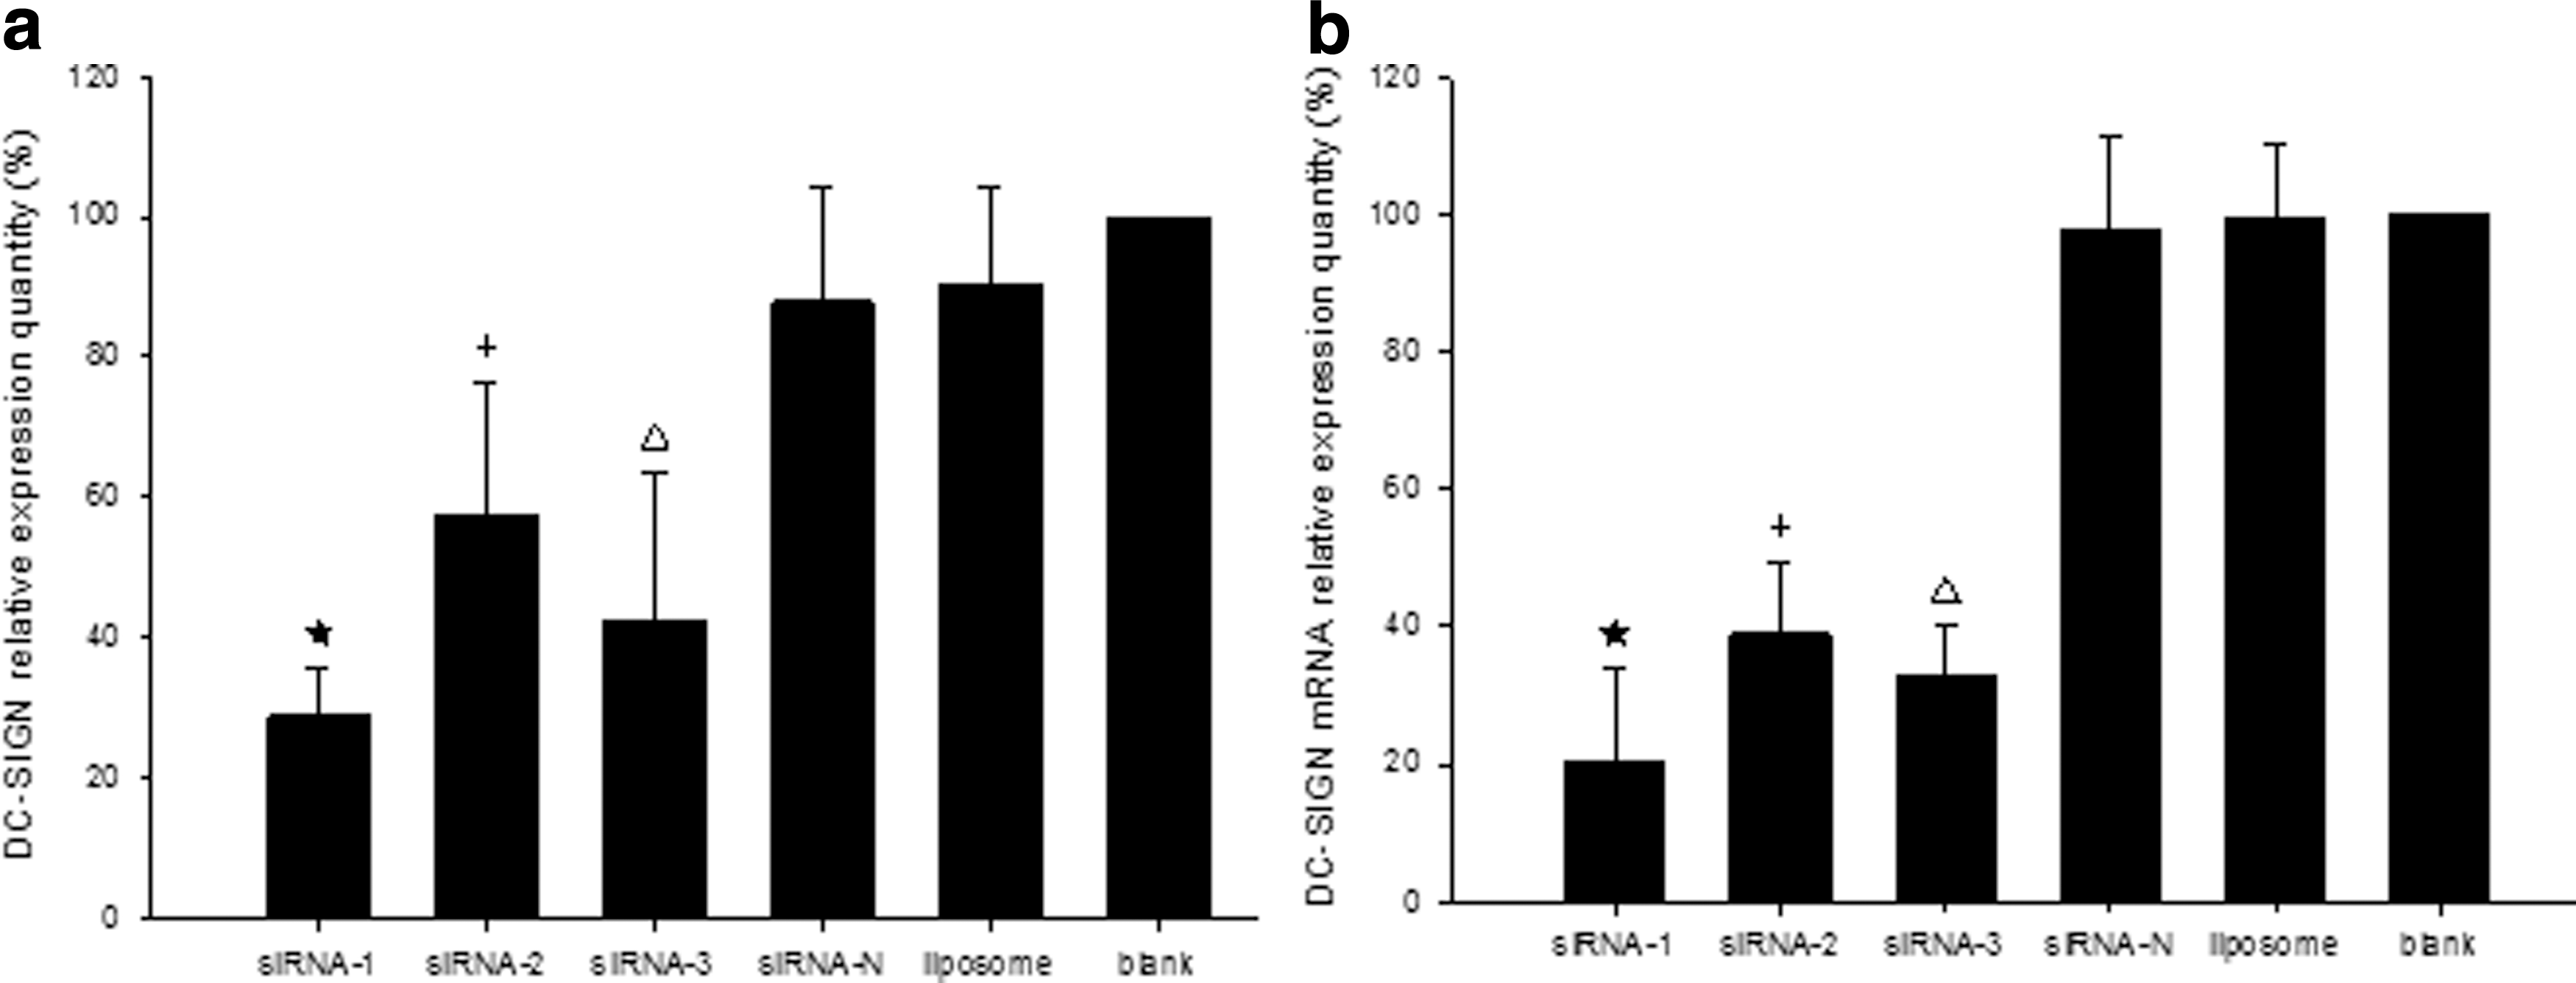
Dendritic cell–specific ICAM-3-grabbing nonintegrin (DC-SIGN) and DC-SIGN mRNA relative expression. The dendritic cells (DCs) were processed as follows: the first three groups were treated with different DC-SIGN siRNAs, with 10 μL siRNA, 10 μl liposome, and 420 μL OMEM added to each one. The fourth group was treated with a negative siRNA sequence. In the liposome group, 10 μL liposome and 410 μL OMEM was added, and in the blank control group, 420 μL OMEM was added. DCs were collected 48 h after intervention using reverse transcription polymerase chain reaction (RT-PCR) to detect DC-SIGN mRNA expression and flow cytometry to detect DC-SIGN expression. The relative expression quantity was compared with the blank control group. (
Influence of DC-SIGN gene silencing on immune activation of DCs
Surface molecule expression
The DCs were divided into three groups when cultured up to day 5: blank group, siRNA-1 group, and siRNA-N group. When the DCs were cultured up to day 7, the cell-surface molecules of the DCs in the three groups were tested by flow cytometry. The expression of CDla, CD80, CD83, CD86, and HLA-DR among the three groups exhibited no significant differences (Table 3).
The DCs were divided into three groups on day 5 and were processed as follows. The DCs were transferred by chosen DC-SIGN siRNA to obtain the DC-SIGN gene silencing group (siRNA-1 group). The DCs were transferred by negative control siRNA sequence to obtain the DC-SIGN nonsilencing group (siRNA-N group). Equivalent OMEM was added into the blank group. There was no statistical difference among the three groups.
Ability of DCs to stimulate T lymphocyte proliferation
The method above was used to divide the DCs into three groups, and then the DCs were cultured up to day 7 for mixed lymphocyte reaction. The ability of DCs to promote lymphocyte proliferation was indistinguishable among the three groups (Fig. 2a).
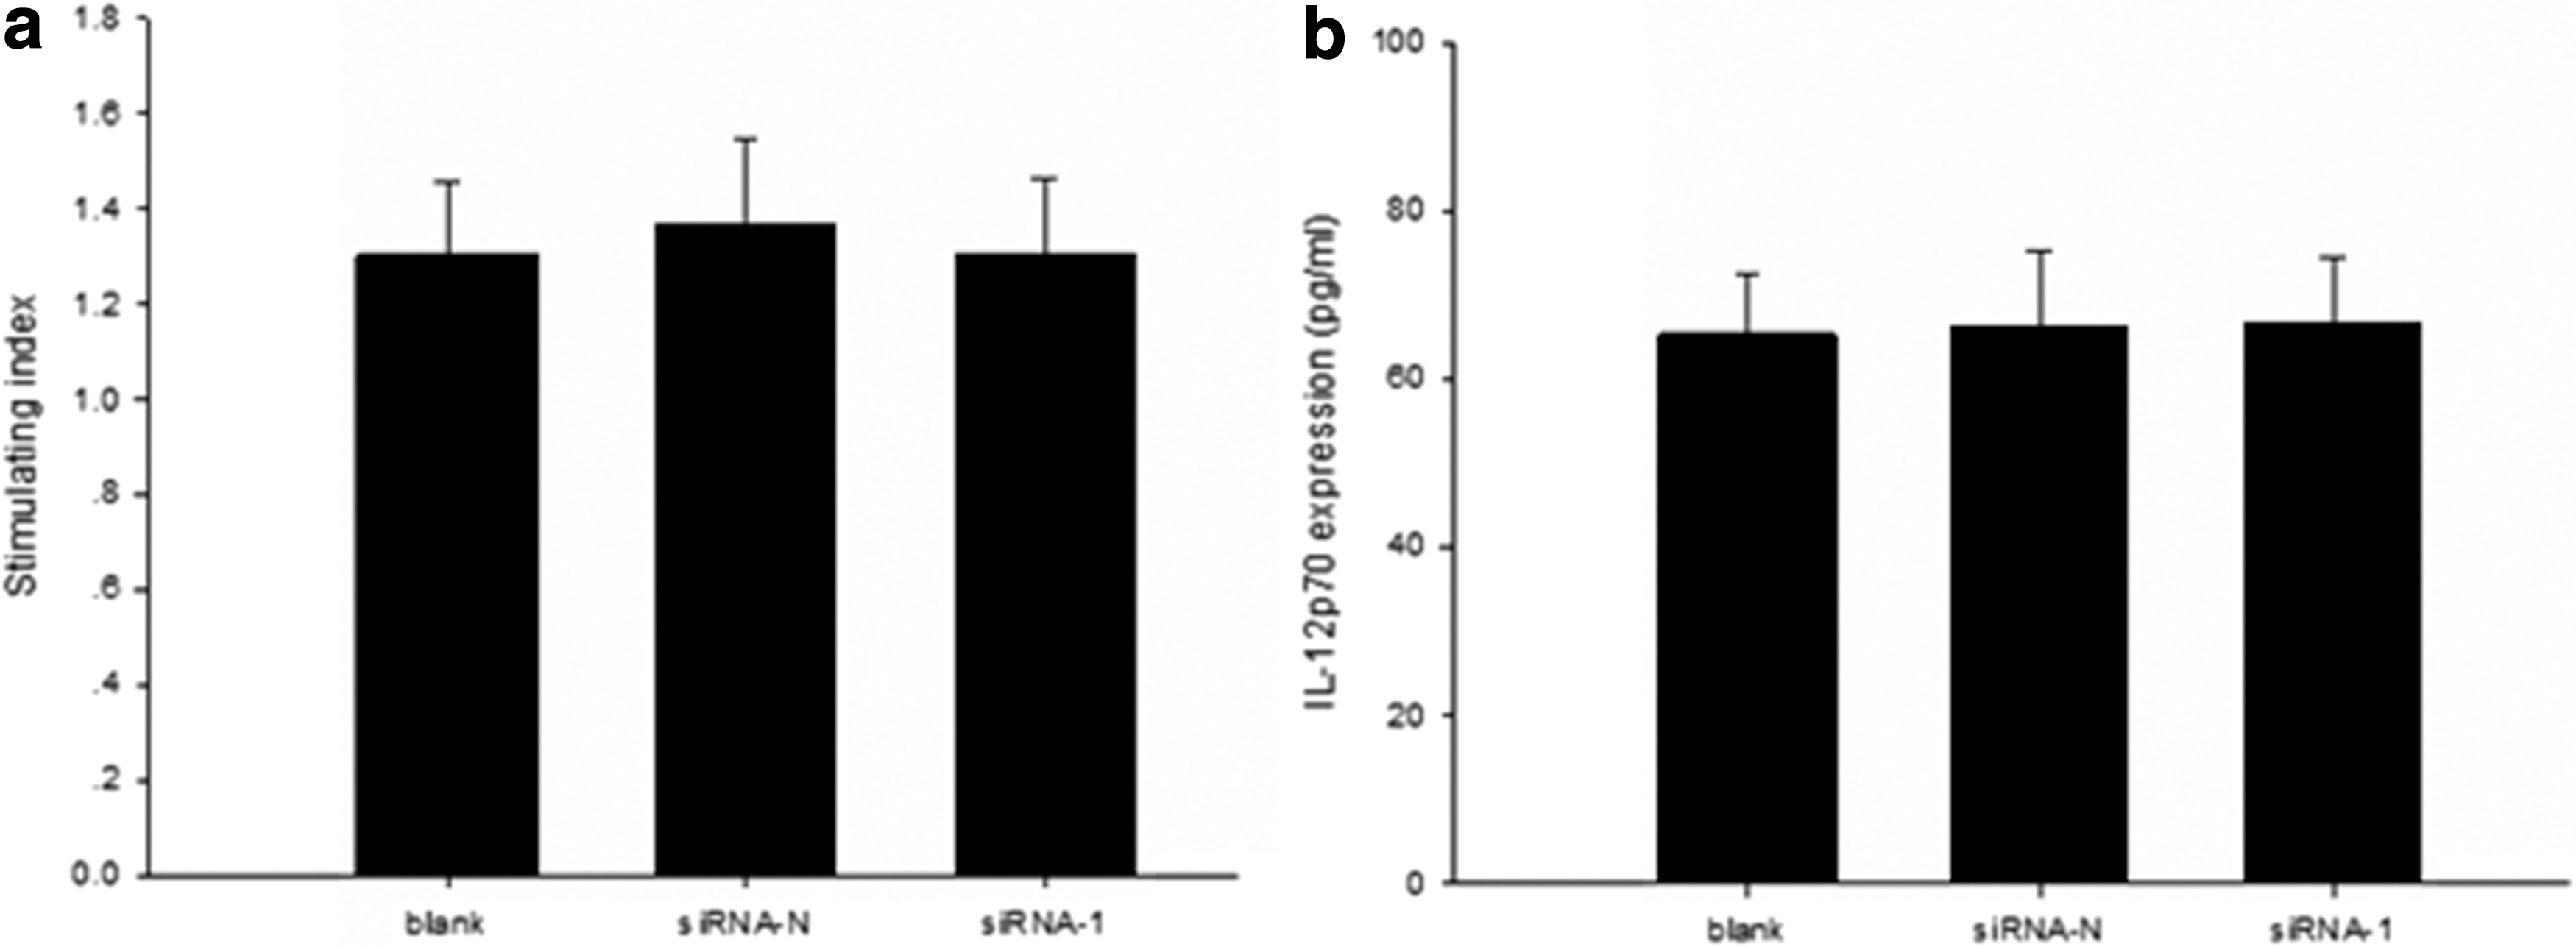
The influence of DC-SIGN gene silencing on the ability of DCs to stimulate T lymphocyte proliferation and secret cytokine IL-12p70. The same method as described in Table 3 was used to divide the DCs into three groups. (
Cytokine IL-12p70 secretion
The method above was used to divide the DCs into three groups, and then the supernatant of the DCs was collected on day 7 to monitor the cytokine level of IL-12p70 using ELISA. Among the three groups, the cytokine level in the DC supernatant showed no statistically significant difference (Fig. 2b).
NF-κBp65 and p38 protein expression
The method above was used to divide the DCs into three groups, and then the preprocessed DCs were collected on day 7 to detect the expression of NF-κBp65 and p38 protein using Western blot. There was no statistically significant difference in the protein expression levels among the three groups (Fig. 3).
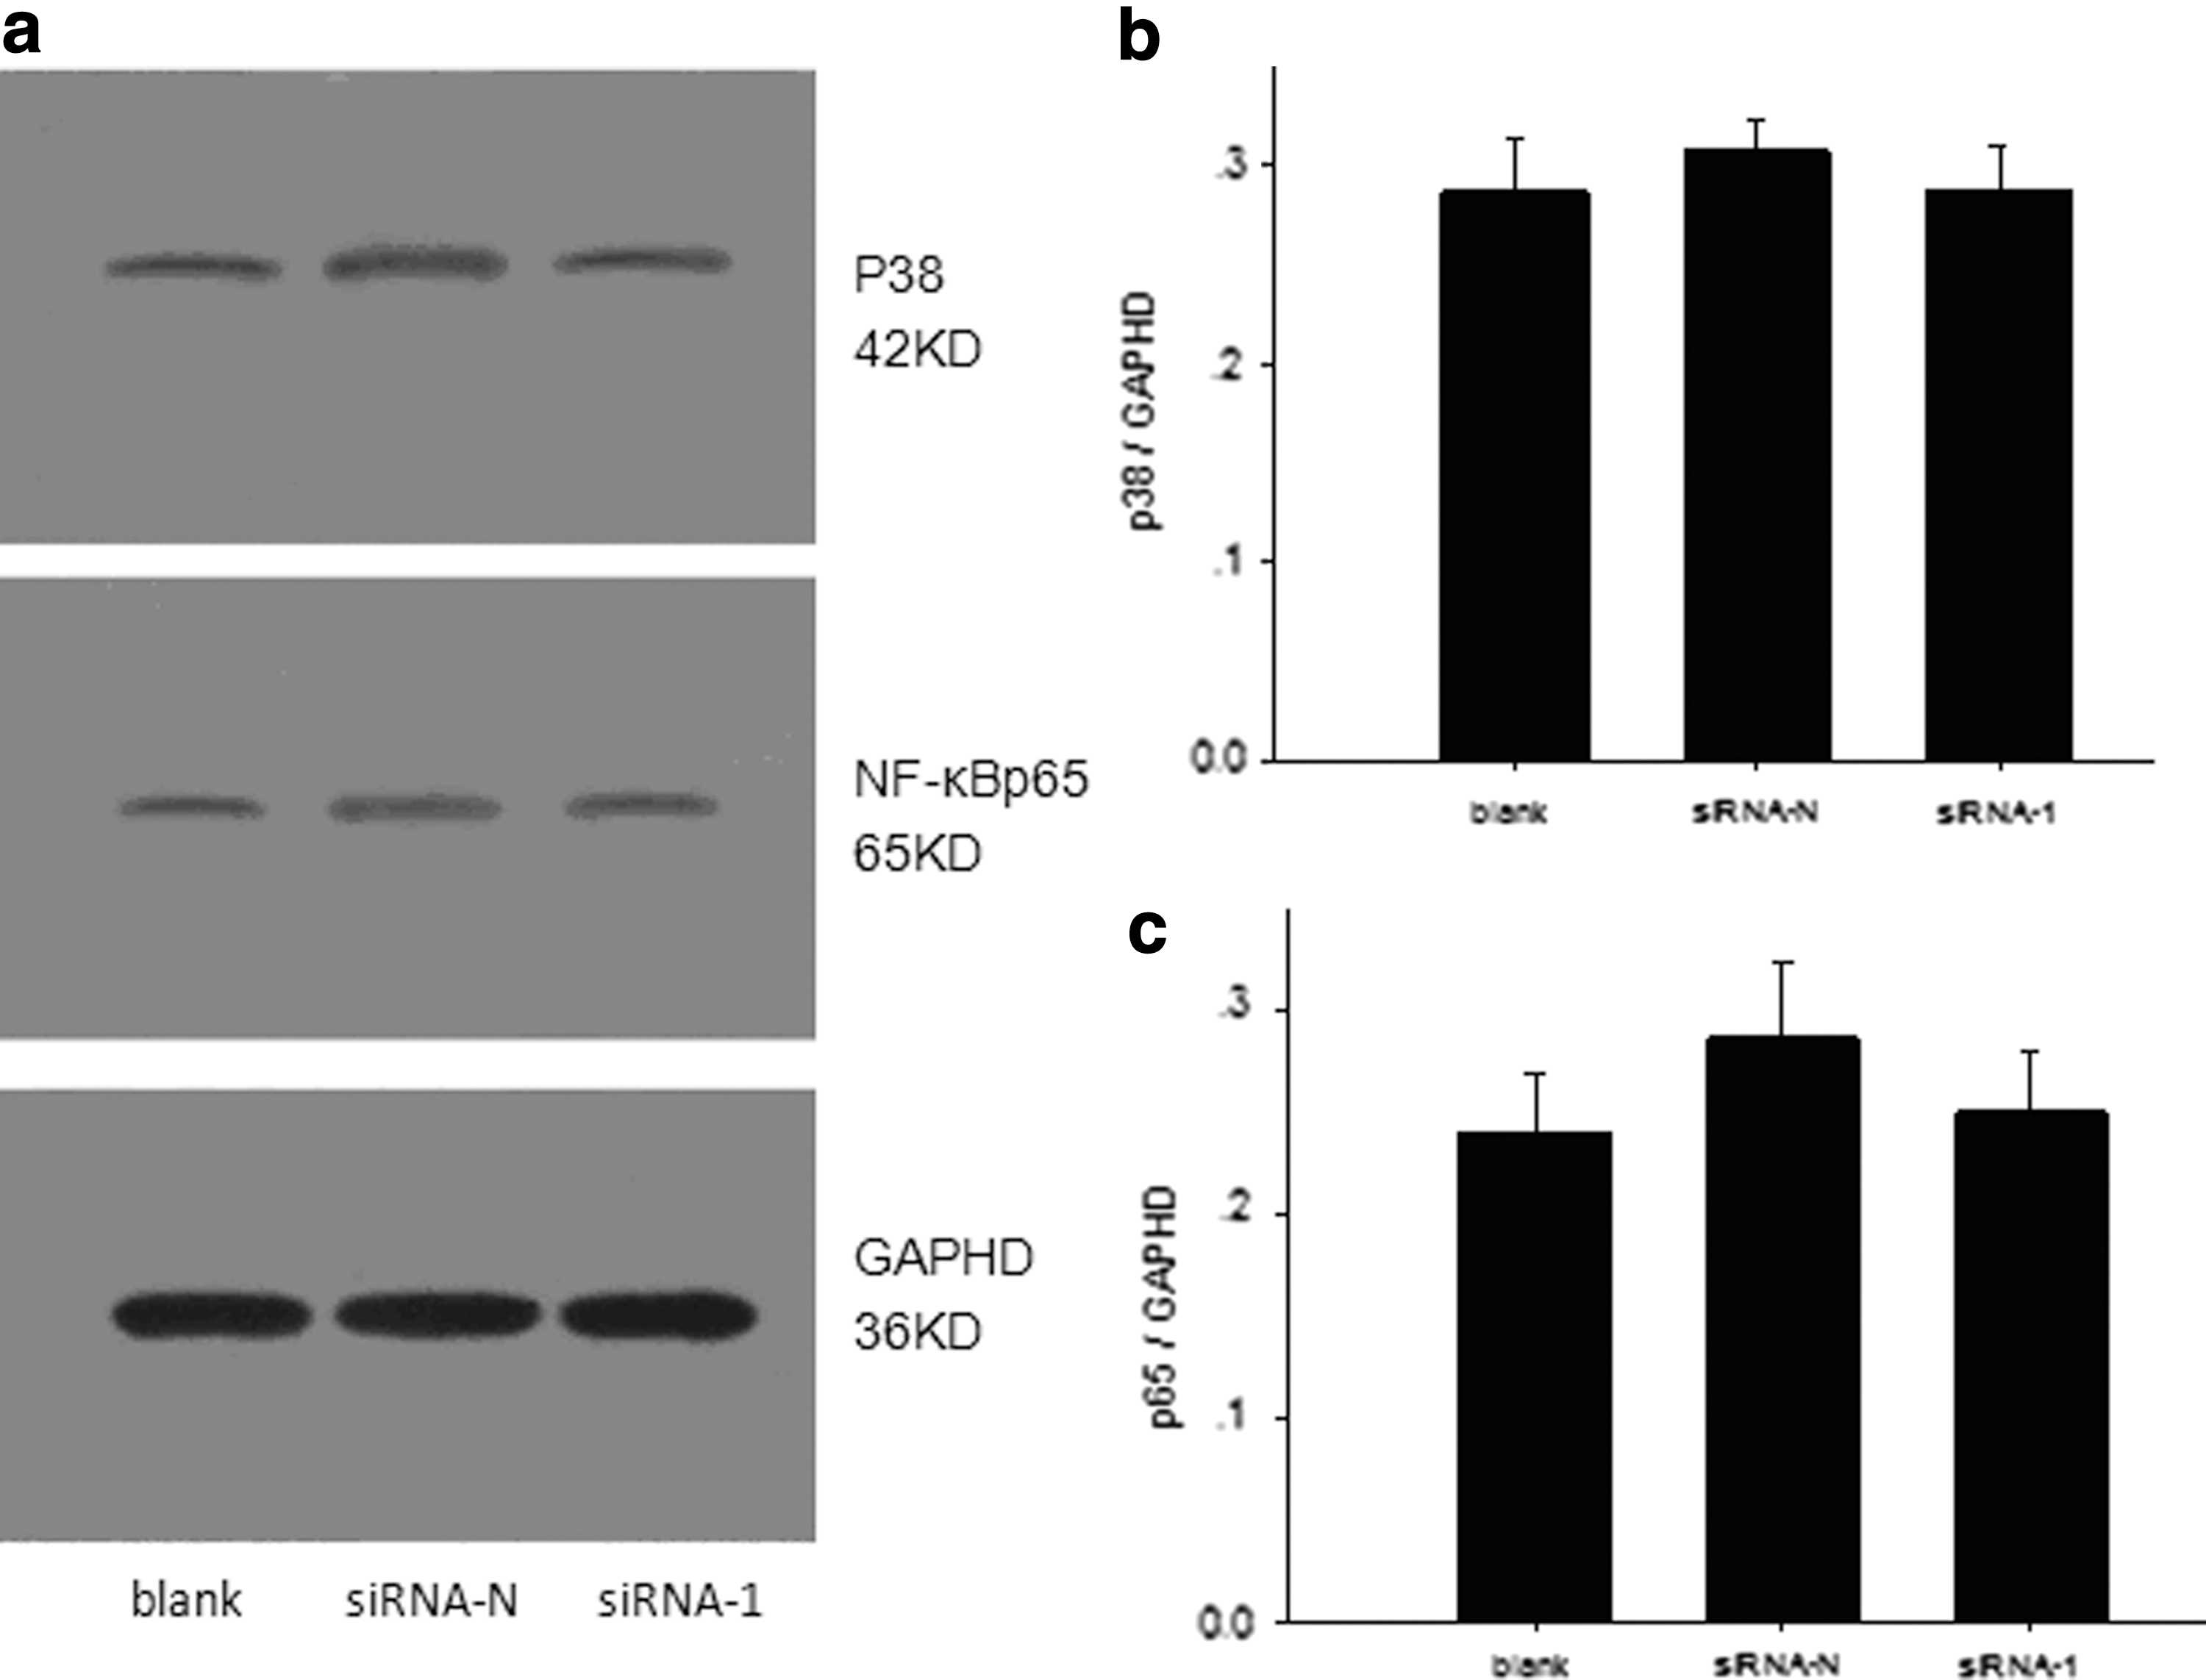
The influence of DC-SIGN gene silencing on NF-κBp65 and p38 protein expression of DCs. The same method as described in Table 3 was used to divide the DCs into three groups. The DCs were then harvested on day 7 for Western blot with the internal reference of GAPDH.
Influence of DC-SIGN gene silencing on immune activation of DCs infected with wild type HBV or highly mannosylated HBV
Molecules expressing on DCs
The DCs were cultured day 7, when the cell surface molecules of the DCs in the six subgroups were tested by flow cytometry. In the DC-SIGN nonsilencing subgroups, the expression of CDla, CD80, CD83, CD86, and HLA-DR in the kifu+HBV subgroup was higher than that in the HBV subgroup. However, in the DC-SIGN gene-silencing group, there was no marked difference in the expression of these molecules between the kifu+HBV subgroup and the HBV subgroup (Table 4).
The DCs were divided into two groups on the day 5: the DC-SIGN gene silencing group, where DC-SIGN was silenced by chosen siRNA, and the DC-SIGN nonsilencing group, where negative siRNA sequence was transferred into cultured DCs. Each group was divided into three subgroups, and was processed by the following intervention factors in their culture medium: adding PBS to control subgroup; adding HBV virion obtained from HepG2.2.15 cells culture supernatant to the HBV subgroup; and adding kifunensine-treated HBV virion to the kifu+HBV subgroup.
Compared with the HBV subgroup, DC-SIGN nonsilencing group has statistically significant differences, t=6.28–56.65, p<0.05.
Compared with the control subgroup, DC-SIGN nonsilencing group has statistically significant differences, t=5.03–158.46, p<0.05.
The expression of CDla, CD80, CD83, CD86, and HLA-DR molecules in the third subgroup from the top was apparently higher than any other subgroup. However, in the DC-SIGN gene silencing group, the expression of molecules mentioned above has no marked difference between the HBV and the kifu+HBV subgroup.
Ability of DCs to stimulate T lymphocyte proliferation
The method above was used to divide the DCs into six subgroups. The DCs were cultured until day 7 for mixed lymphocyte reaction. In the DC-SIGN nonsilencing subgroups, the ability to stimulate lymphocyte proliferation of DCs in the kifu+HBV subgroup was stronger than that of the DCs in the HBV subgroup. However, in the DC-SIGN gene-silencing subgroups, there was no marked difference between the HBV and kifu+HBV subgroups (Fig. 4a)
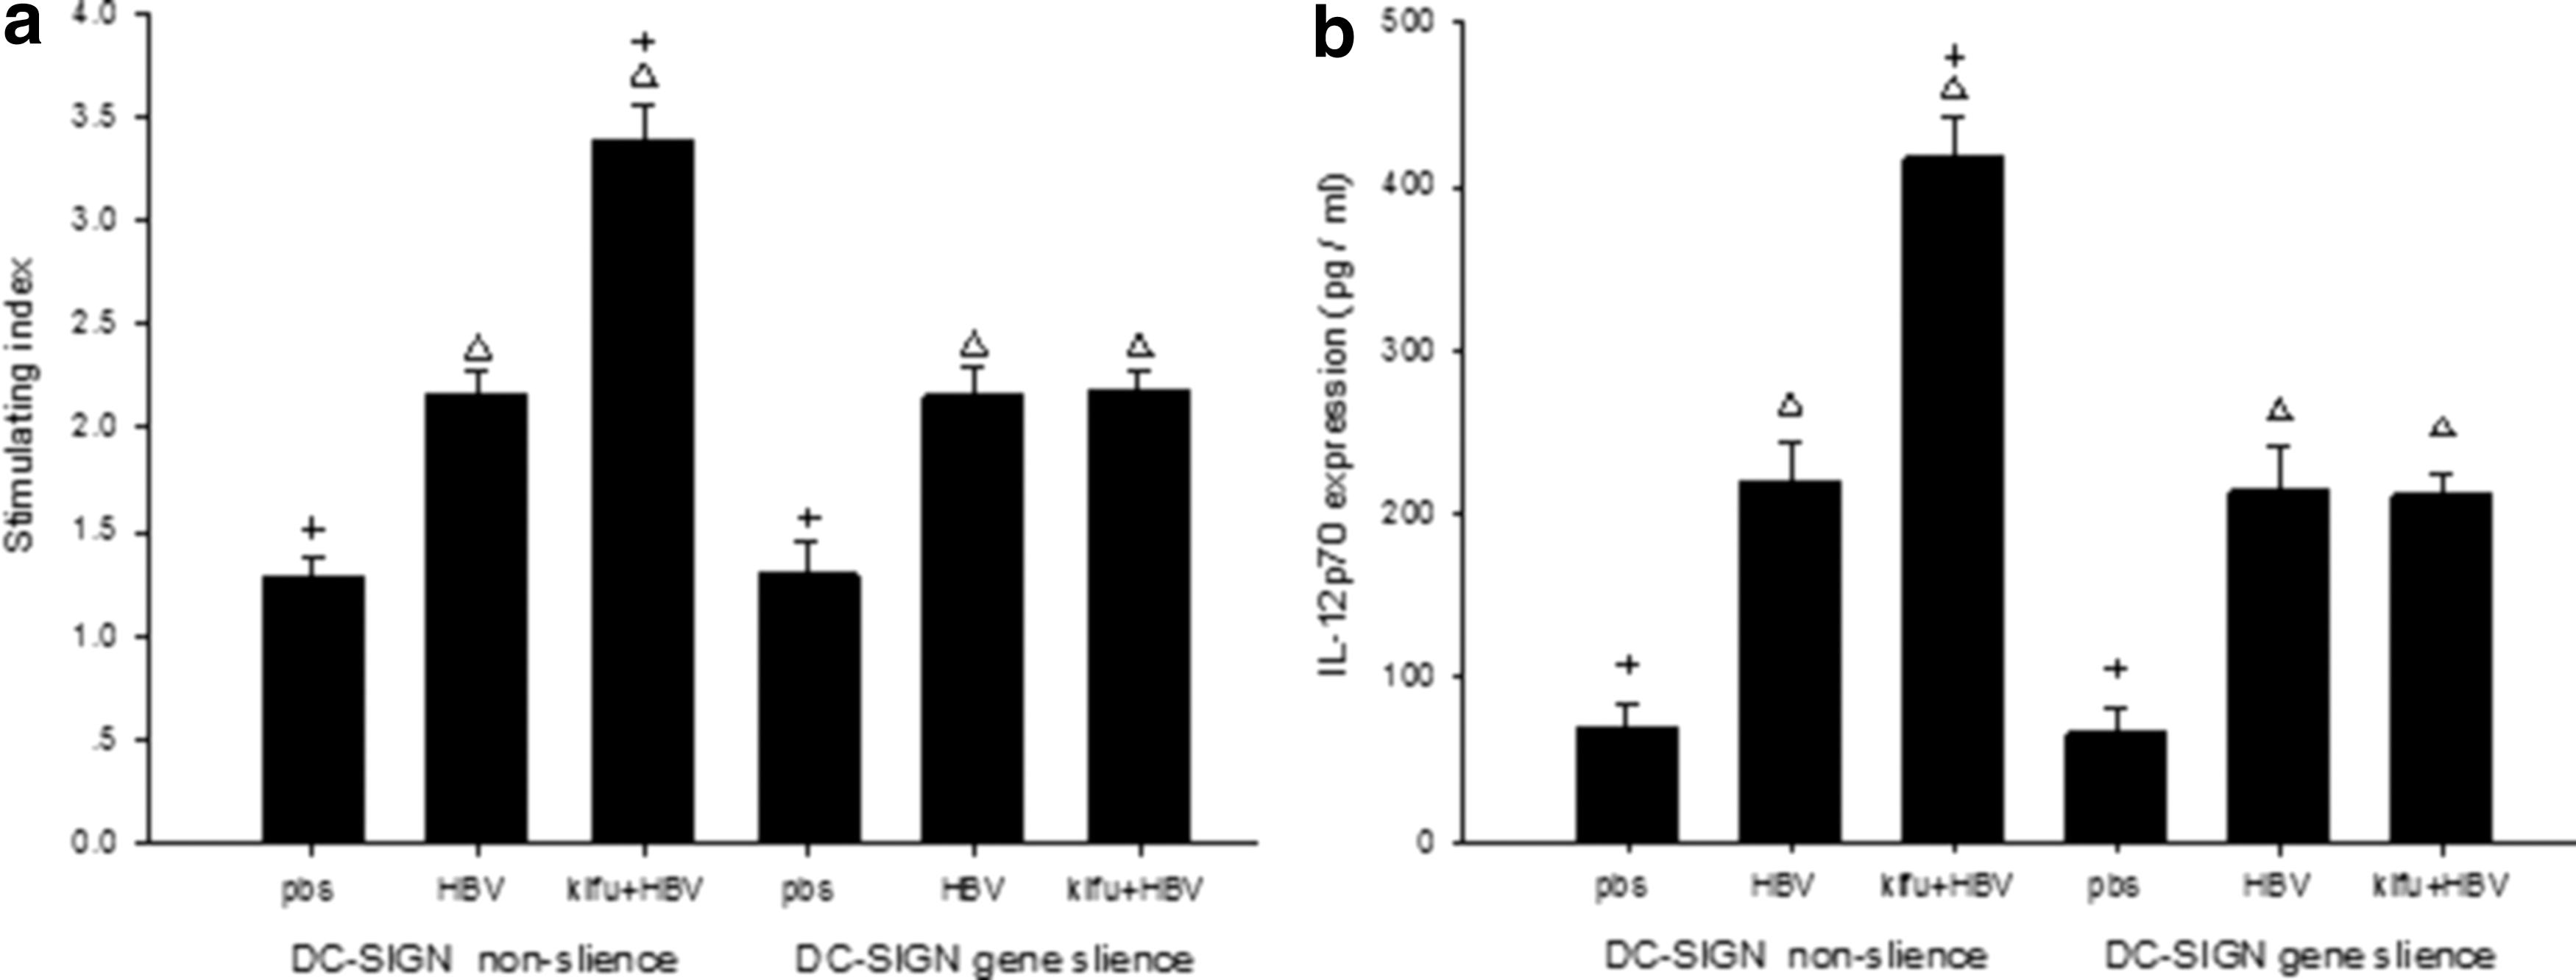
The influence of DC-SIGN gene silencing on the ability of DCs to stimulate T lymphocyte proliferation and secret cytokine IL-12p70 when infected with wild type and highly mannosylated hepatitis B virus (HBV). The same method as described in Table 4 was used to divide the DCs into six groups. (
CytokineIL-12p70 secretion
The method above was used to divide the DCs into six subgroups. The supernatant of the DCs was collected on day 7, and the cytokine level of IL-12p70 was monitored using ELISA. In the DC-SIGN nonsilencing subgroups, the cytokine level in the kifu+HBV subgroup was much higher than that in the HBV subgroup. However, in the DC-SIGN gene-silencing subgroups, the cytokine level between the HBV and kifu+HBV subgroups showed no statistically significant difference (Fig. 4b).
NF-κBp65 and p38 protein expression
The method above was used to divide the DCs into six subgroups. The preprocessed DCs were collected on day 7, and the expression of the NF-κBp65 and p38 proteins was detected with Western blot. In the DC-SIGN nonsilencing subgroups, the expression of NF-κBp65 and p38 in the kifu+HBV subgroup was much higher than that in the HBV subgroup. However, in the DC-SIGN gene-silencing subgroups, the expression between the HBV and kifu+HBV subgroups showed no statistically significant difference (Fig. 5).
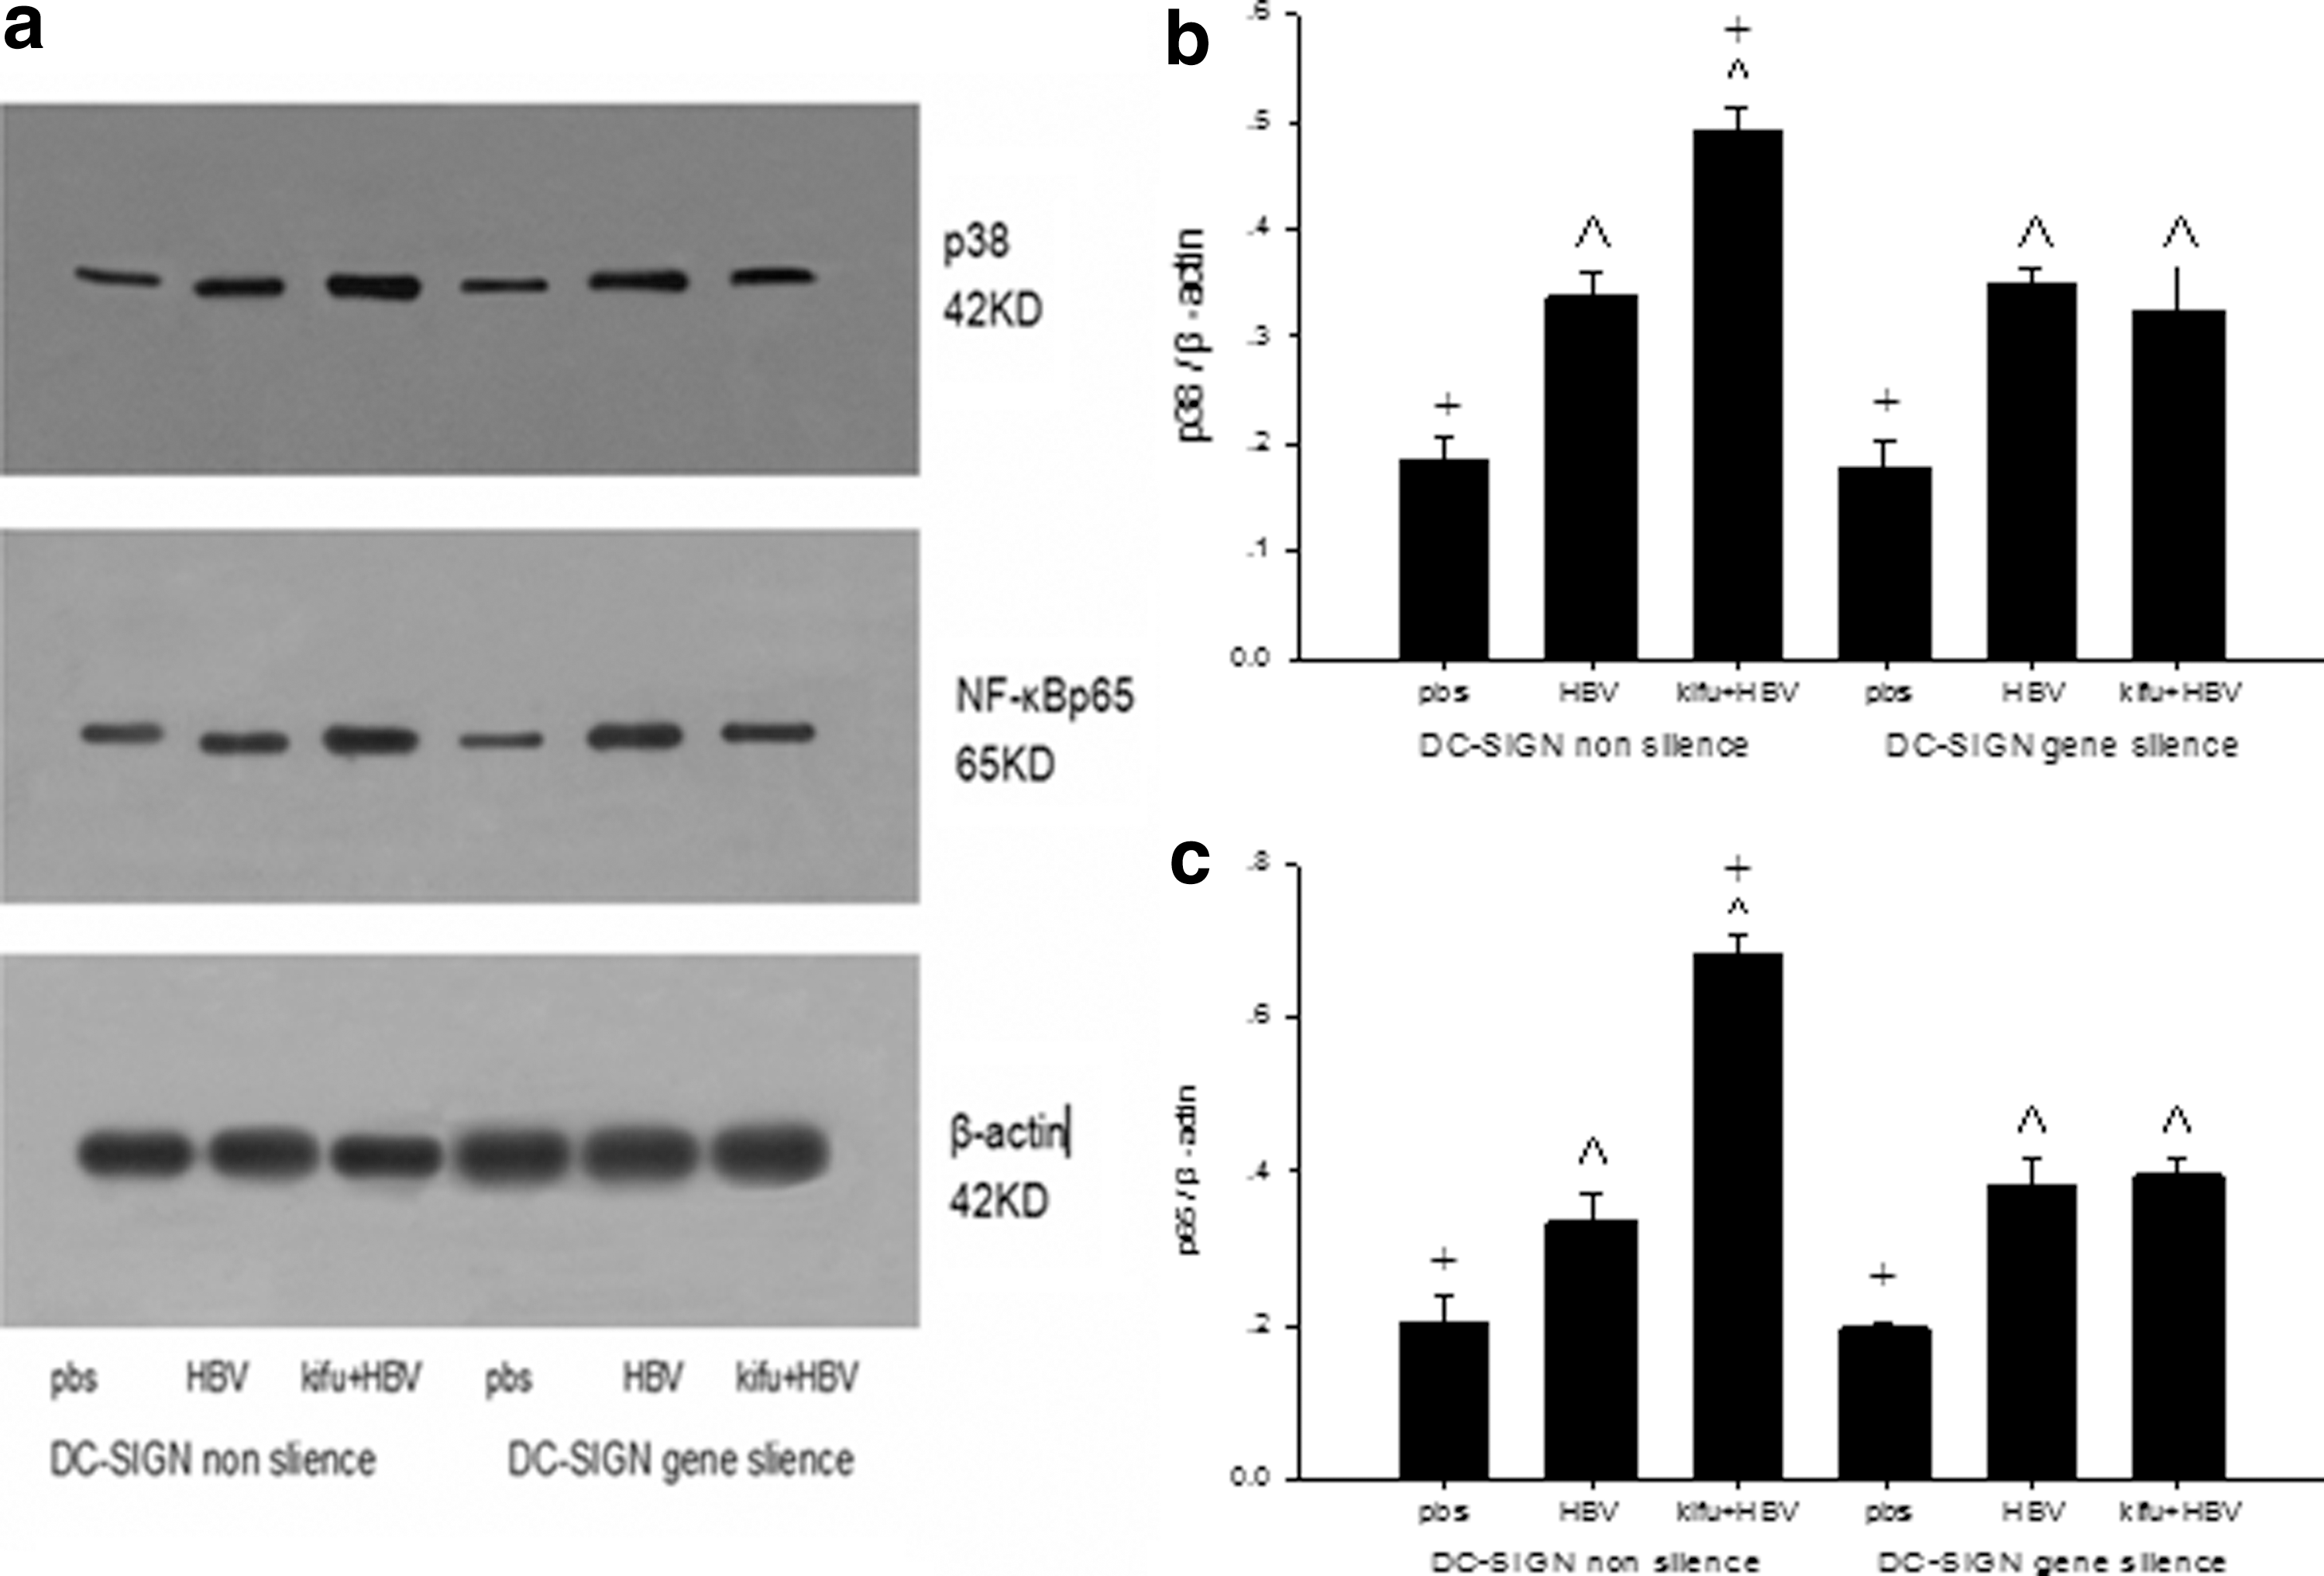
The influence of DC-SIGN gene silencing on NF-κBp65 and p38 protein expression of DCs when infected with wild type HBV and highly mannosylated HBV. The same method as described in Table 4 was used to divide the DCs into six groups. The DCs were harvested on day 7 for Western blot with the internal reference of GAPDH.
As shown in Table 4 and Figures 4 and 5, there were no significant differences among the second, fifth, and sixth subgroups. In other words, when DC-SIGN gene was not silenced, molecules expressing, the ability of DCs to stimulate T lymphocyte proliferation, secretion of the cytokineIL-12p70, and expression of the NF-κBp65 and p38 proteins in the highly mannosylated HBV subgroup were higher than those in the wild type HBV subgroup. However, when DC-SIGN gene was silenced, these indexes showed no marked differences between the wild type and the highly mannosylated HBV subgroup.
Discussion
DCs are important antigen-presenting cells that promote T cell activation and specifically activate CD4+ and CD8+ T cells. CD80 and CD86 are significant co-stimulatory molecules that are expressed by DCs, and their expression is correlated with the immune-activation ability of DCs. These two molecules, together with CD1a, CD83, and HLA-DR, are the most commonly used iconic surface-protein molecules to detect the maturation and functional activation of DCs. IL-10 is a broad-spectrum anti-inflammatory cytokine that inhibits DC maturation, suppresses the cellular immune response, and is related to antigen-specific immune tolerance. IL-12 is a type of pro-inflammatory factor that is produced by DCs after its activation and can promote naive CD4+T cells to differentiate into Th1 cells and restrain differentiation into Th2 cells.
It was recently found that the sugar chain in glycoprotein might take part in the processes of cell recognition and viral clearance. For example, mannose-binding lectin can combine with HBV directly by identifying the N-acetyl glucosamine and mannose sugar structure on the envelope of HBV, resulting in viral clearance (2,15). In addition, research suggests that the surface antigen entire deglycosylation of virus particles could affect the stability of the protein, change its space structure, and even cause the virion to lose its immunogenicity (10). The α-mannosidase in this study is an important protease participating in protein demannosylated modification. It specifically acts on the mannose alpha 1,2-glycosidic bond to clip mannose from N-glycan, causing the glycan to transform from highly mannosylated into a composite structure.
Kifunensine is a specific inhibitor of α-mannosidase. Kifunensine causes the accumulation of Man7–9GlcNAc2 oligosaccharides on glycoproteins by inhibiting mannose trimming in the endoplasmic reticulum (9). Therefore, the impact of kifunensine on HepG2.2.15 cells was used to inhibit HBV-demannosylated modification in order to obtain highly mannosylated HBV.
DC-SIGN, also called CD209, is a specific membranous protein on DCs. DC-SIGN subordinated in C-type lectin is a key link in immune regulation and has a bidirectional function. DC-SIGN can combine with a variety of carbohydrate antigen on pathogens, including mannose (6). It can mediate antigen internalization, induct T cell activation, and promote immune activation. However, DC-SIGN also can damage the function of DCs after combining with specific pathogenic microorganisms through certain mechanisms, leading to immunosuppression and immune evasion. There are rich mannose oligosaccharides on the HBV envelope (12). Because DC-SIGN mainly recognizes mannose- or fucose-containing carbohydrates, it is likely involved in HBV infection. Wild type HBV cannot combine with DC-SIGN. However, highly mannosylated HBV that is secreted by kifunensine-treated HepG2.2.15 cells could be recognized by DC-SIGN, as kifunensine can inhibit HBV from undergoing the chemical modification of removing mannose (9). However, the outcome of the interaction between HBV and DC-SIGN is still unknown
In order to study the role of DC-SIGN in maturation and activation of DCs after exposed to HBV, wild type HBV and highly mannosylated HBV were applied to DCs, respectively, to observe the mature and activate conditions of the cells. Compared with the blank control, both highly mannosylated HBV and wild type HBV could increase the expression of DCs surface molecules CDla, CD80, CD83, CD86, and HLA-DR to a certain extent, enhance the secretion of IL-12 of DCs, and enhance the capacity of DCs to stimulate lymphocyte proliferation. However, the promoting effect of the wild type HBV was significantly weaker than that of the highly mannosylated HBV.
These results suggest that wild type HBV may induce insufficient activation and maturation of DCs by escaping DC-SIGN recognition through demannosylated modification, leading to the foundation of immune escape and immune tolerance for HBV infection.
To prove this hypothesis, DC-SIGN was eliminated from the immune process by gene silencing. As expected, when the DC-SIGN gene was silenced, the immunological enhancement effect of the wild type HBV and highly mannosylated HBV on DCs was not obviously different. In other words, after DC-SIGN knockout from the reaction system, the differences in the immune activation to DCs between the wild type HBV and the highly mannosylated HBV disappeared. It was confirmed that DC-SIGN can promote DC maturation and activation after recognizing HBV, and wild type HBV can escape DC-SIGN recognition with the help of demannosylated modification. In other words, demannosylated modification may be one mechanism of HBV to escape from DC-SIGN recognition to achieve HBV immune tolerance, and α-mannosidase may be a key enzyme in DC-SIGN-mediated HBV immune tolerance.
In addition, when DC-SIGN was eliminated, both types of HBV could promote the activation and maturation of DCs to some extent compared with the blank control, indicating that there are other ways of recognizing HBV by DCs apart from DC-SIGN.
The findings from this study are helpful in clarifying the mechanism of HBV chronic infection, and make DC-SIGN and α-mannosidase potential new targets for anti-HBV immune therapy.
Footnotes
Acknowledgments
This research was supported by National Natural Science Foundation of China (81171559) and Natural Science Foundation of Hubei Province of China (2012FFB02402).
Author Disclosure Statement
No competing financial interests exist.