
Abstract
Immunodominant T cell responses are important for protection against virus challenge. However, studies screening for the immunodominant T cell responses and following their kinetics in acute Hantaan virus (HTNV) infection are very limited. Herein, the HTNV nucleocapsid protein-specific T cell responses were longitudinally screened in 15 patients with acute HTNV infection, eight of whom had a particularly severe hemorrhagic fever with renal syndrome (HFRS). An extremely impaired IFN-γ–producing T cell response was observed in patients with severe HFRS at the early stage of infection, especially to the immunodominant epitopes detected in the mild to moderate group, namely peptides N127–141, N139–153, N241–255, and N355–369. The initially insufficient T cell response to the immunodominant epitopes may play a role in influencing the severity of HTNV infection. These findings provide information that may aid the design of future vaccines against hantaviruses.
Introduction
H
Despite the long history of hantavirus epidemic in humans as a public health threat, knowledge of the human immune response directed against this virus is very limited. Cytotoxicity against hantavirus antigens, including nucleocapsid protein and Gn/Gc glycoproteins, had been visualized after in vitro stimulation by the virus (13,14). Among these antigens, the most conserved nucleocapsid protein deserves attention. Nucleocapsid protein is more frequently recognized by human T cells than Gn or Gc (13,14) and can induce efficient protection against virus challenge in murine models (2,3). The protective immune responses elicited by the nucleocapsid protein are thought to be mainly cellular, since nucleocapsid-specific antibodies are neither neutralizing nor protective. In HFRS, most epitopes identified to date are on the nucleocapsid protein of HTNV and Puumala virus (PUUV) (5,7,13,14,17). Therefore, nucleocapsid protein seems an attractive target of hantavirus-specific immunotherapy.
Evidence suggests that, after virus challenge, the immunodominant T cell populations are the most protective. Although HTNV has been studied for decades, few epitopes have been identified (5,7,13,17), and it is not known whether they are immunodominant or subdominant. Furthermore, longitudinal analysis of how host T cell immunity develops, provides protection or causes disease, and eventually generates long-lasting memory would be important to reveal the role of T cells in HFRS, but little is known about these in hantavirus infection (6,11). This study focused on the kinetics of immunodominant T cell responses to HTNV nucleocapsid protein, the highly conserved and immunodominant protein of hantavirus. It was found that the four most frequently recognized epitopes were immunodominant throughout the mild to moderate HTNV infection. In contrast, at the early stage of severe HFRS, the initial responses were very weak, and none of the four epitopes was dominant, though subsequently these epitopes also became immunodominant. The results indicate that the dominant T cell responses may be a key factor at the early stage of infection in influencing the severity of HTNV infection.
Patients and Methods
Subjects
Fifteen patients (13 male; age 22–68 years) with acute HTNV infections were enrolled at the Tangdu Hospital of the Fourth Military Medical University, Xi'an, China. Clinical diagnosis of HFRS was confirmed by serological detection of immunoglobulin M (IgM) antibodies against HTNV. HFRS disease severity was classified as previously described (16). Patients who had a mild to moderate course of HFRS with mild or obvious symptoms of uremia, effusion, hemorrhage, and kidney injury with or without typical oliguric stage were assigned to the mild to moderate group, while patients with severe to extremely severe or critical HFRS with severe uremia, effusion, hemorrhage, and renal failure with oliguria or anuria, or accompanied with other severe complications such as heart failure, pulmonary edema, brain edema, and severe secondary infection were assigned to the severe group. This study was approved by the Ethics Committee of Lanzhou General Hospital and the Institutional Review Board of the Fourth Military Medical University, and all subjects gave written, informed consent.
Peripheral blood mononuclear cell samples
Peripheral blood mononuclear cells (PBMCs) were isolated by centrifugation of heparinized venous blood on Ficoll-Hypaque density gradient (TBD Science). The interphase cells were thereafter harvested, washed, and cryopreserved using a controlled freezing container (Nalgene) and stored in liquid nitrogen until use.
Synthetic peptides
For screening responses, a peptide library consisting of 70 15-mer peptides overlapping by nine residues and covering the nucleocapsid protein of the HTNV strain 76–118 (available from GenBank under accession no. M14626) was purchased from CL Bio-scientific. Individual peptides were dissolved in DMSO (Sigma-Aldrich) and admixed with phosphate buffer (pH 7.4). The 70 15-mer peptides were pooled in 10 mixtures, each containing seven synthetic peptides.
IFN-γ enzyme-linked immunospot assay
Enzyme-linked immunospot (ELISPOT) assay was performed upon overnight stimulation of PBMCs with peptides or peptide pools using the human IFN-γ ELISPOT kit (Mabtech) as described previously (16). In brief, PBMCs thawed and rested overnight were added to 96-well PVDF plates (Millipore) precoated with an IFN-γ capture mAb (1-D1K), and stimulated with overlapping 15-mer peptides covering the nucleocapsid protein, initially with pools of seven overlapping peptides, and then, if positive, with single 15-mer peptides. After overnight stimulation, biotinylated IFN-γ detection mAb (7-B6-1), streptavidin-conjugated alkaline phosphatase, and its substrate BCIP-NBT (Sigma-Aldrich) were used to develop the IFN-γ spots. The number of specific IFN-γ–secreting cells was calculated by subtracting the number of spots in unstimulated controls from that in the stimulated samples. Positive controls consisted of PBMCs stimulated with PHA at 10 μg/mL (Sigma-Aldrich). Wells were considered positive if a minimum of five spots were present in the well and if they yielded values two or more times above background (12,14). To determine whether the responding T cells were CD4+ or CD8+, in the second ELISPOT assay cell depletion with CD4 or CD8 Dynabeads (Invitrogen) was performed, as described in the manufacturer's instructions, before ELISPOT assay. Undepleted PBMCs served as positive control.
Statistical analysis
Nonparametric Mann–Whitney U-test and Spearman's rank correlation test were performed using PASW Statistics 18 for Windows (SPSS). p-Values of <0.05 were considered significant.
Results
Antigenic specificity of T cell responses in patients with acute HTNV infection
The virus-specific T cell response during acute HTNV infection has not been well characterized on epitope levels due to the limitations of predictive algorithms and numbers of epitopes identified. The repertoire of the HTNV-specific T cells was therefore analyzed in 15 patients with acute HTNV infection: seven patients (patients M1–7) with a mild or moderate clinical course of HFRS (hereinafter referred to as the mild to moderate group), and eight patients (patients S1–8) with a severe to extremely severe or critical course of HFRS (referred to as the severe group). Clinical characteristics of the patients are summarized in Table 1.
Data are median (IQR) or number (%).
HFRS, hemorrhagic fever with renal syndrome.
PBMCs of 15 patients with HFRS were tested by direct ex vivo ELISPOT assay using a panel of peptides overlapping by nine residues and spanning the HTNV nucleocapsid protein, pooled in 10 mixtures of seven peptides each. The pools that were able to stimulate ELISPOT responses were then screened with individual component peptides to reduce the usage of samples. Of the 70 synthetic peptides tested, 23 (33%) were recognized by T cells in the cohort (Fig. 1). The frequency of detection and the magnitude of responses were highly variable between peptides. Although the majority of the peptides were only recognized by one patient, some were targeted by several individuals. The most frequently detected specificity in the cohort—N127–141 (TSFVVPILLKALYML)—was recognized by nearly half of the patients (Fig. 1A). An additional three peptides—N139–153 (YMLTTRGRQTTKDNK), N241–255 (IEPCKLLPDTAAVSL), and N355–369 (LRKKSSFYQSYLRRT)—were each targeted in ≥20% of patients. But unfortunately, no single epitope was overwhelmingly dominant, possibly due to the mixed HLA backgrounds in the cohort (data not shown). It is interesting, moreover, that most epitopes were located in the more conserved regions of the nucleocapsid protein across the Hantavirus genus (8). This information may be useful for the development of subunit vaccines to induce cross-reactive immunity.
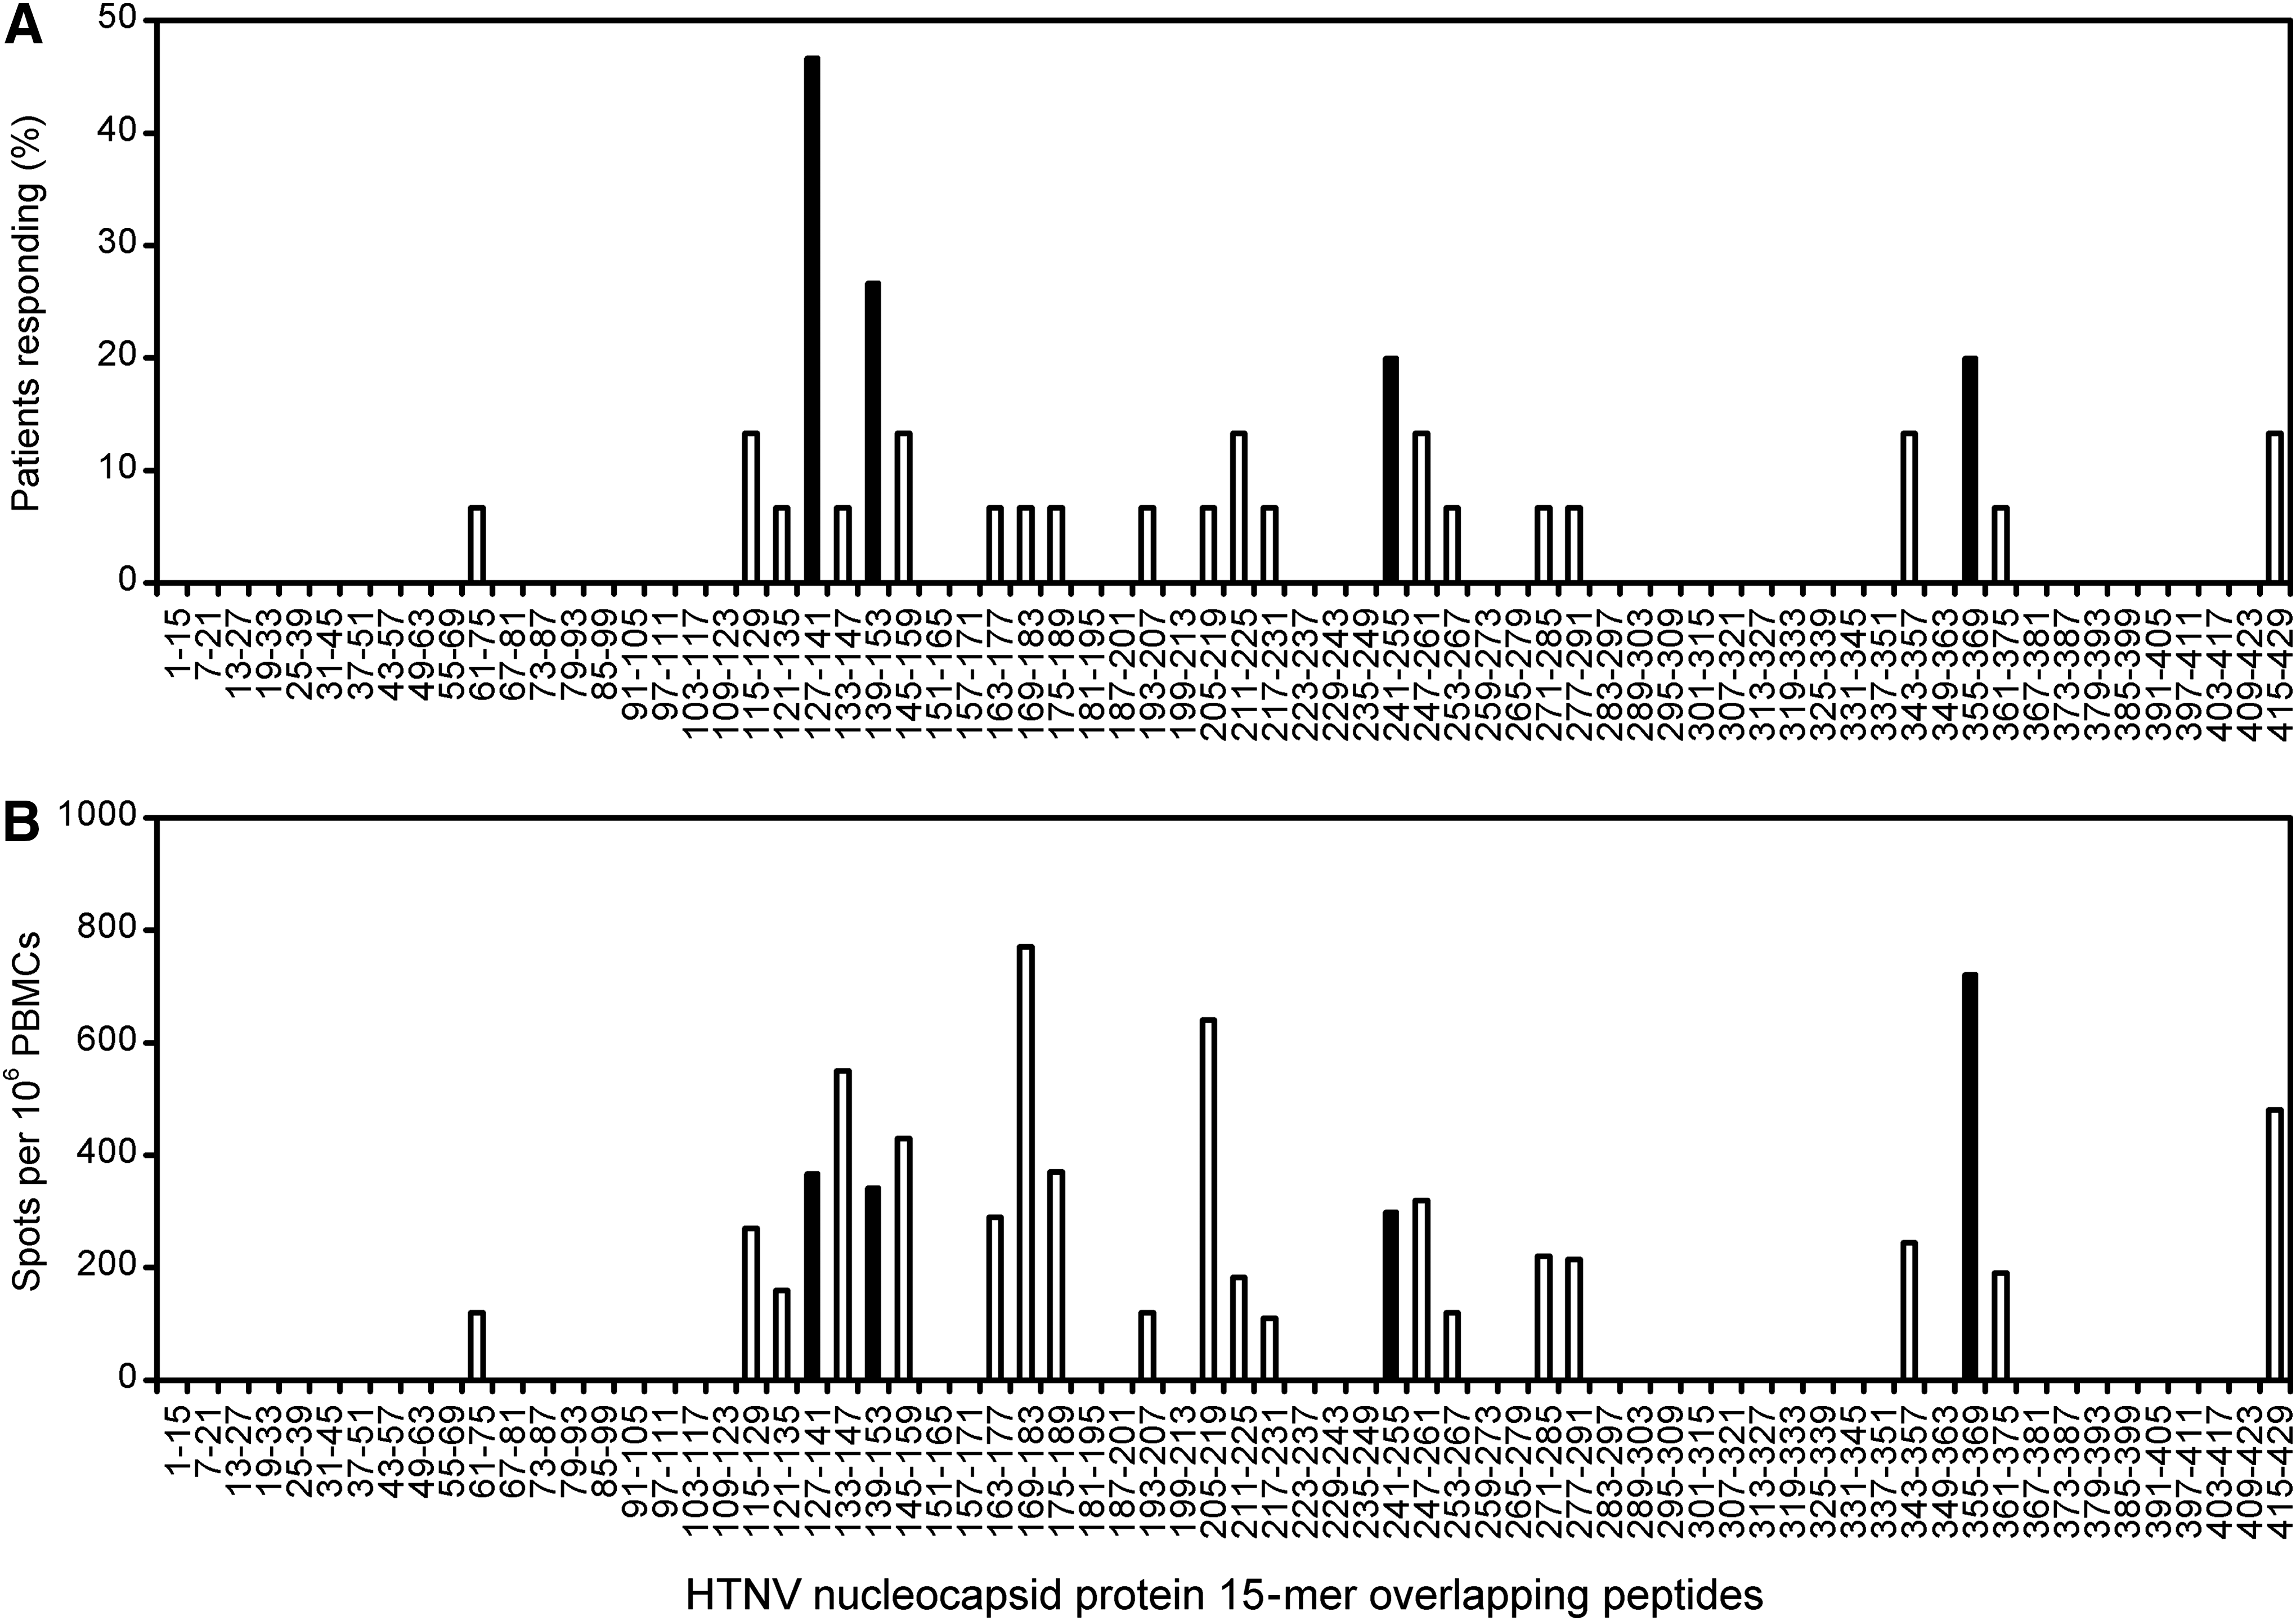
Frequency of detection of single peptides and magnitude of T cell responses to the nucleocapsid protein during acute Hantaan virus (HTNV) infection. Peripheral blood mononuclear cells (PBMCs) from patients with acute HTNV infection were tested for IFN-γ production, initially with pools of seven overlapping peptides, and then, if positive, with single 15-mer peptides. The individual 70 overlapping peptides of nucleocapsid protein are represented on the x-axis. (
Magnitude of virus-specific T cell responses was dependent on the duration of illness in severe acute HTNV infection
Analyzing the ELISPOT data from PBMCs in acute HTNV infection, a significant correlation was found between the frequencies of HTNV epitope-specific T cells and the time elapsed between symptom onset and sampling of blood in patients with a severe course of HFRS (r=0.527, p<0.001; Fig. 2A). The weak virus-specific T cell response observed early in patients with severe illness was followed by a rapid restoration, in some patients reaching nearly 1,140 reactive cells per million PBMCs.
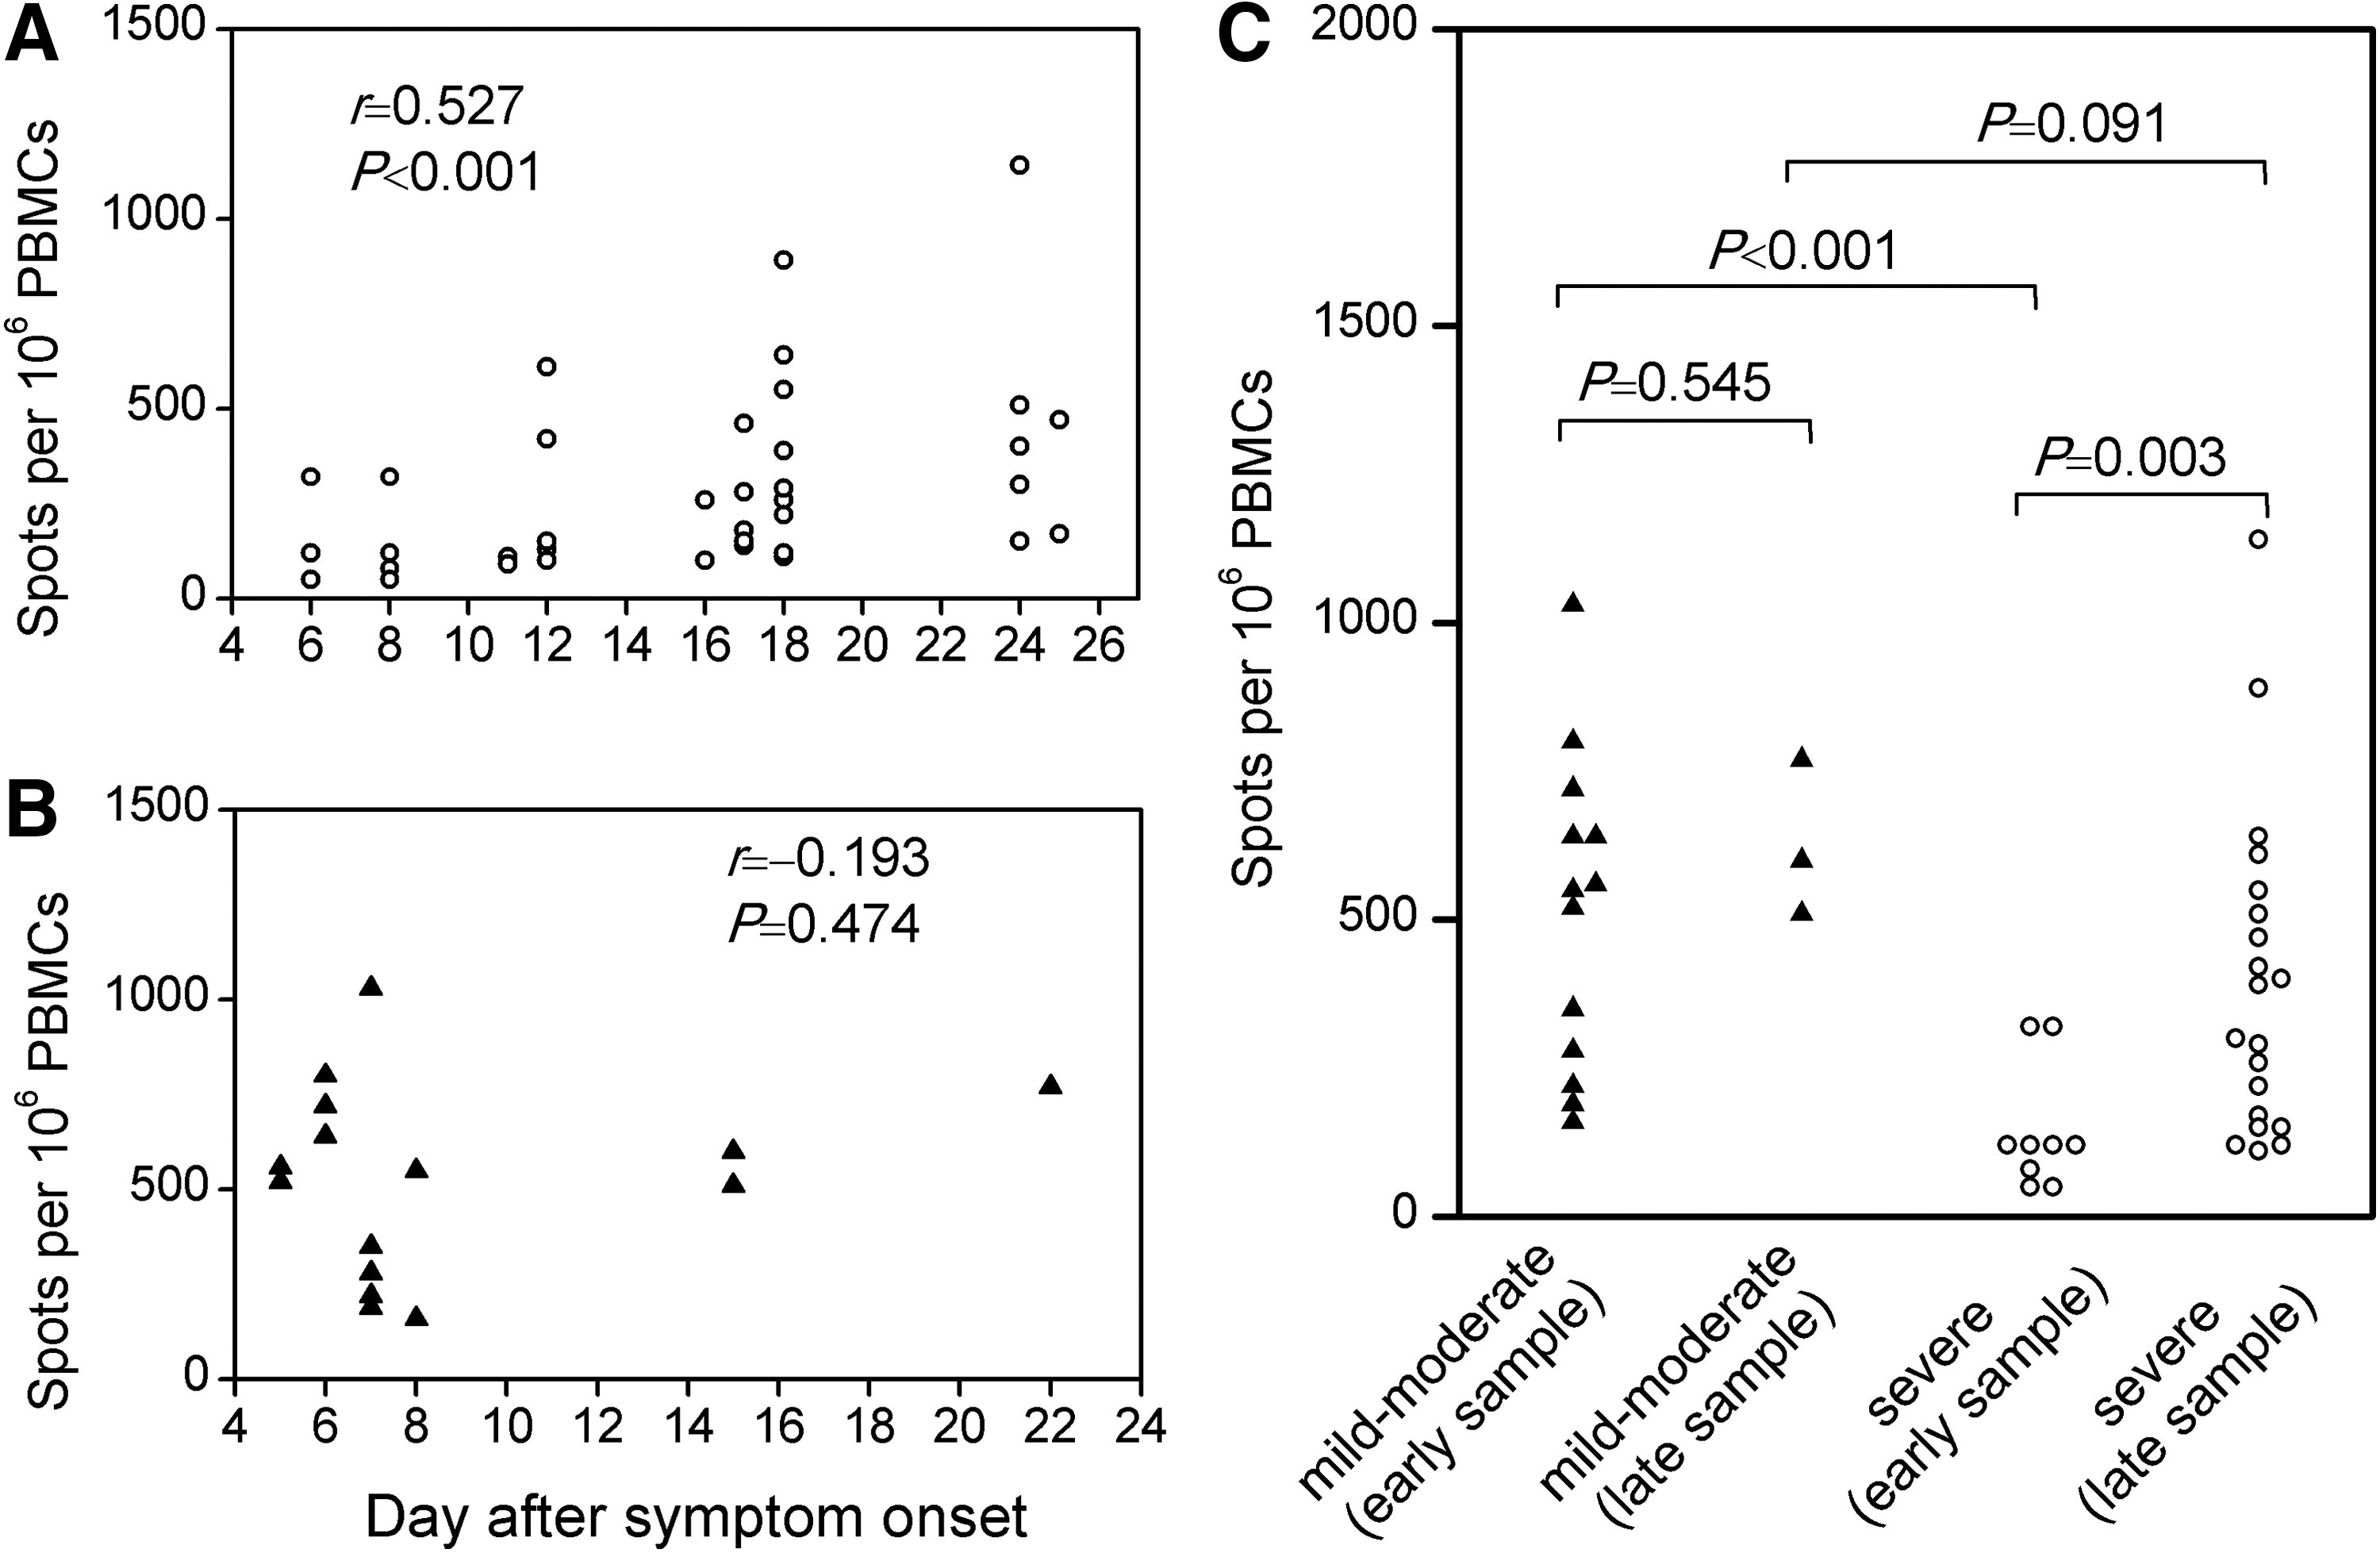
Time dependency of magnitude of virus-specific T cell responses in patients with acute HTNV infection. The frequency of HTNV-specific T cells by IFN-γ ELISPOT assay was plotted against the time elapsed between onset of symptoms and sampling of blood for each assay, depicted separately for patients with a severe course (
In contrast, for patients with a mild to moderate course of HFRS, no such correlation was observed, and the frequencies of HTNV-specific T cells remained stable (Fig. 2B). Interestingly, when analysis was restricted to subjects with first available blood sample collected at early stage of infection (5–8 days after fever onset), which would be closest to the magnitude of early T cell immunity, the strong HTNV-specific T cell responses in patients with mild to moderate HFRS were in stark contrast to the weak responses in patients with severe disease (p<0.001; Fig. 2C). However, these differences became non-significant during the late stages.
Virus-specific dominant T cell responses were impaired early in severe acute HTNV infection
Next, the study sought to characterize the HTNV-specific T cell responses associated with severe pathology in acute HTNV infection on a single epitope level. Analysis of the frequency of virus-specific T cells showed that the hierarchy of epitope recognition varied from patient to patient, with different epitope-specific populations dominating in different individuals (Fig. 3A). The dominant responses were therefore compared in patients with severe versus mild to moderate HFRS, defined as the peptide that induced the strongest IFN-γ response in each patient as measured by ELISPOT. Unexpectedly, in each mild to moderate patient who had PBMC samples available at the early stage (5–8 days after fever onset), the numerically prominent or immunodominant T cell populations were often found to be focused on either one or two of the most frequently recognized epitopes, namely peptides N127–141, N139–153, N241–255, and N355–369 (Fig. 3A). These peptides were therefore defined as the dominant epitopes. In contrast, although the dominant epitopes were also frequently detected in severe group (7 of 8 or 75% of patients), the initial response against these peptides was usually the weakest (Fig. 3A). The epitope dominance hierarchy found in mild to moderate patients was absent in severe patients, with all subjects showing an immunodominant yet weak response to either subdominant or nondominant peptides. Remarkably, the frequencies of the IFN-γ–producing T cells specific for the dominant epitopes were roughly tenfold higher in patients with mild to moderate HFRS (550–1,030 spots per million PBMCs) than in those with severe disease (50–120 spots per million PBMCs).
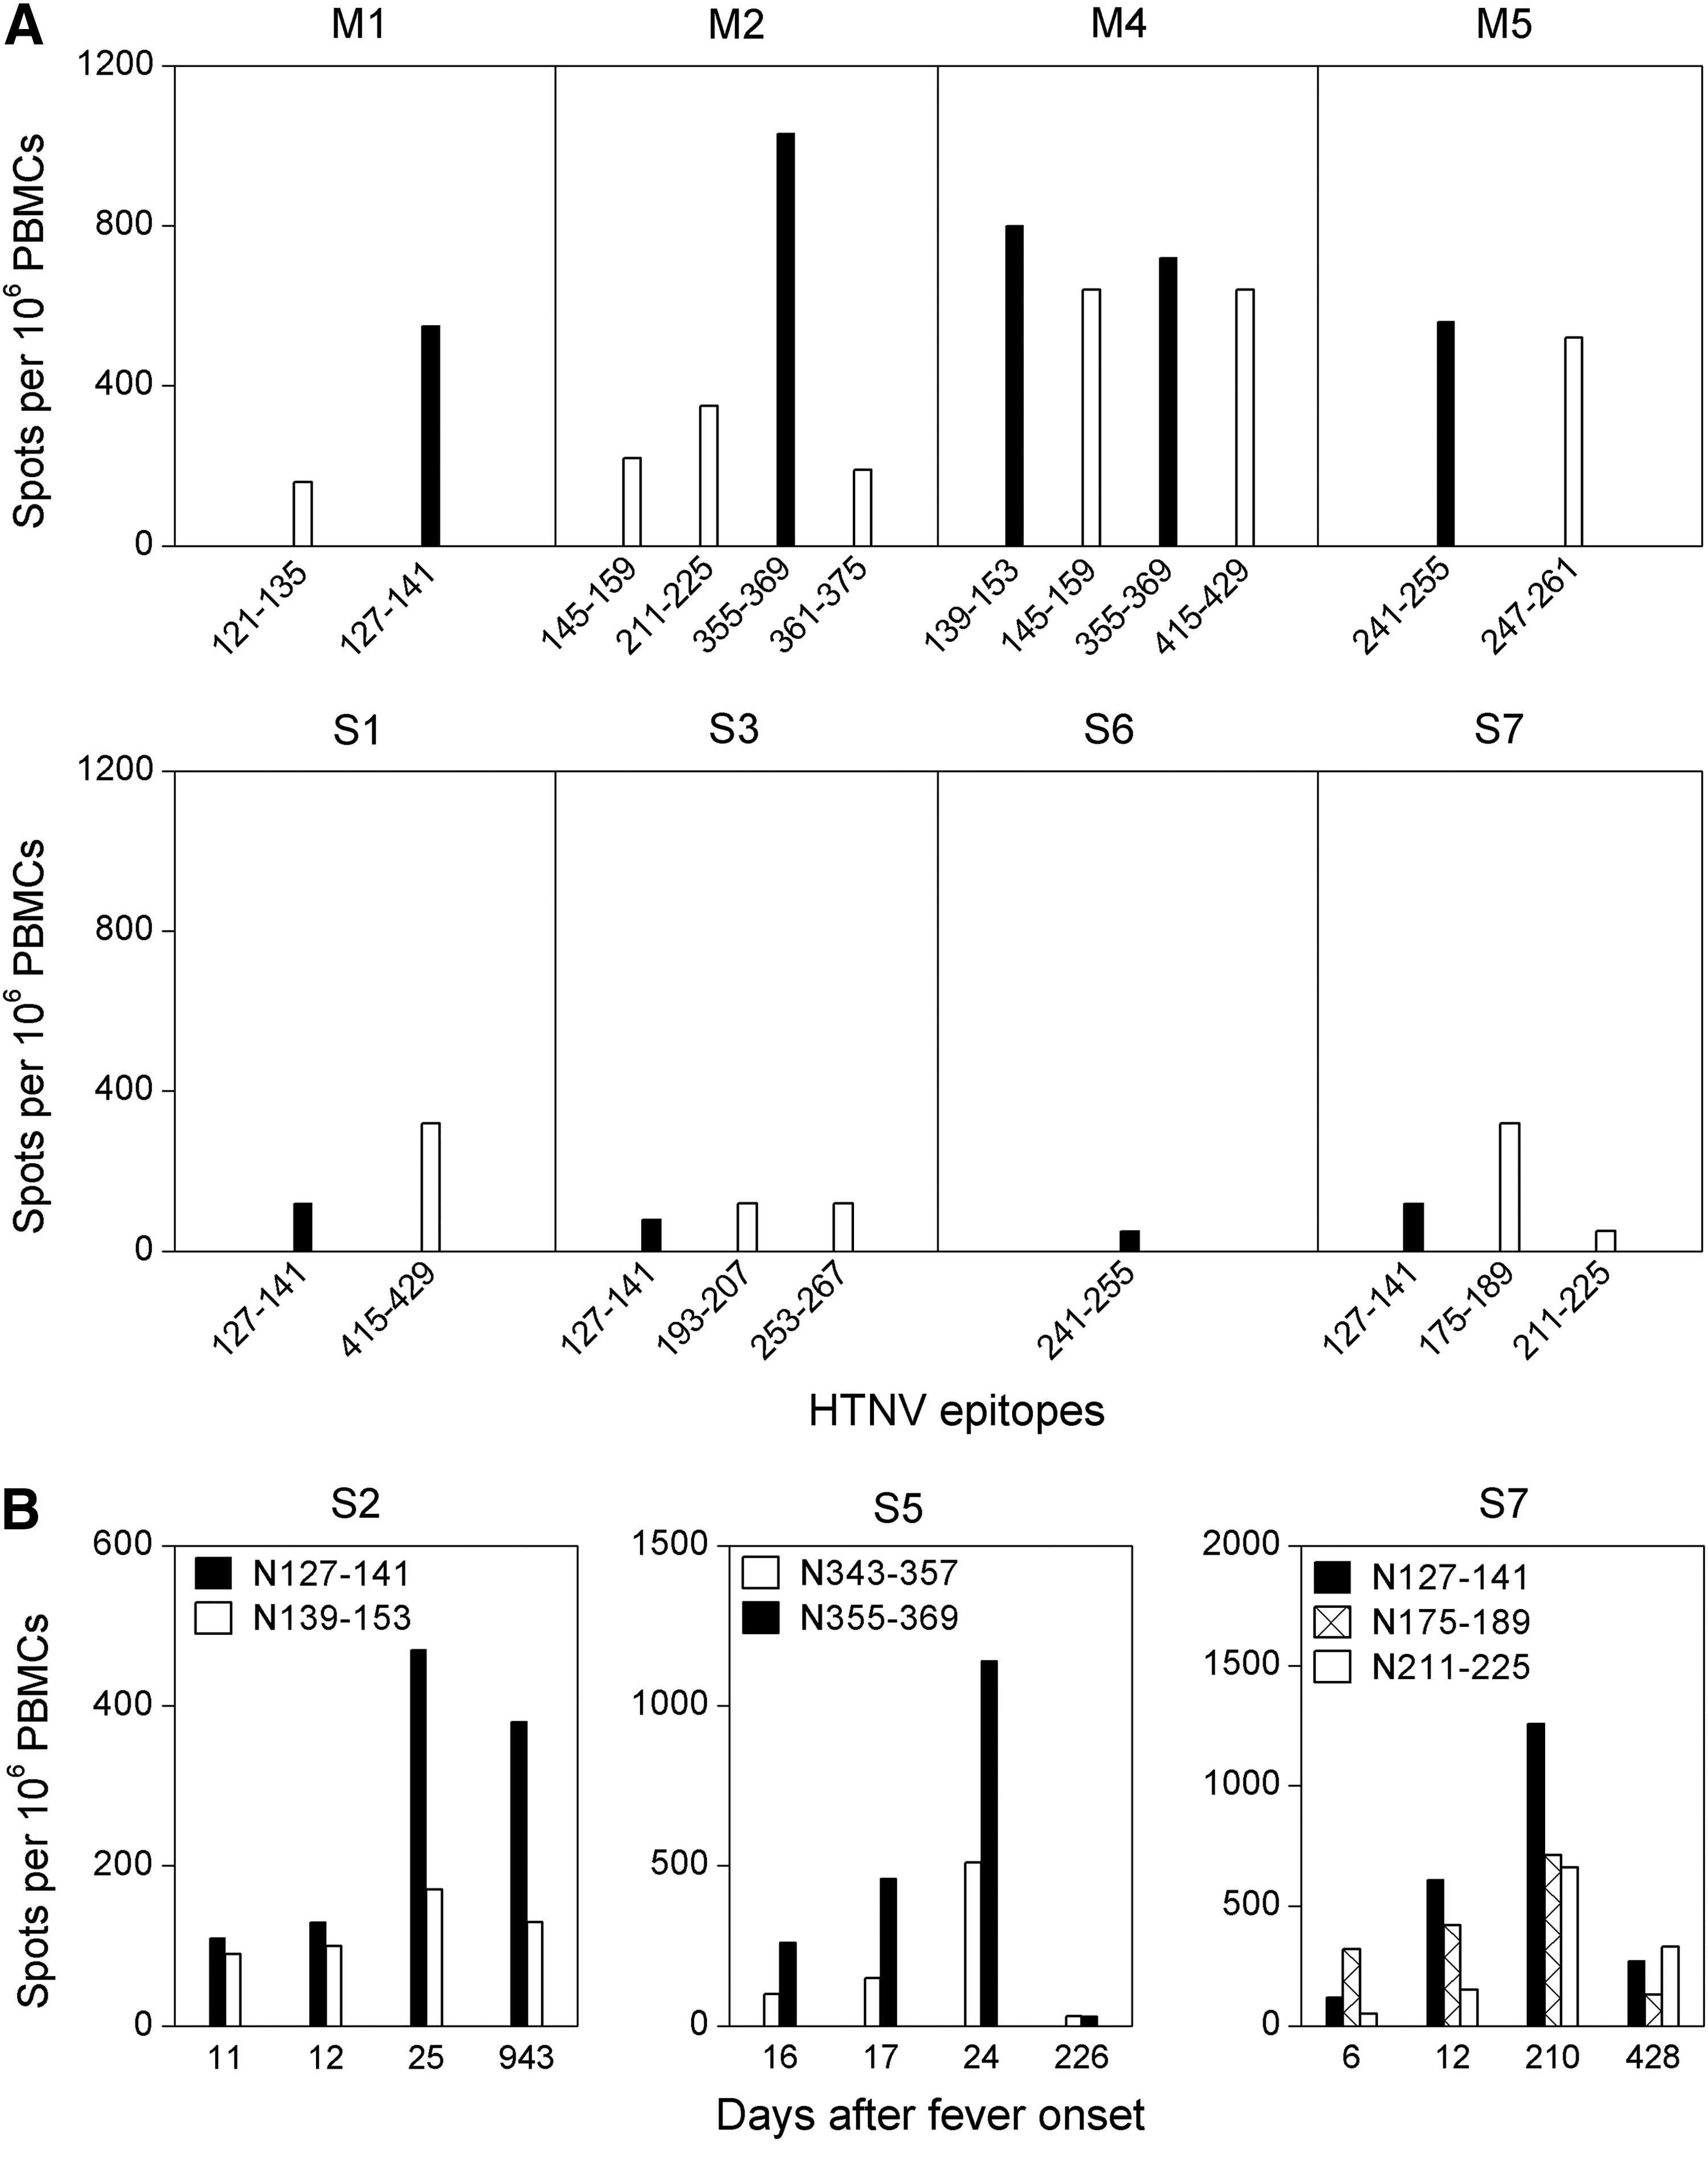
Immunodominant T cell responses during and after acute HTNV infection. (
Early impaired virus-specific dominant T cells preferentially restored in the late stages of severe acute HTNV infection
At the late stages of acute HTNV infection, the magnitude of the individual responses in patients with severe HFRS was nearly comparable to that found in mild to moderate patients (Fig. 2C). In patients who had a severe course of HFRS and had serial PBMCs available, a consistent increase in frequencies of virus-specific IFN-γ–producing T cells was observed at the late stages, and the strongest immunodominant response was found to be induced by one of the four dominant epitopes, with a hierarchy similar to that detected in the mild to moderate patients (Fig. 3B), indicating that the early impaired T cell immunity in patients with severe HFRS, especially to the dominant epitopes, was restored at the late stages of acute infection.
Virus-specific memory T cells lasted after the acute HTNV infection
Subsequently, after acute HTNV infection, the hierarchy of the dominant responses acquired in the acute phase of infection was not maintained in some patients, and a consistent decrease in the magnitude of IFN-γ–producing T cells occurred, though the magnitude, timing, and pattern of responses varied between patients (Fig. 3B, and data not shown). Furthermore, both CD4+ and CD8+ T cell responses were detected after recovery, and the CD8+ response predominated over CD4 in terms of frequency of detection (p=0.013) and magnitude of the response (p<0.001; Fig. 4A and B). The frequencies of CD8+ T cells strongly correlated with those of the total T cell responses (r=0.802, p<0.001; Fig. 4C), suggesting that CD8+ T cells are the predominant population in the memory T cell repertoire.
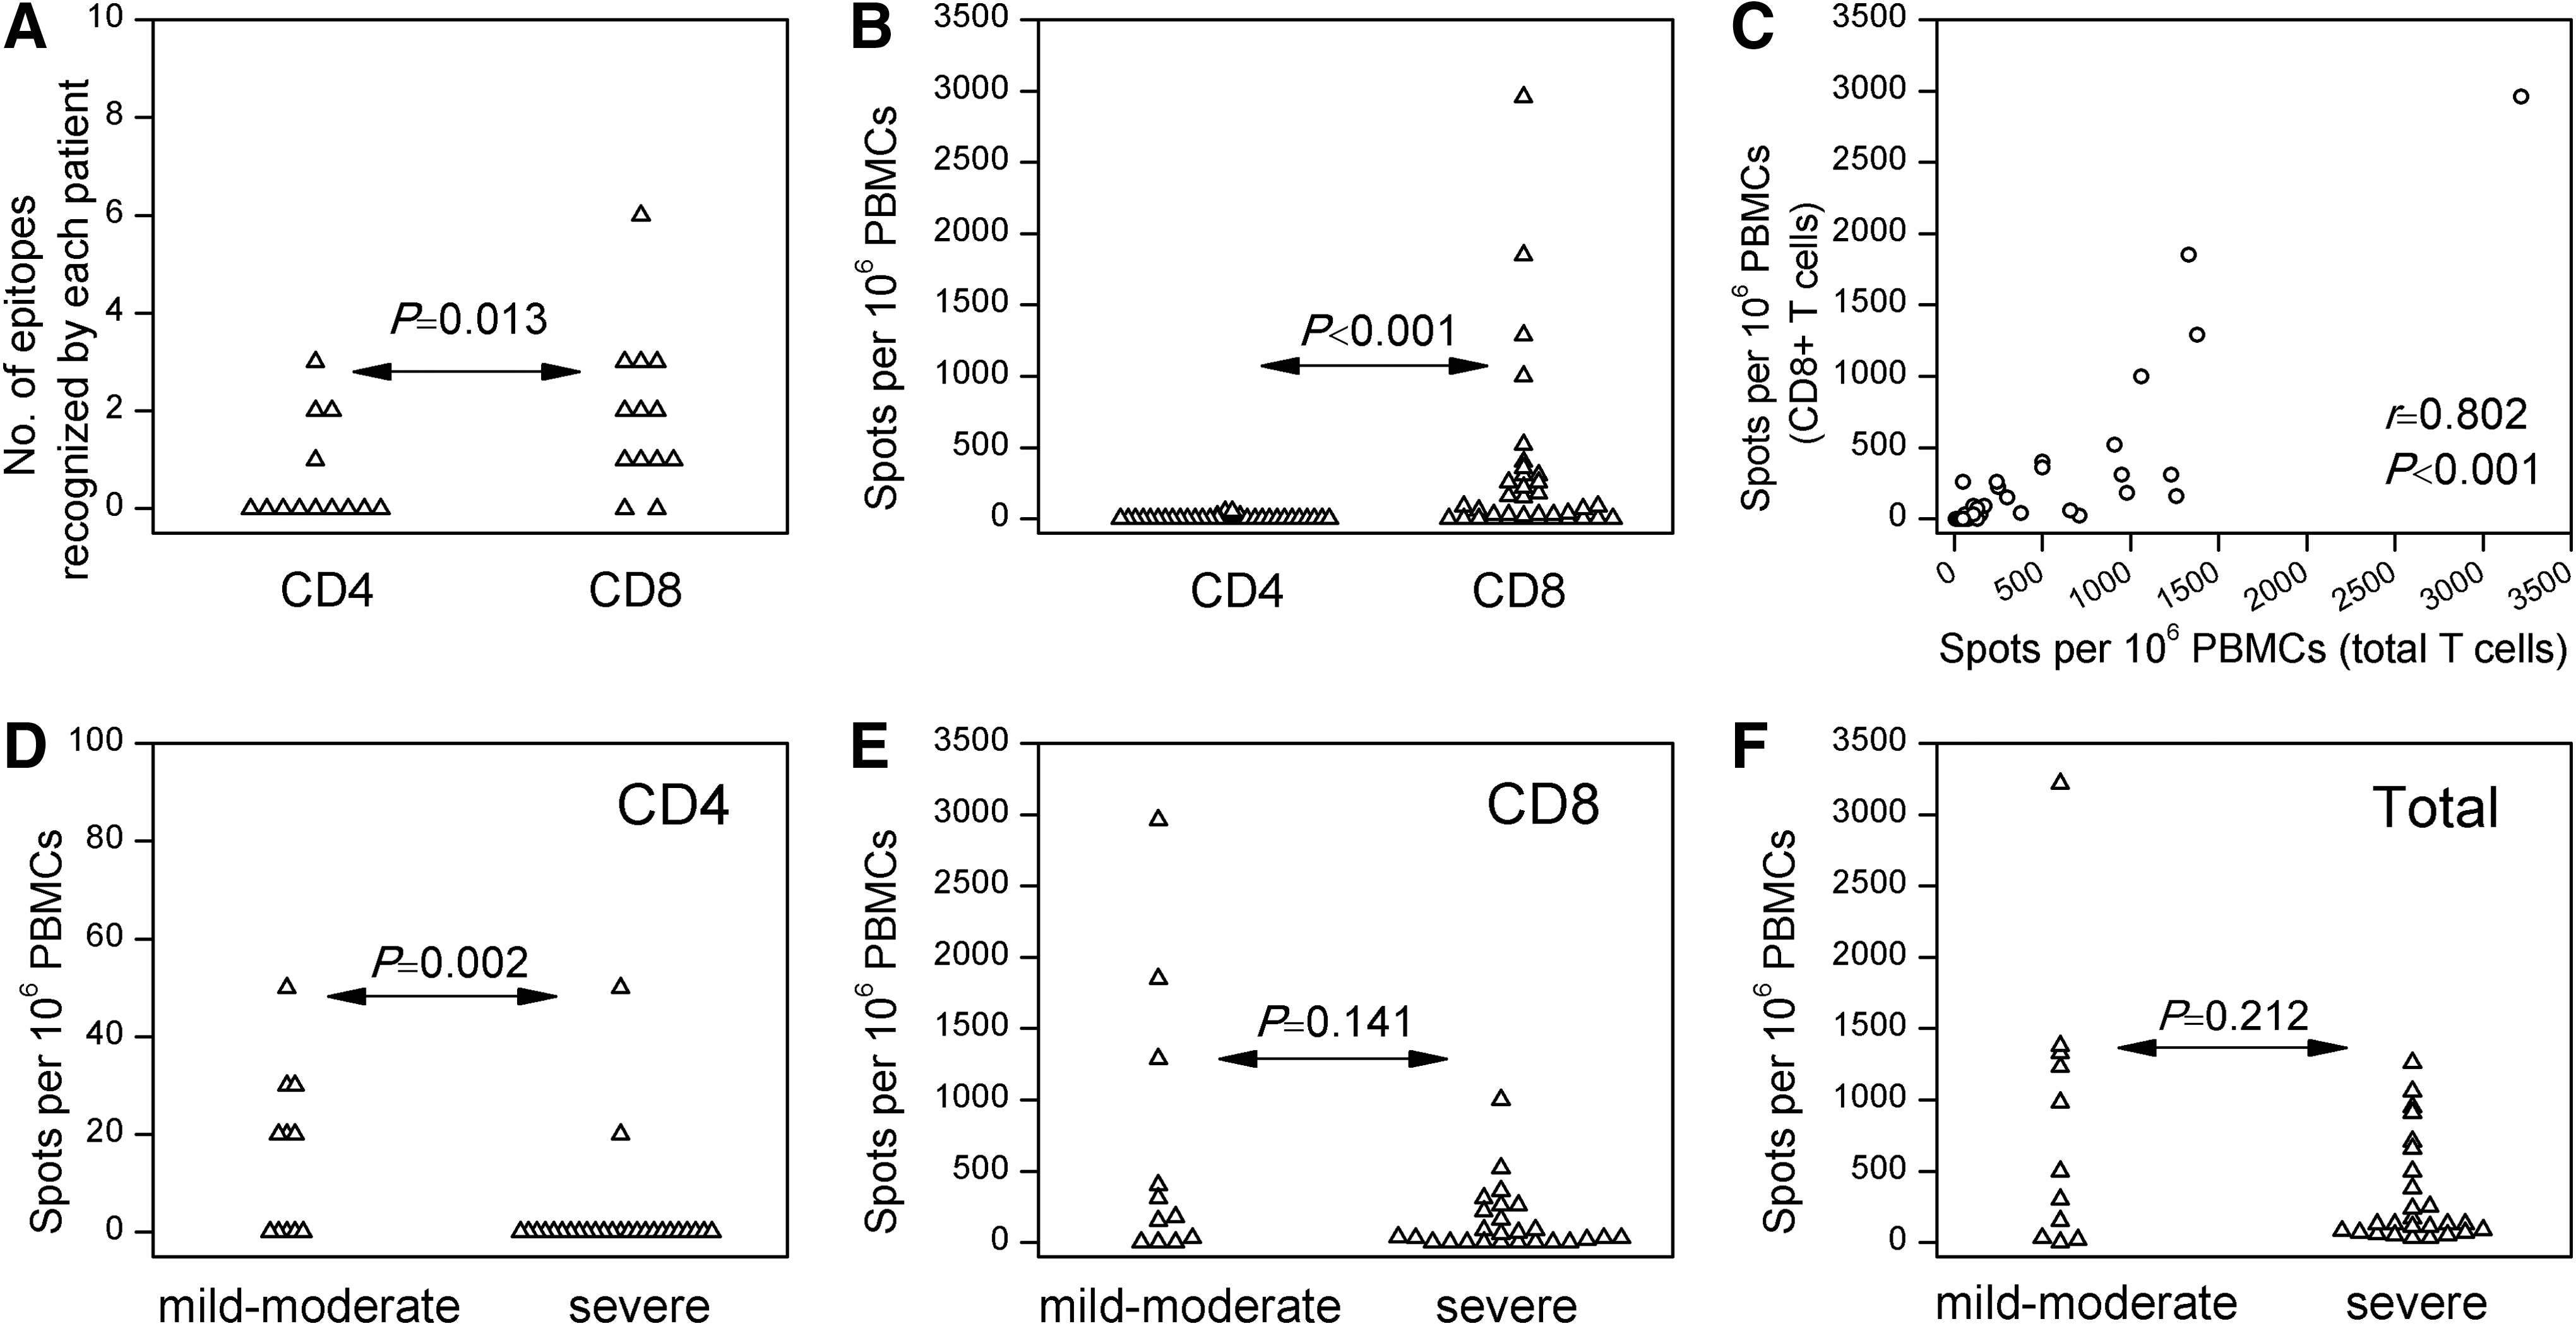
CD4+ and CD8+ T cell responses in recovered samples of hemorrhagic fever with renal syndrome. The number of epitopes recognized by each subject (
Next, the study investigated whether there was any association between disease severity and memory T cell responses. The mild to moderate HFRS patients had significantly stronger memory CD4+ T cell responses (p=0.002; Fig. 4D). However, few were detectable. In contrast, there was no difference in the CD8+ T cell responses or the total T cell responses (Fig. 4E and F), making it unlikely that the memory T cell immunity varied with disease severity.
Discussion
Despite decades of research, the role of virus-specific T cells in the control of hantavirus infection has remained controversial (10). In the present study, the kinetics of HTNV-specific T cell responses were characterized in a cohort with acute HTNV infection and with a mixed HLA background. The first finding is that in patients with severe HFRS, the kinetics of the T cell response during acute HTNV infection were distinct from those in patients with mild to moderate disease. In severe HTNV infection, the magnitude of the response was tightly correlated to the time elapsed after symptom onset, as responses became vigorous within weeks (Fig. 2). In contrast, the HTNV-specific T cell response in mild to moderate patients remained stable over time. Similarly, during the acute phase of PUUV hantavirus infection, a consistent increase in frequencies of the PUUV epitope-specific IFN-γ–producing T cells was also observed in four of nine (44%) patients (11). During acute infection by Sin Nombre virus—another member of hantavirus causing a fulminant life-threatening illness known as hantavirus cardiopulmonary syndrome—tetramer staining also showed an early increase in frequencies of virus-specific CD8+ T cells (4). Interestingly, in a murine model of transient infection, virus-specific T cells were undetectable 3 days after HTNV inoculation, but then increased rapidly with a peak at day 10–12 post-infection (1,9). In contrast, in persistent infection, almost no IFN-γ–producing T cells were detected, even at 30 days. Taken together with the incubation period of human hantavirus infection, it seems possible that at the earliest stage of infection, before patients were hospitalized, virus-specific T cells had been generated and had mounted a strong response in patients with milder HFRS, but not in those with severe infection.
In contrast with these findings, a vigorous activated and proliferating (Ki67+CD38+HLA-DR+) CD8+ T cell response was observed in early PUUV infection, and it was significantly higher at day 6 than at day 10 after symptom onset and thereafter (the effector CD8+ T cells were assessed in a non-antigen-specific way) (6). Likewise, a recent HTNV study also showed that the frequency of the epitope-specific pentamer+CD8+ T cells was statistically higher in the early stage than that in the late stage (7). Further longitudinal analysis of the virus-specific T cell responses, however, was not available for measuring the discrepancy.
The other finding in HFRS, consistent with other diseases, is that despite the variation between patients in the patterns of stimulatory peptides, particular sequences were dominant. Although the four most frequently recognized epitopes were often detected both in mild to moderate patients (5 of 7 or 71% of patients) and in severe patients (7 of 8 or 75% of patients), the initial response to these epitopes was only immunodominant in mild to moderate infection. These data suggest that the impaired dominant T cell responses at the early stage of infection may have contributed to the severe course of disease.
In summary, this study demonstrates that the virus-specific T cell response in patients suffering from severe HTNV infection was heavily impaired at the early stage, suggesting that an initial failure to mount a strong T cell response may be the primary cause of the progression of acute HTNV infection into severe HFRS.
Footnotes
Acknowledgments
We thank all patients who generously participated in this study and the clinical research staff and nurses who helped to recruit the patients. This study was supported by the National Natural Science Foundation of China (81373234).
Author Disclosure Statement
No competing financial interests exist.