
Abstract
Enteroviruses have been suggested as triggers of type 1 diabetes (T1D). We aimed to assess whether established T1D susceptibility single nucleotide polymorphisms (SNPs) and candidate SNPs in innate immune genes were associated with the frequency of enterovirus infection in otherwise healthy children. Fifty-six established T1D SNPs and 97 other candidate immunity SNPs were typed in 419 children carrying the T1D high-risk genotype, HLA-DR4-DQ8/DR3-DQ2 genotype, and 373 children without this genotype. Enteroviral RNA was detected using real-time polymerase chain reaction, with primers detecting essentially all enterovirus serotypes, in 7,393 longitudinal stool samples collected monthly (age range 3–36 months). The most significant association was with two T1D SNPs, rs12150079 (ZPBP2/ORMDL3/GSDMB region) (enterovirus frequency: AA 7.3%, AG 8.7%, GG 9.7%, RR = 0.86, overall p = 1.87E-02) and rs229541 (C1QTNF6/SSTR3/RAC2) (enterovirus frequency: CC 7.8%, CT 9.7%, TT 9.4%, RR = 1.13, overall p = 3.6E-02), followed by TLR8 (rs2407992) (p = 3.8E-02), TLR3 (1914926) (p = 4.9E-02), and two other T1D SNPs (IFIH1 rs3747517, p = 4.9E-02 and PTPN22, rs2476601, p = 5.3E-02). However, the quantile–quantile plot of p-values with confidence intervals for all 153 SNPs did not reveal clear evidence for rejection of the complete null hypothesis. Among a number of SNPs in candidate genes, we found no evidence for strong associations with enterovirus presence in stool samples from Norwegian children.
Introduction
T
The application of genome-wide association studies (GWAS) has robustly discovered over 40 susceptibility loci for T1D in addition to the well-established role of HLA-DQ and -DR genes (1, 29, 36) (
Enteroviruses are known to activate strong innate immune responses (23). Although recent studies have identified cellular host factors and signaling molecules required for entry of specific enterovirus types, these were in vitro experiments (9 –12), which may not necessarily mimic the more complex picture of enterovirus infection in humans in vivo.
To address some of the gaps in our knowledge regarding the potential relationship between the enterovirus and T1D in humans, as well as to contribute to general knowledge about genetic determinants of enterovirus infections in human populations, we studied a large set of candidate SNPs in T1D susceptibility loci and other immunity genes for association with the frequency of gut infections in healthy children, as determined by detection of enteroviral RNA in serial fecal samples.
Materials and Methods
Subjects and study design
Participants in the MIDIA study were children from the general population of newborns in Norway recruited during 2001–2007. After screening 46,939 newborns for the HLA DRB1*04:01-DQA1*03-DQB1*03:02/DRB1*03-DQA1*05-DQB1*02 (DR4-DQ8/DR3-DQ2) genotype, which confers high risk for T1D (34), we tested 4,373 fecal samples from 419 children with this genotype and 3,022 fecal samples from 373 children without this genotype for enterovirus RNA in stool samples (see details in Supplementary Figure S1; Supplementary Data are available online at
Ethics statement
The parents consented in writing on behalf of their children. The study was approved by The Regional Committee for Medical Research Ethics (IRB name: “Regional Med Resch Ethics Comm South IRB #2-South-East A,” IRB00001871) and the Norwegian Data Inspectorate.
Detection of enterovirus RNA in nucleic acids from stool
Stool samples were processed and tested for enterovirus as described earlier (7). In brief, stool samples from diapers were sent in ambient temperature by postal service, diluted, and centrifuged. The supernatants were frozen at −80°C until copurification of nucleic acids from 140 μL supernatants of centrifuged feces. Enterovirus was detected using an internally controlled one-step real-time reverse transcriptase-polymerase chain reaction (RT-PCR) with primer–probe combination specific for the conserved 5′-untranslated region of human enteroviruses (does not react with rhinovirus, however). The reaction was performed in duplicate with the QuantiTect Probe RT-PCR kit (Qiagen) to a 10 μL reaction, consisting of 1× QuantiTect PCR Master Mix, 900 nM reverse (5′-attgtcaccataagcagcca-3′) and 300 nM forward (5′-ccctgaatgcggctaatcc-3′) primers, 200 nM FAM-labeled probe (FAM-aaccgactactttgggtgtccgtgtttc-TAMRA), 1× QuantiTect RT Mix, and 2 μL template nucleic acid extract. Serial dilutions of enterovirus Armored RNA (Asuragen) were used to construct a seven-point standard curve from 24 to 100,000 copies/μL. The threshold of positivity was 10 copies/μL RNA, a quantity that could be consistently and reliably detected.
Selection of T1D SNPs and candidate genes
We selected SNPs associated with T1D according to Barrett et al. (1) (Supplementary Table S1), the four IFIH1 rare variants according to Nejentsev et al. (26), and the IFIH1 rs3747517 (missense mutation) (1, 4) (Supplementary Table S2), and additionally selected tagSNPs for genes that we assumed were involved in immune pathways for intracellular sensing of enterovirus (see Supplementary Table S2 and Supplementary Data for detailed description of tagSNPs). Briefly, we included SNPs from TLRs 3, 7, 8, and 9 (intracellular receptors) and some of their known accessory and downstream molecules (20) and SNPs in TLR2, 4, 5, and 6 (membrane associated) based on previous association with T1D or infections (2, 13, 28). In addition, genes from the cytoplasmic RIG-I-like receptor signaling pathway with some adaptors, regulatory molecules, and signaling molecules were included. In total, 56 SNPs were selected for their association with T1D by Barrett et al. (1) (Supplementary Table S1) and 97 were IFIH1 SNPs and tagSNPs for candidate innate immune pathway genes (Supplementary Table S2).
Genotyping
DNA for genotyping was extracted from the cell fraction of capillary blood as described (6). The method of SNP genotyping was the commercially available Sequenom MassARRAY platform using iPLEX chemistry (Sequenom); 152 SNPs were genotyped on this platform. A few SNPs (rs1990760, rs2281808, rs3134947, rs2722188, rs8120, rs10774671, rs484621, rs3747517) were genotyped using TaqMan technology with predesigned primer–probe mixes following the manufacturer's instructions (Applied Biosystems). T1D SNPs that failed on Sequenom were additionally attempted to be genotyped on TaqMan (rs2476601, rs2292239, rs5753037, rs10499194).
Statistical analyses
Details of quality control of genotyping data are presented in the Supplementary Data. Allele frequencies, estimates of relative risk (RR), 95% confidence intervals (CIs), and associated p-values were calculated for each SNP using the HAPLIN package (version 3.5) in the R software (more details presented in the Supplementary Data). The main analyses were done using a model with enterovirus infection episode as the outcome variable. The method by HAPLIN (16) was used to analyze the data. HAPLIN is based on log-linear modeling as originally described (39) and implements a full maximum likelihood model for estimation. HAPLIN computes explicit estimates of relative risks with asymptotic standard errors and CIs. In the primary analysis, allelic effects were assumed to be multiplicative or dose response. Secondary analysis, using 2 degree of freedom tests or the unrestricted free model, was used to explore other modes of inheritance. Quantile–quantile (Q-Q) plots with 95% CIs were made using the HAPLIN package pQQ.R. Age and season, known predictors of enterovirus (40), were controlled for by including these covariates in an ordinary logistic regression model in Stata version12.1 (StataCorp).
We also evaluated the association between a T1D genetic risk score and the presence of enterovirus RNA in the children using log-linear regression. Among 53 independent SNPs previously established as T1D susceptibility SNPs [according to Barrett et al. (1) (Supplementary Table S1) and IFIH1 rare variants according to Nejentsev et al. (26)], the genetic risk score for each child was calculated as the sum of T1D alleles across all T1D susceptibility SNPs. To minimize errors in the risk allele score due to missing data on several SNPs, only children with three or less SNPs that failed genotyping were included in the risk allele score analyses. While the T1D genetic risk score was based on previously established T1D susceptibility SNPs regardless of results in the current study, we also constructed a second genetic risk score based on the subset of the 53 T1D susceptibility SNPs that showed nominal p-value <0.05 for association with enterovirus in the current data set. Receiver operating characteristics (ROCs) curves were used to assess the performance of the risk allele scores in classification of the outcome.
Pathway and gene analyses may potentially increase the statistical power and were done in R by computing p-values from single SNPs within a gene (and pathway), and summarizing them into a single p-value, corrected for within-gene (and pathway) multiple testing (see Supplementary Methods for details). T1D SNPs were excluded here, except for IFIH1 SNPs, as they are involved in the RIG-I-like receptor signaling pathway.
Results
Enterovirus RNA was present in 924/7,393 stool samples (12.5%, 95% CI 11.7–13.2%). The Q-Q plots of the observed and expected overall p-values with CI did not indicate any significant associations with the multiplicative allelic effect of SNPs (Fig. 1), for the unrestricted allelic effect (free) model (Fig. 2), for candidate innate immune pathway genes (Figs. 3 and 4), nor with their respective pathways (data not shown). That is, the p-values do not deviate significantly from a uniform distribution, which would be expected if there were no substantial effects of the tested markers. Adjusting for known predictors of enterovirus infection, age, and season of stool sampling did not significantly change the results (data not shown).
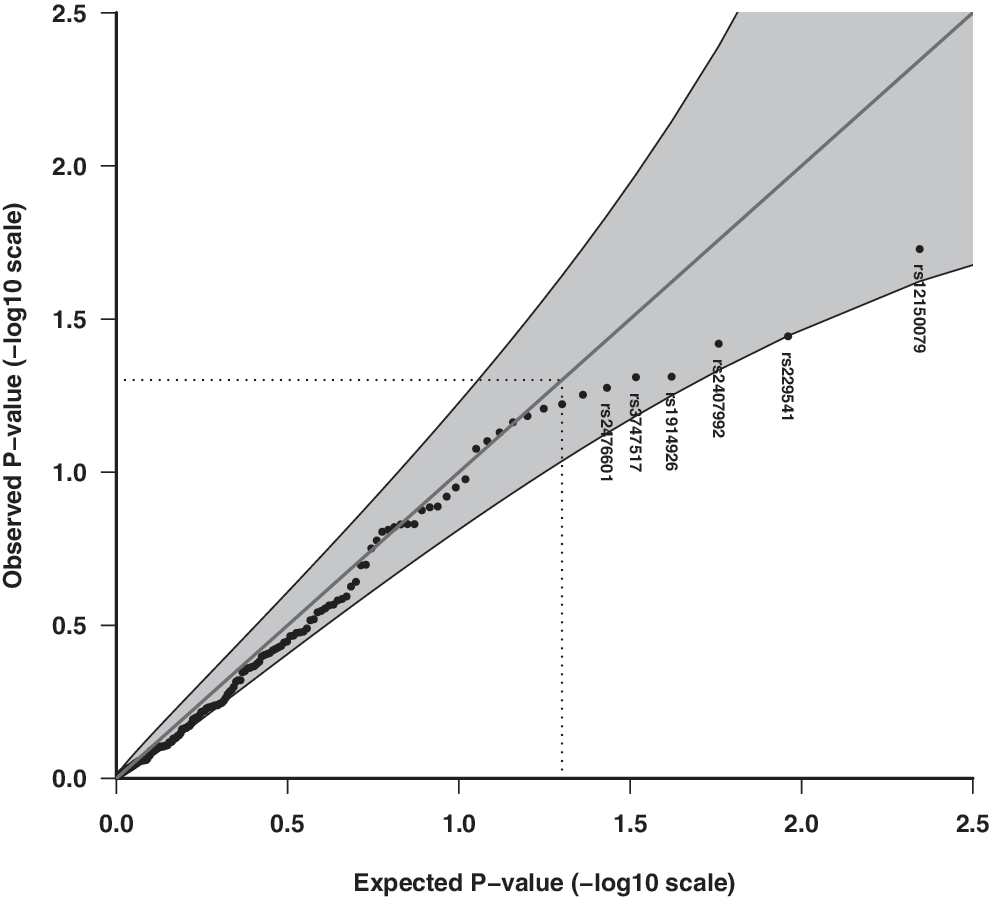
Quantile–quantile (Q-Q) plot of the observed and expected overall p-values of 153 candidate SNPs for association with enterovirus infection episodes in stools assuming the multiplicative (dose–response) allelic effect model. Shaded areas represent 95% confidence interval (CI) bands, and dotted lines indicate the expected ranked p-value of 0.05. rs12150079 (T1D SNP; intronic, ZPBP22), rs229541 (T1D SNP; promoter, C1QTNF6), rs2407992 (coding exon, TLR8), rs3747517 (coding exon, IFIH1), rs1914926 (downstream, TLR3), rs2476601 (T1D SNP, coding exon, PTPN22). SNPs, single nucleotide polymorphisms.
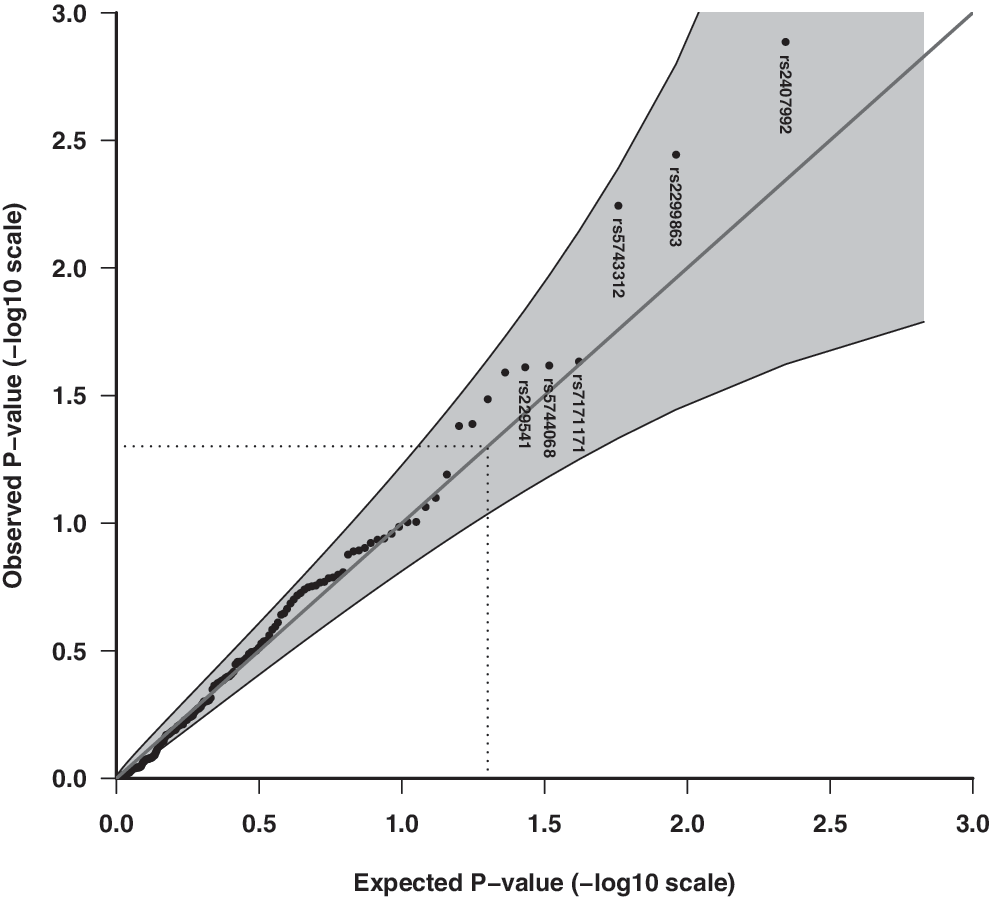
Q-Q plot of the observed and expected overall p-values of 153 candidate SNPs for association with enterovirus infection episodes in stools assuming the unrestricted (free) allelic effect model. Shaded areas represent 95% CI bands, and dotted lines indicate the expected ranked p-value of 0.05. rs2407992 (coding exon, TLR8), rs2299863 (intronic, ATG), rs5743312 (intronic, TLR3), rs7171171 (T1D SNP, downstream, RASGRP1), rs5744068 (intron, TLR8), rs229541 (promoter, C1QTNF6).
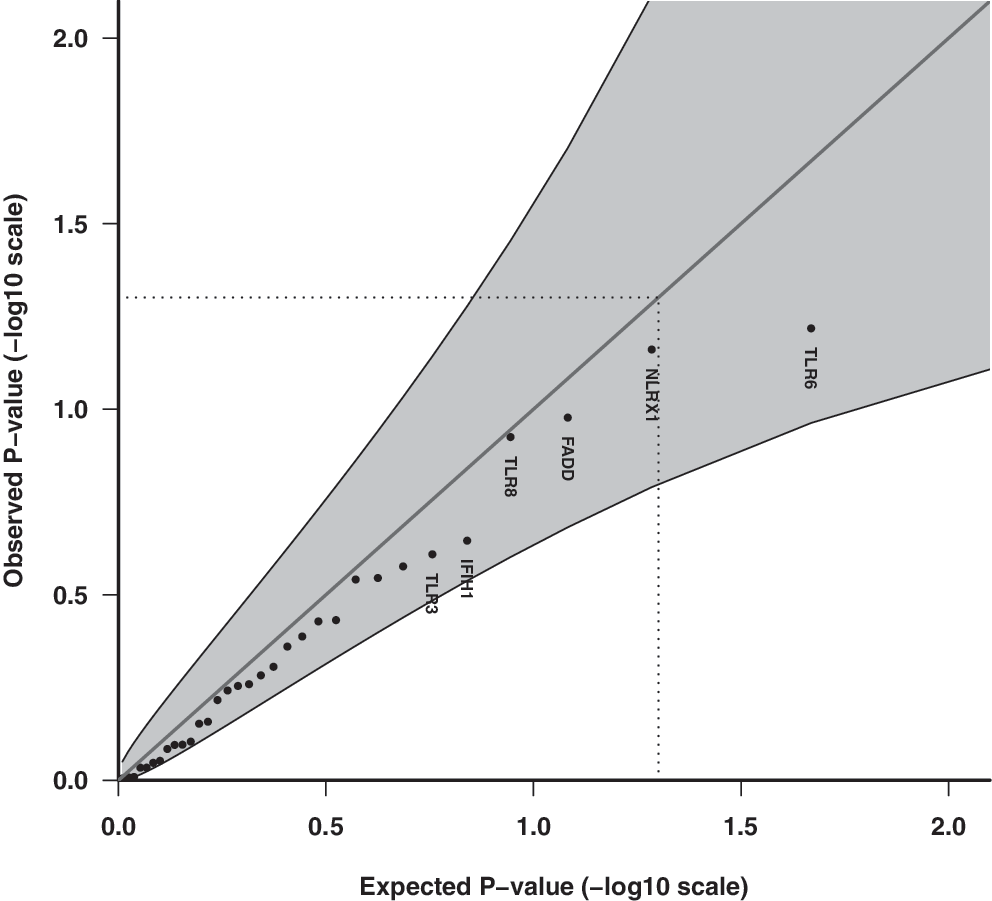
Q-Q plot of observed and expected p-values for innate immune pathway genes assuming the multiplicative allelic effect model for SNPs (n = 98) and association with enterovirus infection episodes in stools. Shaded areas represent 95% CI bands, and dotted lines indicate the expected ranked p-value of 0.05.
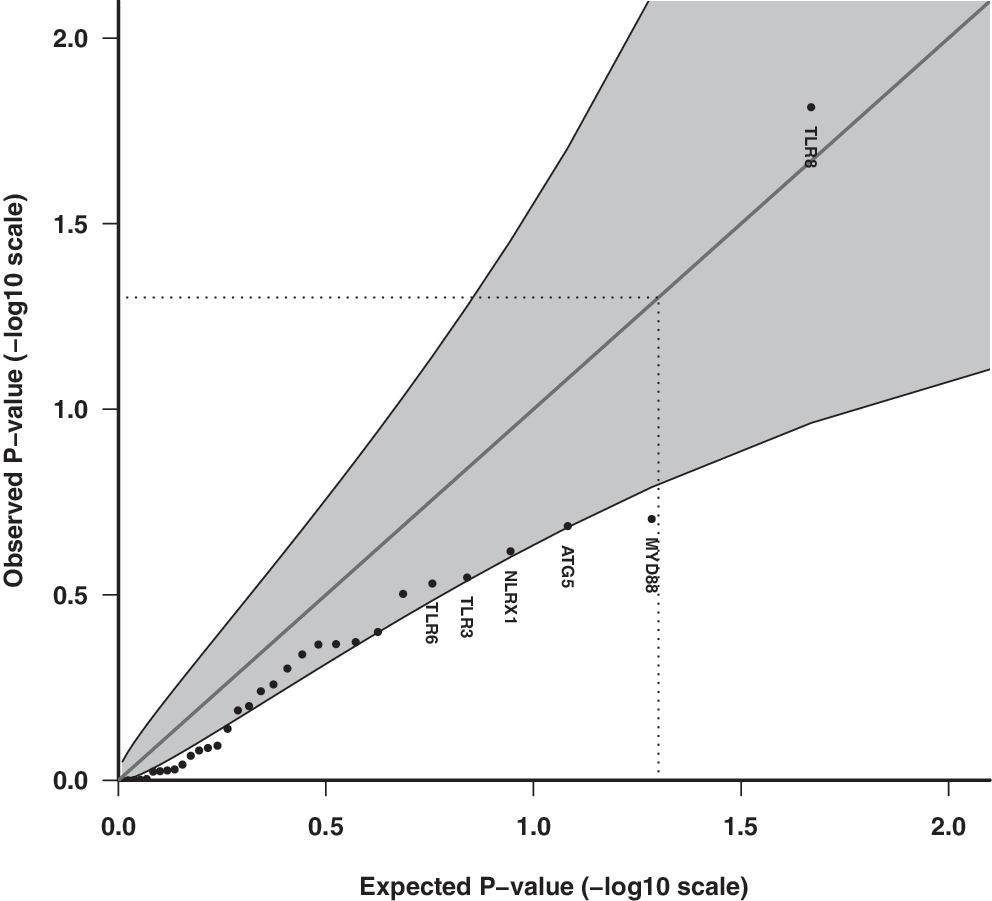
Q-Q plot of observed and expected p-values for innate immune pathway genes assuming the unrestricted allelic effect model for SNPs (n = 98) and association with enterovirus infection episodes in stools. Shaded areas represent 95% CI bands, and dotted lines indicate the expected ranked p-value of 0.05.
Two T1D SNPs had the most significant overall uncorrected p-values assuming a dose–response relationship (multiplicative model) with enterovirus: rs12150079 within the 7q12 region (ZPBP2/ORMDL3/GSDMB region) (enterovirus frequency: AA 7.3%, AG 8.7%, GG 9.7%, RR = 0.86, overall p = 1.87E-02) and rs229541 within the 22q12.3 region (C1QTNF6/SSTR3/RAC2) (enterovirus frequency: CC 7.8%, CT 9.7% TT 9.4%, RR = 1.13, overall p = 3.60E-02). These were followed by TLR8 (rs2407992), TLR3 (1914926), and two other T1D SNPs (IFIH1 and PTPN22) (Table 1 and Fig.1). The full table of SNP associations is listed in Supplementary Table S3.
The 10 SNPs with the lowest overall p-values among 153 SNPs in total are listed.
Uppercase letter is reference allele. Alleles are in alphabetic order.
SNPs with missing observations were imputed.
Likelihood ratio p-value, 1 df.
SNP was later excluded from Barret et al. (1). However, a weak association (p-value 4.0e-04, 1 df) with T1D has been reported by Bradfield et al. (4) (
Risk allele was not reported by the authors.
aa, amino acid; C1QTNF6, C1q and tumor necrosis factor-related protein 6 (other genes in LD region: SSTR3, RAC2); CI, confidence interval; IFIH1, interferon induced with helicase C domain 1 (the RIG-I-like receptor signaling pathway) TLR3, Toll-like receptor 3; INS, insulin; LD, linkage disequilibrium; MAF, minor allele frequency; NLRX1, NLR family member X1 (the RIG-I-like receptor signaling pathway); PTPN22, protein tyrosine phosphatase, nonreceptor type 22; RNF135, ring finger protein 135 (the RIG-I-like receptor signaling pathway); RR, relative risk; SNP, single nucleotide polymorphism; TLR6, Toll-like receptor 6; TLR8, Toll-like receptor 8; T1D, type 1 diabetes; ZPBP2, zona pellucida-binding protein 2 (for other genes in the LD region, see Supplementary Table S1).
In secondary analyses, the unrestricted allelic effect model indicated lower overall uncorrected p-values than the primary model, with rs2407992 (TLR8) having the lowest p-value (enterovirus frequency: CC 9.3%, GC 10.9%, GG 7.9%, RR = 1.43, 95% CI 1.18–1.74, overall p = 1.35E-03, single dose p = 2.00E-04), followed by rs2299863 (ATG5) (overall p = 3.60E-03) and rs5743312 (TLR3) (overall p = 5.65E-03) (Table 2 and Fig. 2).
The 10 SNPs with the lowest overall p-values among 153 SNPs in total are listed.
Uppercase letter is reference allele. Alleles are in alphabetic order.
SNPs with missing observations were imputed.
Likelihood ratio p-value, 1 df.
Single-dose estimates, comparing heterozygotes against homozygotes as reference. Numbers are in bold when the model is more significant than the overall p-value.
Double-dose estimates comparing minor allele homozygotes to the major allele homozygotes as the reference.
rs7171171 is in LD with rs17574546 and vice versa.
ATG5, autophagy-related 5 (Negative regulators of RIG-I/MDA5 signaling, Regulation of autophagy); df, degrees of freedom; IL2RA, interleukin 2 receptor, alpha; MYD88, myeloid differentiation primary response gene 88 (Toll-like receptor signaling pathway, plus nine other KEGG networks); RASGRP, RAS guanyl releasing protein 1 (MAPK signaling pathway, T cell receptor signaling pathway); TRAF3, TNF receptor-associated factor 3 (RIG-I-like receptor signaling pathway, Toll-like receptor signaling pathway, plus 3 other networks).
Among innate immune candidate genes for enterovirus, TLR8 had the lowest corrected p-value (p = 0.03) (Supplementary Table S4). The pathway with the lowest corrected p-value was the phagosome pathway (hsa04145) (p = 0.36).
Interestingly, the T1D SNP rs2476601 located in the coding exon (R/W) of PTPN22 showed some potential association with prolonged infections of enterovirus: RR = 0.83 (reference allele = R), overall p = 9.5E-3 (multiplicative model), with lower prevalence in heterozygotes (RR 3.2%, RW 1.7%, WW 2.9%), followed by rs1914926 downstream of TLR3 with enterovirus frequencies: CC 6.7%, GC 3.3%, GG 2.7% (RR = 1.34, multiplicative model: overall p = 1.7E-2). The same SNPs in TLR8 and C1QTNF6 were among the top 10 SNPs for both the multiplicative and unrestricted models, and two different SNPs in TLR3 showed up among the top 10 in each of the two models (Tables 2 and 3).
Calculated based on T1D risk alleles that are independently associated with T1D (for list of SNPs, see Supplementary Table S1).
Calculated based on SNPs with a p-value < 0.05 for the multiplicative model, 30 in total (Supplementary Table S3 for individual SNP associations).
The total number of individual T1D genetic risk scores ranged from 44 to 74 (median: 58.5). There was no significant association between the genetic risk score and enterovirus infection (OR = 0.99, 95% CI 0.98–1.01, p = 0.54), including after stratifying for HLA genotype or analyzing the genetic risk score in quartiles or with the risk score variable based on SNPs with a p-value < 0.05 for the multiplicative model (Table 3). ROC indicated that the T1D genetic risk score had no predictive value for enterovirus infections in the gut (Supplementary Figs. S2–S4).
Discussion
Despite the inclusion of more than 7,000 longitudinal stool samples collected monthly and a few hints of potential associations, none of the 153 SNPs showed evidence for a strong or highly significant association with enterovirus.
Our large homogenous cohort of healthy children forms an ideal study group for our research question. We are only aware of a few previous studies that have tested host genetic variants for association with common enteric viral infections, but these have been candidate studies on the neurovirulent but rare enterovirus 71 type in symptomatic patients (5, 18, 21, 24, 44), in addition to our previous studies on the IFIH1 variants (6, 42) and HLA risk genotypes for T1D (41). These studies are, at best, supported by weak statistical evidence and none has been confirmed yet. Our study is the largest to date of its kind and is the first one to examine a large number of candidate loci and pathways for human enterovirus infections in vivo. In addition to the large sample size, the frequent sampling and utilization of direct and unbiased molecular detection of enteroviral RNA are important strengths of our study.
It is interesting to note that among T1D risk loci that regulate immunity (38), our data suggest association with some of these; rs12150079 (ZPBP2/GSDMB/ORMDL3) and rs229541 (C1QTNF6/SSTR3/RAC2). rs12150079 has been associated with autoimmune disease (14, 31) and is assumed to be associated with long-range allele-specific chromatin modeling in the ZPBP2/GSDMB/ORMDL3 locus (37), which affects expression of several genes. rs229541 (22q12.3) is located in the promoter region of tumor necrosis factor-related protein 6 (C1QTNF6) and between somatostatin receptor 3 (SSTR3) and Ras-related C3 botulinum toxin substrate 2 (RAC2) in a 125-kb-associated region. The RAC2 is perhaps the most interesting candidate gene in the LD region, in that this gene belongs to the rho family, a small GTP-binding protein Rac2 in the regulation of the actin cytoskeleton pathway and the MAPK signaling pathway. The MAPK signaling pathway has been reported to play a role in restricting enterovirus infections (10).
Although TLRs are known to play important roles in the host response to viral infection (19), there are no previous studies on the role of TLR polymorphisms for enterovirus infections in humans. TLR3 detects double-stranded (ds) RNA and TLR7 and TLR8 detect single-stranded (ss) RNA upon endocytosis and are expressed in intracellular vesicles. Among our SNPs in TLR genes, the strongest association with the enterovirus presence in stools was for TLR8. The TLR8*rs2407992 is located within the coding region of TLR8 and is of putative functional significance, potentially affecting splicing, and has, for instance, been associated with asthma (25) and cancer (22). Most interestingly, an SNP, rs5979785, located 30 kb centromeric of the candidate genes, TLR7 and TLR8, has been associated with risk for T1D (8). It is unknown whether this SNP or variants in LD with it affect the expression of TLR7 or TLR8. TLR8 as an important mediator of enterovirus infection is supported by the identification of TL8 as the only TLR important for the regulation of coxsackie B viruses and poliovirus in polarized endothelial cells (10), and CVB3 induced significantly elevated expression of TLR2, TLR7, and TLR8 in intestinal epithelial cells, and activating TLR responses changed with the initial virus titers (43). Our results also suggest that TLR3 may modify enterovirus infections, which is consistent with the observation that TLR3 signaling on macrophages is required for survival following CVB4 infection (30).
A recent report suggests that a large proportion of T1D patients have prolonged or persistent enterovirus infection associated with an inflammatory process in the gut mucosa (27). Interestingly, the T1D SNP rs2476601 located in the coding exon (R/W) of protein tyrosine phosphatase, nonreceptor type 22 (PTPN22), showed some potential association with prolonged infections.
Both the associations of PTPN22 and TLR8 with fecal enterovirus suggested a pattern consistent with so-called molecular heterosis, where the heterozygotes have the highest (or in the case of PTPN22, lowest) risk. This was also observed in our previous study of IFIH1 genotype and enterovirus in the blood (6). However, we urge caution when interpreting this pending independent replication, also because the molecular mechanisms involved in these putative associations in humans in vivo are not known in detail.
Our study was a candidate gene study designed to identify genetic variants with relatively high MAFs (>5%) (with a few exceptions) and with a moderate relative risk (≥2). Consequently, two categories of genetic variants could still be involved in host gene–viral interactions: common variants with weak effects and rare variants. Nevertheless, SNPs with low MAF would not be likely to have a large impact on susceptibility for enterovirus infections in the general population. Furthermore, we cannot exclude the possibility that one or a few specific enterovirus sero- or genotypes are associated, but investigating each separate type would require a prohibitively large sample size and laboratory effort. With these limitations in mind, the lack of association in our study is not proof that there is absolutely no relationship between genomic variation and host response to enteroviral infections. Future studies should focus on larger cohorts, molecular characterization of enterovirus in blood and tissues, and possibly a genome-wide effort to explore the combined genetic background for host susceptibility for enterovirus infection in the etiopathology of T1D.
In conclusion, while some interesting candidate SNPs showed some evidence for potential association with the presence of enterovirus RNA in stool samples, the observed associations did not withstand procedures for controlling multiple testing, and large genetic effects from the included SNPs are unlikely.
Footnotes
Acknowledgments
The authors thank the public healthcare nurses, Turid Wetlesen and Lene Gustavsen, for their effort in the recruitment to the MIDIA study and follow-up of participating families. The authors also thank technicians at Dr. Cinek's laboratory in Prague and Bodil Bosmann Jørgensen Rikke Bonne and others at the Hagedorn Research Institute, Novo Nordisk, Denmark, for help with viral and genotyping experiments. The staff at the Biobank, Norwegian Institute of Public Health, helped with sample registration and initial handling. Finally, the authors express their deepest gratitude to all the parents and children for participating in the study. This study was funded by the Norwegian Organization for Health and Rehabilitation (2008/0182), the Ministry of Health of the Czech Republic (IGA MZ 11465-5), and by the Project for the Conceptual Development of Research Organisation 00064203 (University Hospital Motol, Prague, Czech Republic). The funders had no role in study design, data collection and analysis, decision to publish, or preparation of the manuscript.
Author Disclosure Statement
No competing financial interests exist.
References
Supplementary Material
Please find the following supplemental material available below.
For Open Access articles published under a Creative Commons License, all supplemental material carries the same license as the article it is associated with.
For non-Open Access articles published, all supplemental material carries a non-exclusive license, and permission requests for re-use of supplemental material or any part of supplemental material shall be sent directly to the copyright owner as specified in the copyright notice associated with the article.