
Abstract
Hepatitis B virus (HBV) has been reported to be recognized by dendritic cell-specific ICAM-3-grabbing nonintegrin in the presence of the α-mannosidase I inhibitor kifunensine, whereas native HBV is not. The aim of our study was to determine whether changes in α-mannosidase I expression in peripheral blood mononuclear cells (PBMCs) occur in patients with HBV infection. Peripheral blood was collected from 90 HBV-infected patients (grouped into immune tolerance, chronic hepatitis B, or inactive carrier group based on their clinical states) and 30 healthy donors. Expression of the three α-mannosidase I subtypes, MAN1A1, MAN1A2, and MAN1C1, was measured using western blot analyses. Compared with the healthy controls, significant increases in the MAN1A1, MAN1A2, and MAN1C1 expression levels were observed in the three HBV-infected groups, among whom the immune tolerance group showed the largest increase. For the patients in the immune tolerance phase, the expression levels of both MAN1A1 and MAN1A2 were linearly and positively correlated with the hepatitis B e antigen (HBeAg) titer and HBV DNA level, although a positive correlation was only found between MAN1C1 expression and the HBeAg titer. These results indicate that increased α-mannosidase I expression in PBMCs may play an important role in HBV immune escape and that its expression level is closely related to viral replication activity.
Introduction
A
Discovered in 2000, DC-specific ICAM-3-grabbing nonintegrin (DC-SIGN), a type II transmembrane protein, is a specific pattern recognition receptor of DCs that is primarily expressed in immature and mature DCs (11). DC-SIGN has been shown to be able to recognize a variety of pathogens containing mannose or fucose structures, such as human immunodeficiency virus (HIV), hepatitis C virus (HCV), and Ebola virus (16). It is likely that DC-SIGN participates in the detection of HBV because of the presence of mannose oligosaccharides in the HBV envelope (26). N-glycosylation is an important posttranslational protein modification, and α-mannosidase I may trim N-linked oligosaccharides, causing HBV demannosylation from a high-mannose form to a hybrid and complex structure (13,17). Op den Brouw et al. have reported that HBV can be recognized by DC-SIGN under certain circumstances; for example, DC-SIGN is unable to bind native HBV, whereas highly mannosylated HBV, obtained by treating HBV-producing HepG2.2.15 cells with the α-mannosidase I inhibitor kifunensine, is recognized by it (23).
Although HBV, which belongs to the Hepadnaviridae family, primarily affects the liver, HBV DNA and its associated antigens can also be found in extrahepatic tissues and cells. Since Lie-Injo et al. first reported the isolation of HBV DNA from the peripheral blood mononuclear cells (PBMCs) of HBsAg-positive HCC patients in 1983 (18), subsequent researchers have found that various forms of HBV are actually present in the PBMCs, such as HBV covalently closed circular DNA (cccDNA) and the RNA replication intermediate (4,21). These sources and forms of HBV DNA in PBMCs remain controversial; however, it has been shown that the PBMCs are an important target of extrahepatic HBV infection. Moreover, the infection of PBMCs can allow the virus to escape host immune clearance, leading to HBV persistence (8,9).
The recognition of highly mannosylated HBV by DC-SIGN in combination with HBV infection of PBMCs prompted us to speculate that enhanced α-mannosidase I expression may exist in the PBMCs of HBV-infected patients. Such a situation would lead to the generation of demannosylated HBV that cannot be combined with DC-SIGN, thereby escaping immune recognition by DCs and resulting in the subversion of a possible immune activation response. Consequently, we designed this clinical observation study to investigate whether enhanced α-mannosidase I expression exists in the PBMCs of HBV-infected patients and whether its enhanced expression is correlated with the clinical phase and immune status.
Materials and Methods
Patients and clinical samples
Our study included 90 gastroenterology patients from our hospital with chronic HBV infection. All these patients were HBsAg positive for at least 6 months, had not received any antiviral treatment, were more than 18 years old, and had no history of HIV and/or HCV infection or any other liver-related diseases. The patients were divided into the following three groups according to their clinical state: immune tolerance (n = 30), chronic hepatitis B (CHB) (n = 30), and inactive HBsAg carrier (n = 30). The definitions of the three phases of chronic HBV infection used in our study are in accordance with the guidelines of the National Institutes of Health (NIH) presented in Table 1 (14,20,22). In addition, 30 healthy blood donors were included as a control group.
ALT, alanine aminotransferase; HBeAg, hepatitis B e antigen; HBsAg, hepatitis B surface antigen; HBV, hepatitis B virus.
Peripheral blood samples were collected from each patient and placed into two tubes. The samples in ethylenediaminetetraacetic acid-precoated tubes were centrifuged at 370 × g for 5 min, and the sera were collected. PBMCs were isolated from blood samples in heparin-precoated tubes using density gradient centrifugation using Ficoll–Hypaque, and total protein was extracted using the RIPA lysis buffer. All the samples were processed within 24 h of collection and then stored at −80°C. The subsequent analyses were performed after the collection of all the samples.
Detection of α-mannosidase I expression levels in PBMCs
The three subtypes of α-mannosidase I are encoded as MAN1A1, MAN1A2, and MAN1C1 (19), and the expression levels of these proteins were determined by western blot analysis. Fifty micrograms of total protein from each sample was loaded onto sodium dodecyl sulfate–polyacrylamide gel electrophoresis. Anti-MAN1A1, anti-MAN1A2, and anti-MAN1C1 rabbit monoclonal antibodies (1:200; Abnova Technology) were used as primary antibodies, and equal protein loading was confirmed using rabbit anti-β-actin (1:400; Boster Biotechnology). Twenty-four hours later, the membrane was treated with horseradish peroxidase-conjugated immunoglobulin G (IgG) for 2 h at room temperature. Finally, the immobilized proteins were detected using an enhanced chemiluminescence (ECL) kit (ThermoFisher Scientific) according to the manufacturer's protocol. The resulting digital images were analyzed using ImageJ to obtain the integrated optical density of the signals. β-Actin was used as an internal control to normalize target protein expression.
Cytokine level assays
Serum levels of interleukin 12 (IL-12) and interferon-γ (IFN-γ) in patients and healthy controls were measured using enzyme-linked immunosorbent assay (ELISA). IL-12 was detected using a Human IL-12 ELISA Kit (detection range of 15.625–1,000 pg/mL; Elabscience), and an IFN-γ ELISA Kit (a minimum detection limit of 8 pg/mL; Neobioscience) was used to detect IFN-γ. The assays were performed according to the manufacturer's protocols.
Serological and biochemical analyses
Serum alanine aminotransferase (ALT) levels were measured using the IFCC method with an autoanalyzer (Cobas® 8000; Roche). Values of ALT >41 U/L and >40 U/L in male and female patients, respectively, were regarded as elevated. Serum HBsAg, hepatitis B e antigen (HBeAg), anti-HBs, anti-HBe, and anti-HBc levels were assayed using ELISA kits (Abbott Diagnostics) according to the manufacturer's instructions. Serum levels of HBV DNA were quantified using a real-time polymerase chain reaction assay with a Roche LightCycler® 480 analyzer; the lower detection limit was 500 copies/mL.
Statistical analyses
Continuous variables are presented as the mean ± standard deviation. To stabilize variances, HBV DNA values were logarithm transformed. All the continuous variables were tested using the independent sample t-test between the two groups. Linear regression is an approach for modeling the relationship between a scalar-dependent variable y and one or more explanatory variables. Thus, in the immune tolerance group, the correlation between the MAN1A1, MAN1A2, and MAN1C1 protein expression levels and the HBeAg titer or logarithm-transformed serum HBV DNA concentrations was analyzed using three linear regression models, in which the dependent variables were the MAN1A1, MAN1A2, and MAN1C1 protein expression levels, respectively. In the CHB group, Pearson correlation analysis was used to examine the correlation between the MAN1A1, MAN1A2, and MAN1C1 protein expression levels and the HBeAg titer and logarithm-transformed serum HBV DNA concentrations because they are continuous variables and are normally distributed. Spearman's rank correlation test, a nonparametric measure of statistical dependence between two variables, was used to analyze the correlation between the MAN1A1, MAN1A2, and MAN1C1 expression levels and the serum ALT level for a nonnormal distribution. All statistical analyses were conducted using SPSS 22.0 software, and a p-value <0.05 on both sides of the distribution was considered to indicate statistical significance.
Ethical approval
The study protocol was approved by the Ethics Committee of the Tongji Hospital, Tongji Medical College, Huazhong University of Science and Technology. A written informed consent was obtained from all the participants based on the aims and objectives of the study. The signed agreement was recorded in the patients' medical files.
Results
MAN1A1, MAN1A2, and MAN1C1 protein expression in the four groups
The MAN1A1, MAN1A2, and MAN1C1 expression levels are represented by their relative gray values, which are ratios to β-actin expression. These levels were compared between the two groups using the independent sample t-test. As shown in Figure 1, the MAN1A1, MAN1A2, and MAN1C1 expression levels in the three HBV infection groups were significantly increased compared with those in the healthy controls (p < 0.05). The immune tolerance group had the highest expression levels of these three proteins among the three HBV infection groups (0.65 ± 0.15, 0.64 ± 0.16, and 0.56 ± 0.15, respectively), followed by the CHB group (0.55 ± 0.15, 0.54 ± 0.15, and 0.45 ± 0.14, respectively) and the inactive carrier state group (0.46 ± 0.14, 0.45 ± 0.16, and 0.36 ± 0.11, respectively).
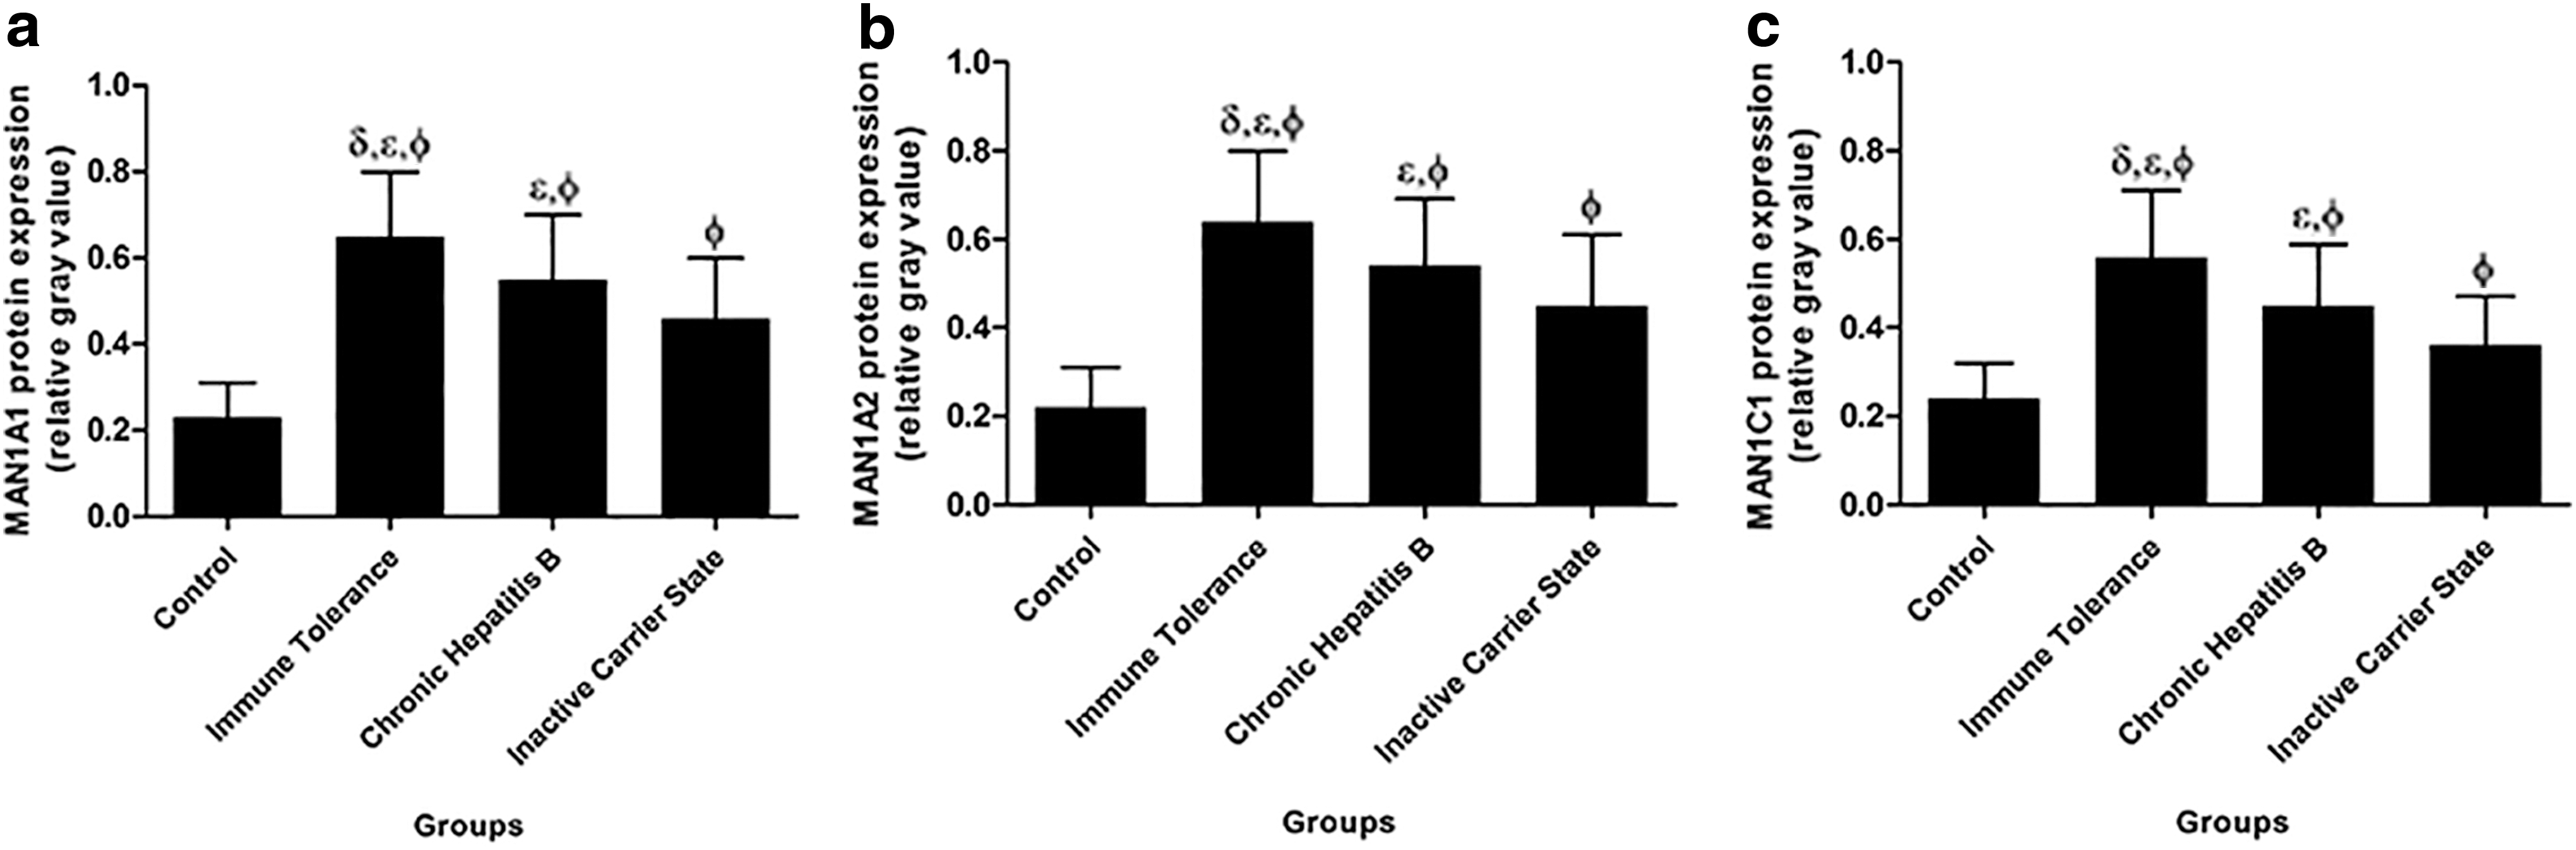
Different expression levels of
Serum IL-12 and IFN-γ levels in the four groups
The average IL-12 and IFN-γ serum levels in the four groups are shown in Figure 2. In our study, the serum IL-12 and IFN-γ levels in the three HBV infection groups were significantly higher than those in the healthy control group (p < 0.05) and were the highest in the CHB group (IL-12: 59.08 ± 13.08 and IFN-γ: 43.66 ± 12.50 pg/mL), followed by the immune tolerance (46.88 ± 10.74 and 35.73 ± 9.69 pg/mL) and the inactive carrier state (39.05 ± 9.93 and 31.36 ± 5.73 pg/mL) groups.
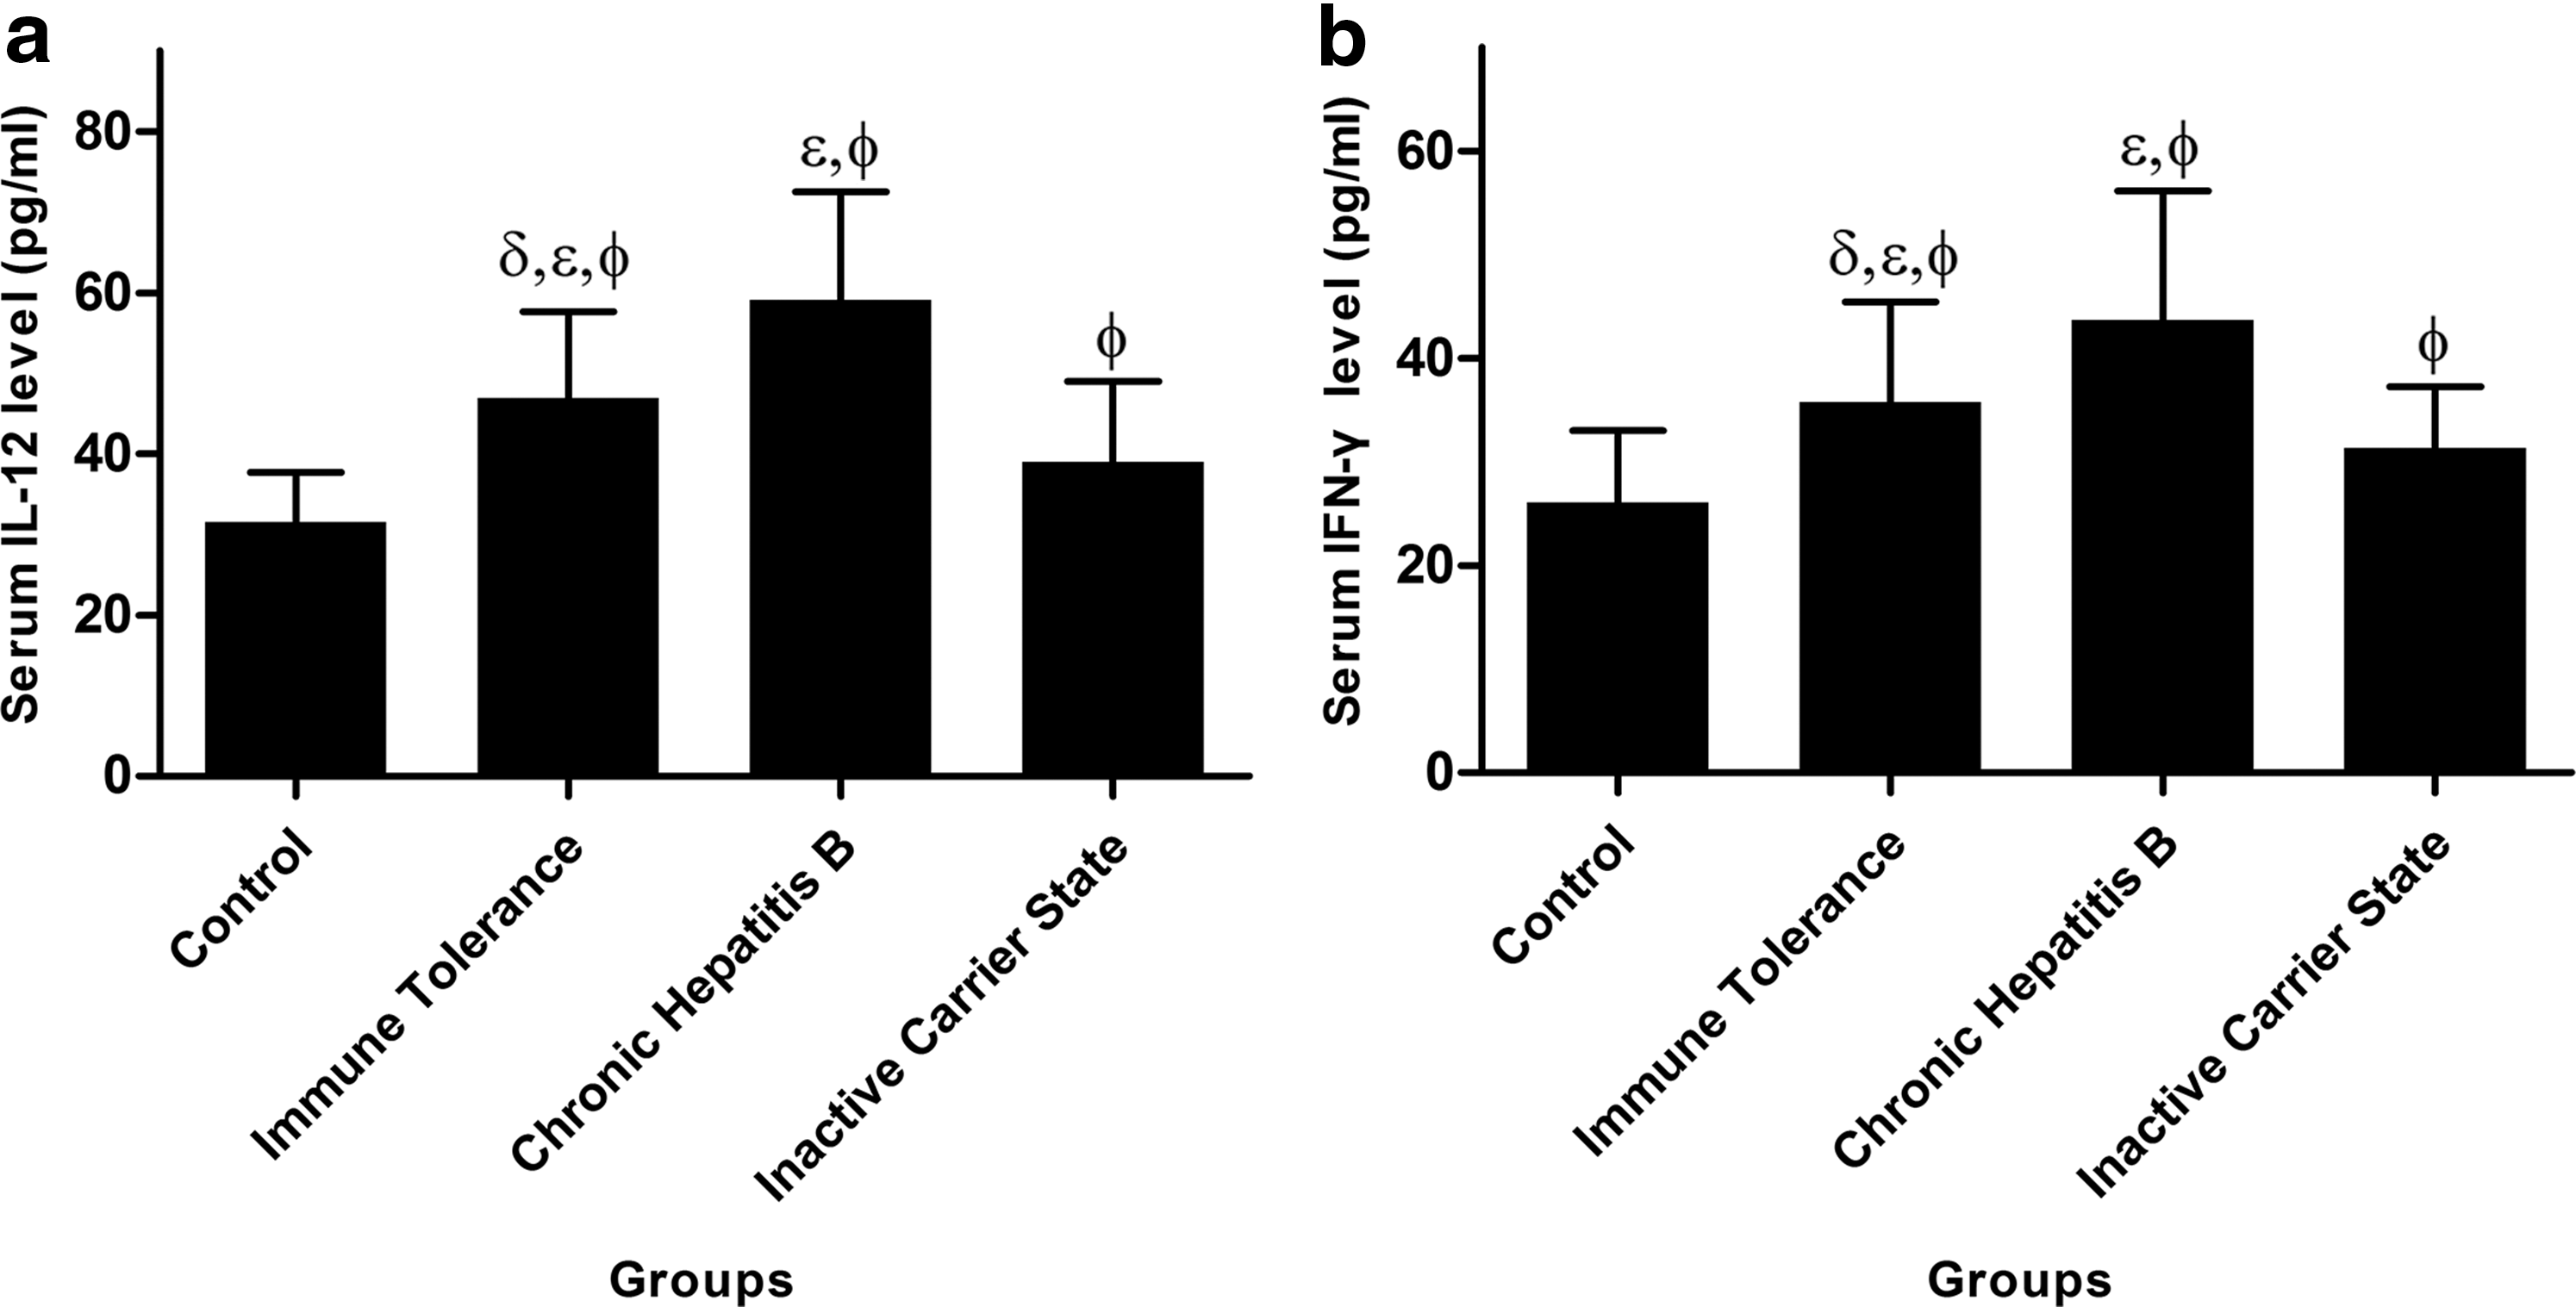
Detection of serum interleukin 12 (IL-12)
Linear correlation between MAN1A1, MAN1A2, and MAN1C1 expression and HBeAg titer and serum HBV DNA concentration in the immune tolerance group
The results from MAN1A1, MAN1A2, and MAN1C1 protein expression in the four groups demonstrate that the immune tolerance group had the highest MAN1A1, MAN1A2, and MAN1C1 expression levels among the three HBV infection groups. In addition, the HBV-infected individuals in the immune tolerance phase were HBeAg positive and had a normal ALT level but had an elevated HBV DNA level, ranging from 100,000 copies/mL to >1 million copies/mL (22). Therefore, further analysis was performed for this group. Preliminary scatter diagrams revealed a strong linear correlation between the MAN1A1, MAN1A2, and MAN1C1 expression levels and the HBeAg titer and serum HBV DNA concentration (Figs. 3 and 4). Subsequently, we constructed three linear regression models, in which both the HBeAg and HBV DNA levels were independent variables, with the MAN1A1, MAN1A2, and MAN1C1 expression levels as dependent variables. The following regression equations were obtained using variables filtered by stepwise regression:
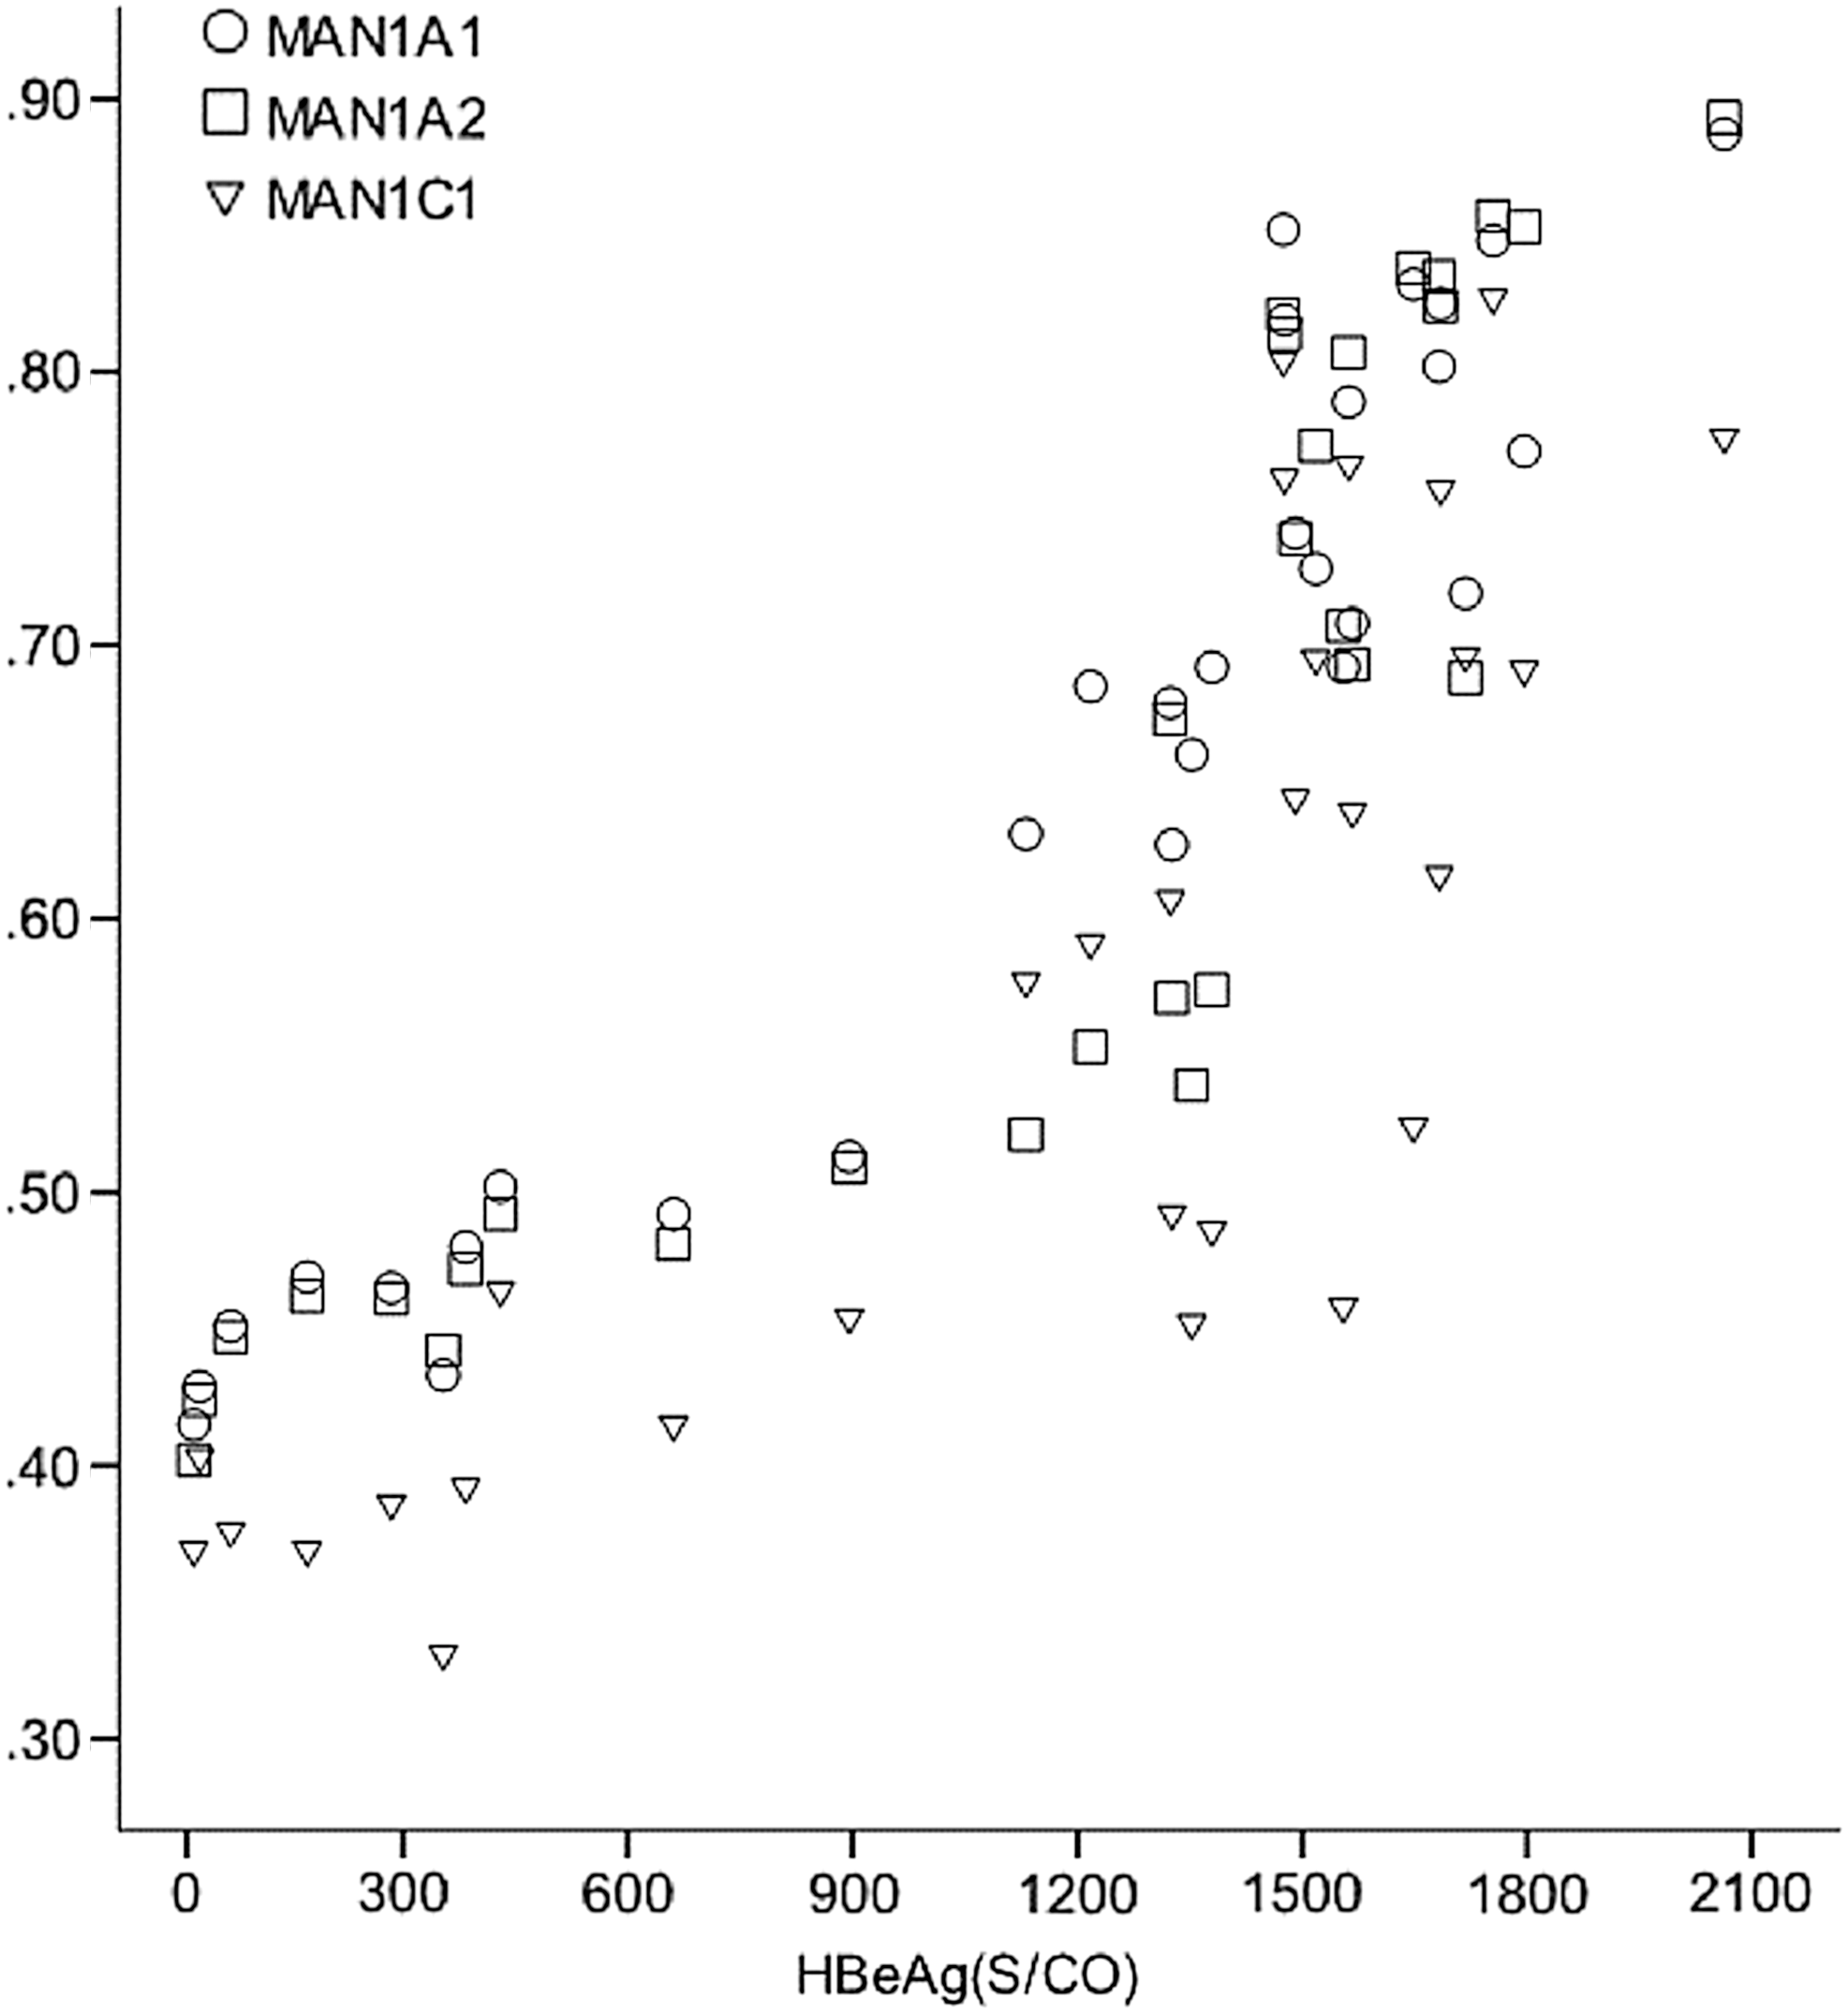
Hepatitis B e antigen (HBeAg) titer and expression levels of MAN1A1, MAN1A2, and MAN1C1.
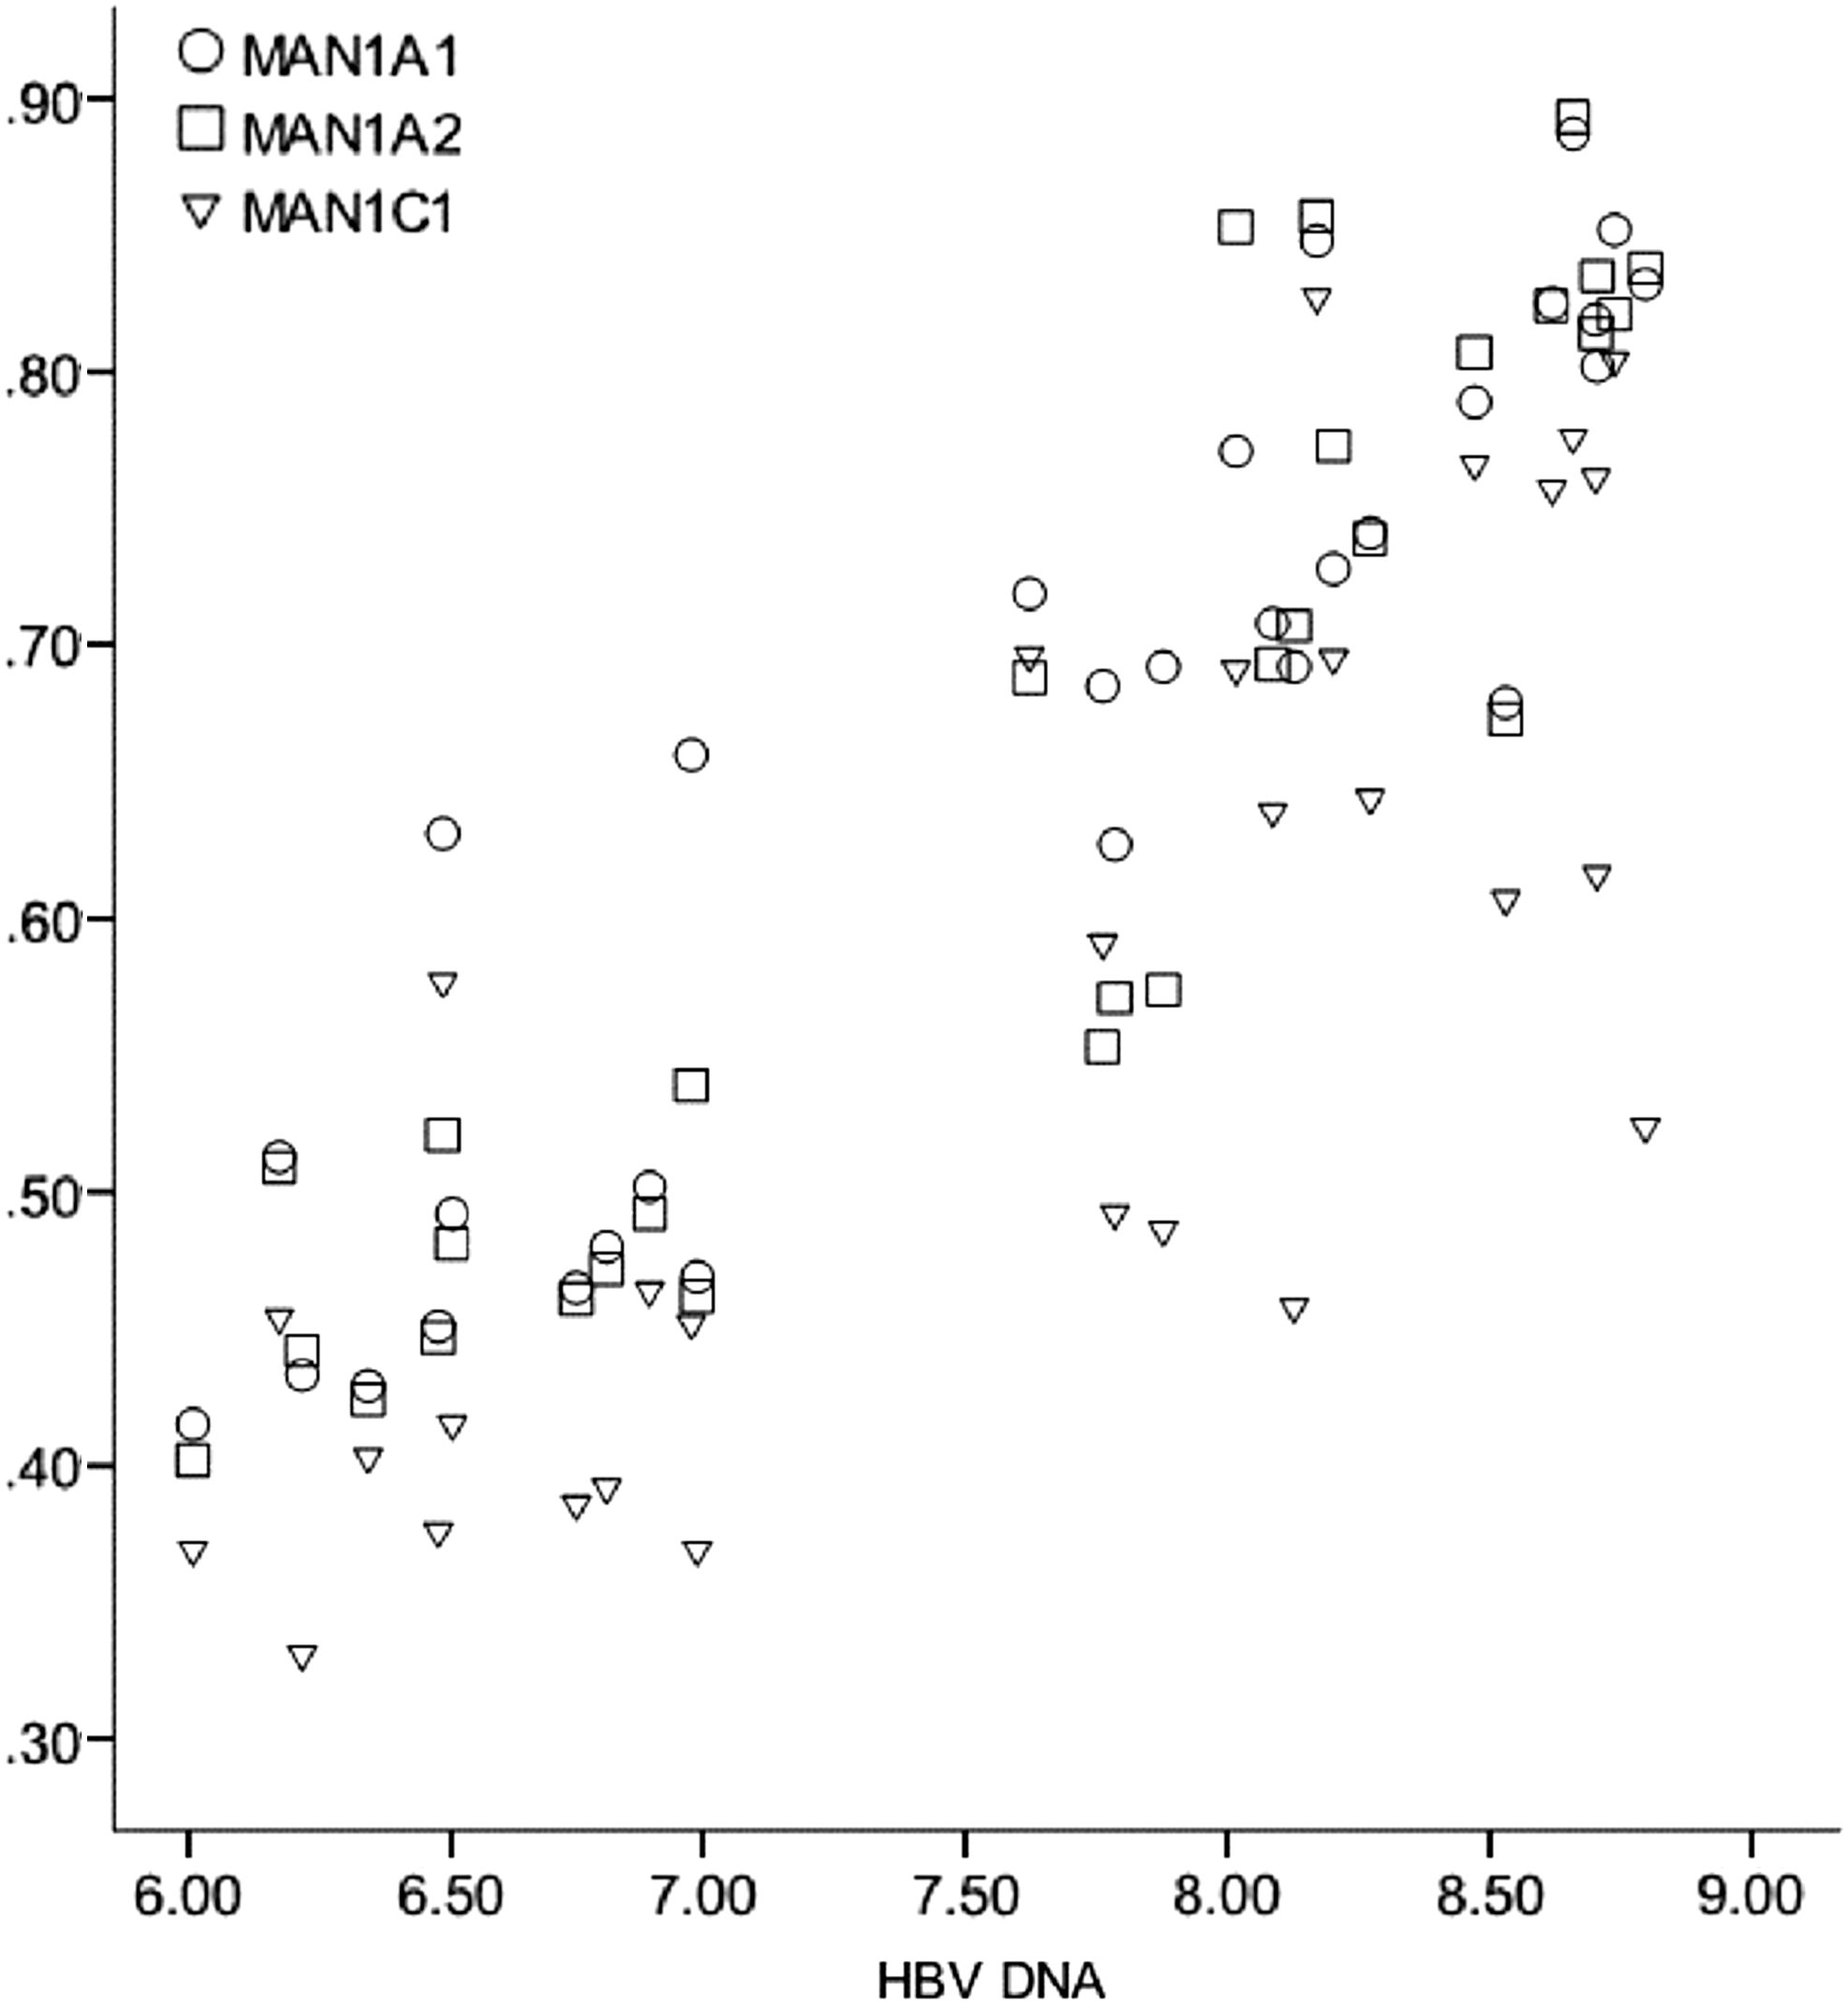
Serum hepatitis B virus (HBV) DNA concentration and expression levels of MAN1A1, MAN1A2, and MAN1C1. HBV DNA values were logarithm transformed.
MAN1A1 = −0.03 + 0.0001 × HBeAg + 0.07 × HBV DNA (Table 2);
Analysis of variance: F = 245.67, p < 0.001; coefficient of determination: R 2 = 0.95.
MAN1A2 = −0.23 + 0.0001 × HBeAg + 0.1 × HBV DNA (Table 3); and
Analysis of variance: F = 109.71, p < 0.001; coefficient of determination: R 2 = 0.89.
MAN1C1 = 0.03 + 0.0002 × HBeAg (Table 4).
Analysis of variance: F = 58.76, p < 0.001; coefficient of determination: R 2 = 0.68.
These regression equations indicate that the expression levels of both MAN1A1 and MAN1A2 were linearly and positively correlated with the HBeAg titer and serum HBV DNA level. In contrast, the expression levels of MAN1C1 increased only with an increase in HBeAg.
Correlation between MAN1A1, MAN1A2, and MAN1C1 expression and HBeAg titer and serum HBV DNA concentration in the CHB group
The CHB phase, also referred to as “the immune active phase” or the “immune clearance phase,” is characterized by an elevated ALT level and an elevated HBV DNA level >10,000 copies/mL. Patients may be either HBeAg positive or HBeAg negative/anti-HBe positive (22). Although the MAN1A1, MAN1A2, and MAN1C1 expression levels in the CHB group were lower than those in the immune tolerance group, this group included 21 patients who were HBeAg positive and 9 patients who were HBeAg negative. Consequently, for the CHB group, Pearson correlation analysis was used to examine the correlations between the expression levels of these proteins and the HBeAg titer and serum HBV DNA concentration for normally distributed data, and the correlations between the expression levels and the serum ALT level were analyzed using Spearman's rank correlation test for nonnormally distributed data. The results of Pearson correlation analysis showed that the MAN1A1, MAN1A2, and MAN1C1 expression levels were significantly positively correlated with the HBeAg titer and serum HBV DNA concentration (r > 0.5, p < 0.01; Table 5). To avoid the effects of outliers, an extreme value of ALT (4,751 U/L) was omitted. We then constructed a scatter diagram (Fig. 5), which indicated that there was no correlation between the expression levels of these proteins and the serum ALT level. A further Spearman's rank correlation test also demonstrated that the correlation coefficients between the MAN1A1, MAN1A2, and MAN1C1 expression levels and the serum ALT level were small and not statistically significant (p > 0.1; Table 5).
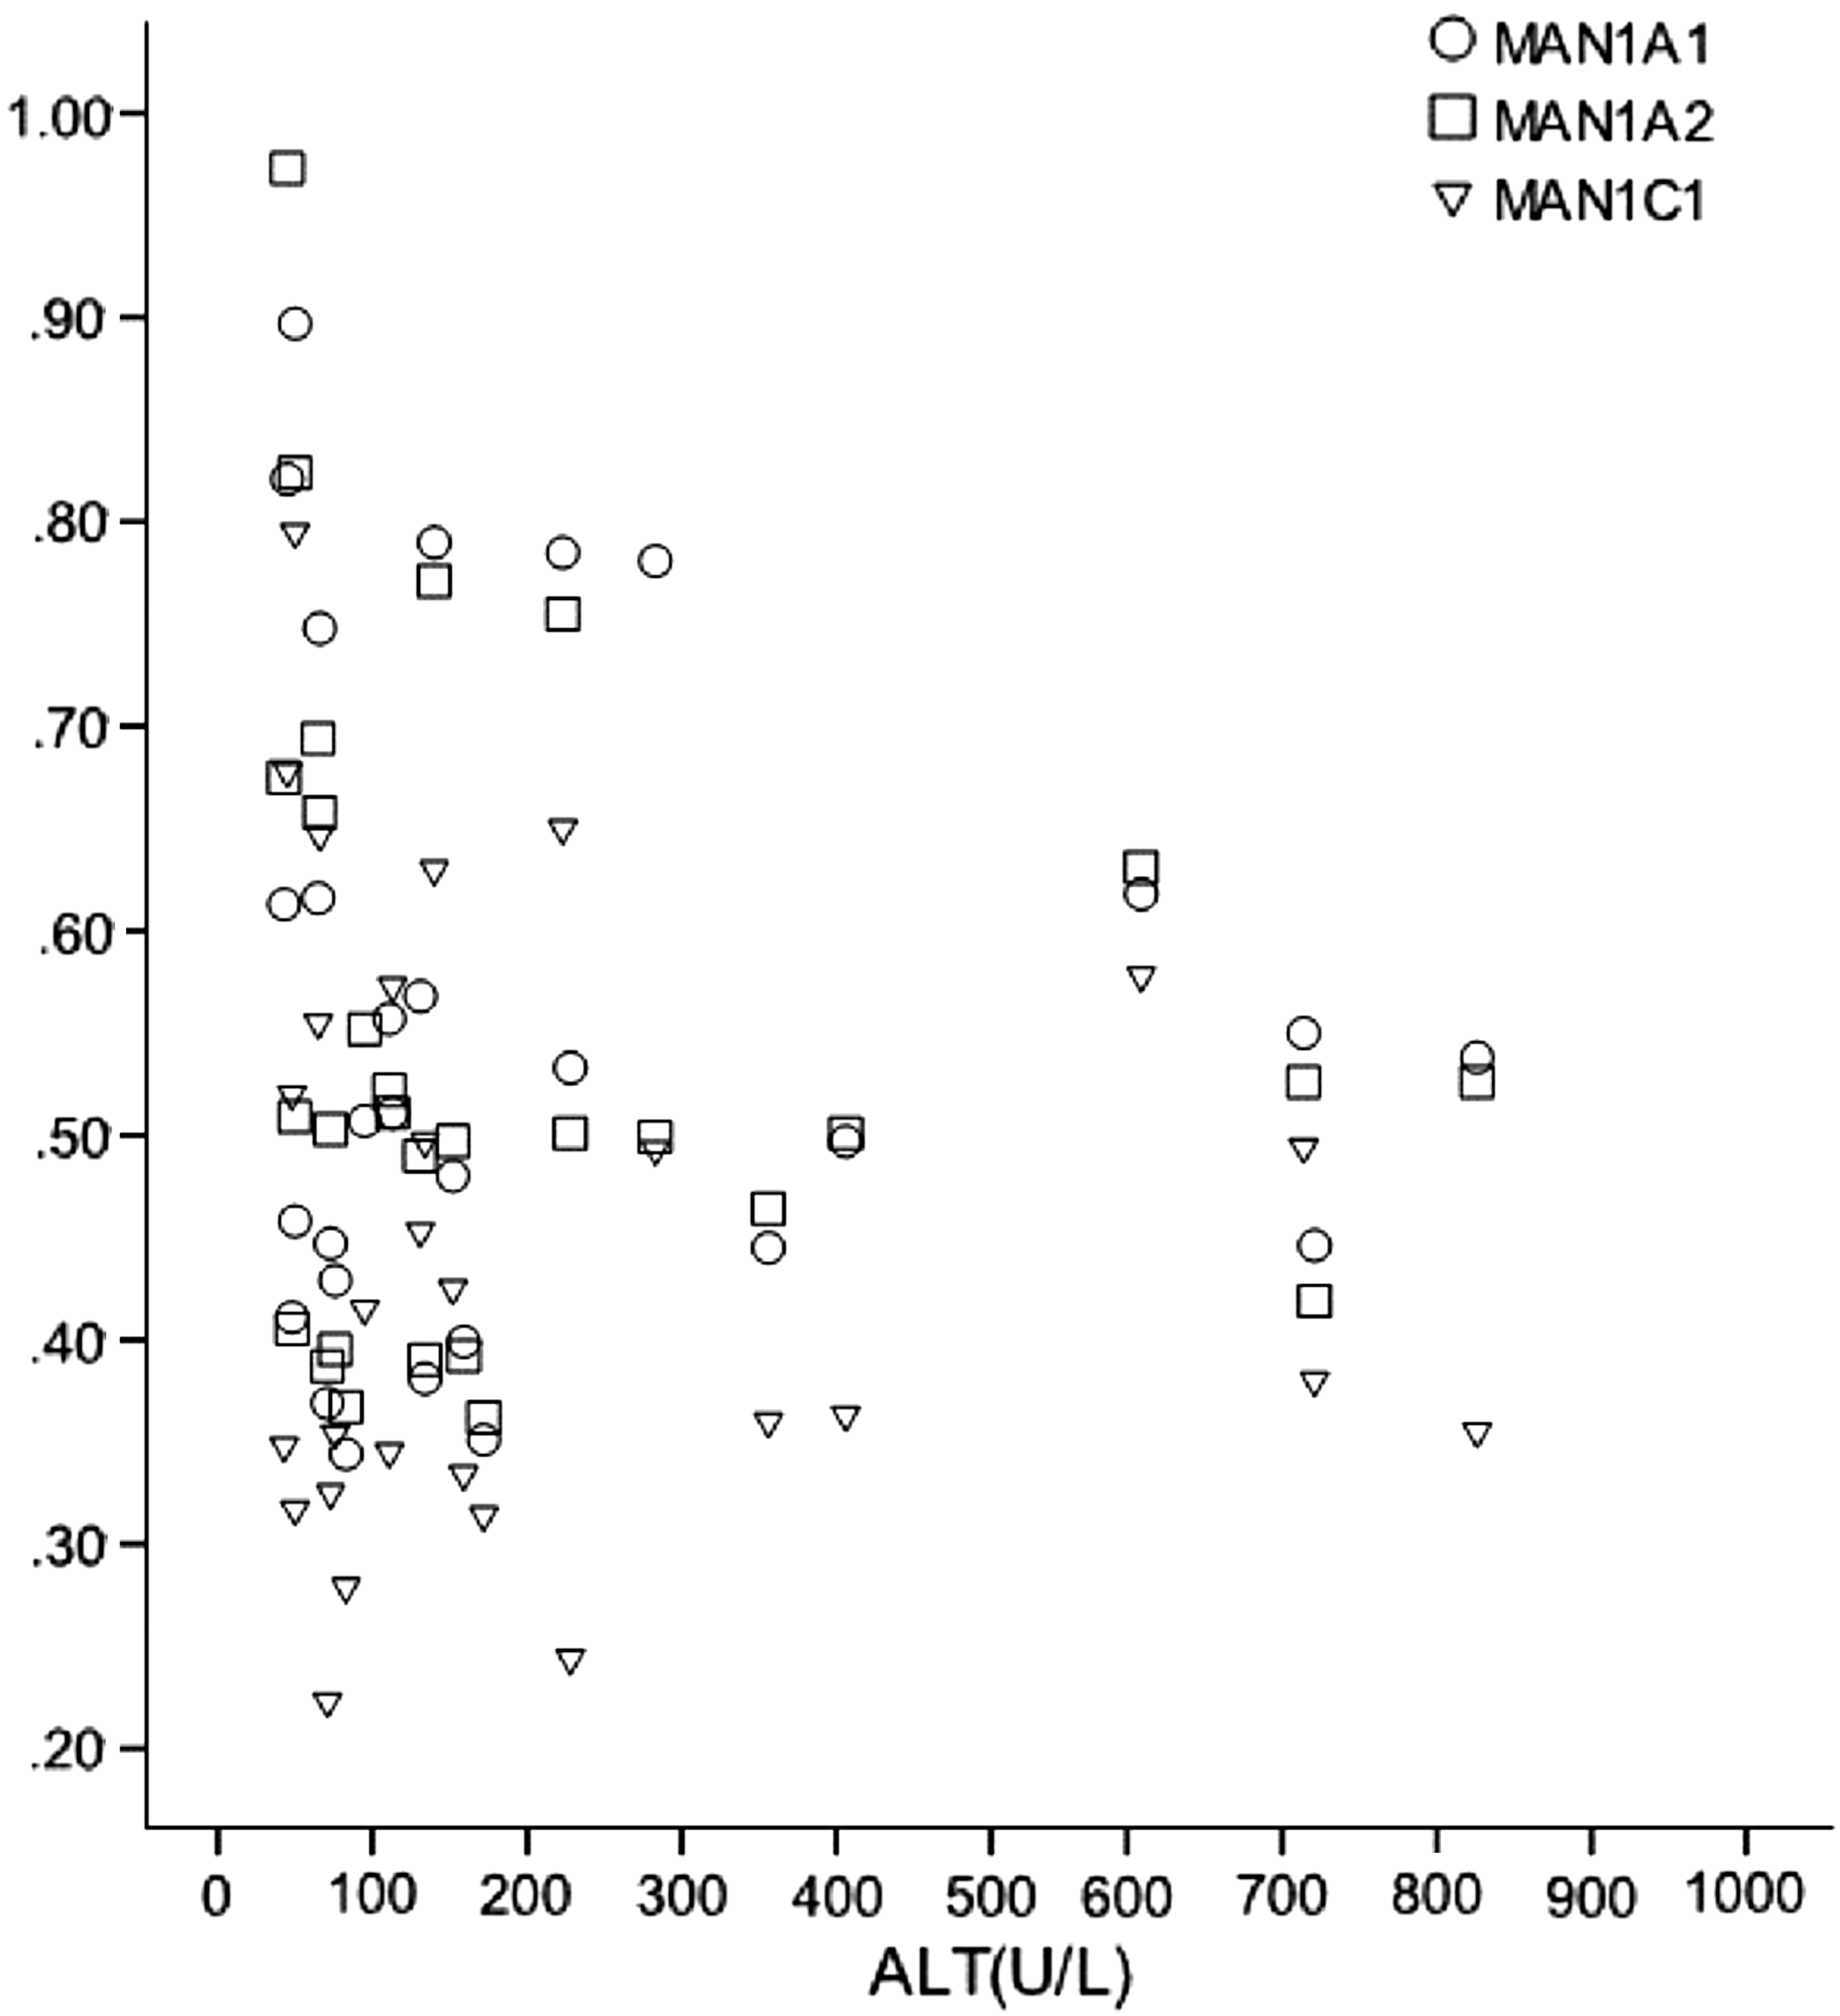
Serum alanine aminotransferase (ALT) level and expression levels of MAN1A1, MAN1A2, and MAN1C1 (extreme value removed).
Based on Pearson's correlation analysis.
Based on Spearman's rank correlation test.
Discussion
DCs are the most potent professional antigen-presenting cells (APCs), and they play crucial roles in the enhancement or regulation of antiviral immune reactions (3,29). Previous studies have found impairments in DC function in patients with chronic HBV infection, leading to a lower level of specific cell-mediated immunity, as well as defective specific cytotoxic T lymphocytes (28,30,31). Functional defects and the consequent inability to achieve efficient antigen presentation may be a mechanism of HBV persistence (2,5). The HBV envelope contains mannose oligosaccharides (26), and the DC-specific C-type lectin receptor, DC-SIGN, participates in immune escape in a variety of pathogens by recognizing mannose structures (7,12,16). Previous research has also shown that HBV is recognized by DC-SIGN when one of the enzymes involved in the formation of a complex glycan, α-mannosidase I, is inhibited, resulting in the generation of highly mannosylated virions (23). Therefore, we speculate that α-mannosidase I might play a role in chronic HBV infection by affecting the mannose trimming of HBV.
PBMCs were selected to explore the role of α-mannosidase I in chronic HBV infection because these cells are important targets of extrahepatic HBV infection (4,21). The three subtypes of α-mannosidase I are MAN1A1, MAN1A2, and MAN1C1 (19), which trim N-linked oligosaccharides, resulting in a demannosylated modification from a high-mannose form to a hybrid and complex structure (13,17). Therefore, α-mannosidase I expression was assessed by detecting the expression of the three subtypes, and the results showed that α-mannosidase I expression was ubiquitously upregulated in HBV-infected patients, further supporting our speculation that α-mannosidase I participates in chronic HBV infection.
HBV infection has the following three major clinical phases: immune tolerance, CHB, and an inactive HBsAg carrier state (20). In the immune tolerance phase, HBV cannot be effectively recognized by the host's immune system, leading to a weak immune reaction. Patients with CHB mount a partial immune response that is unable to clear the virus, resulting in only partial clearance; thus, the infection remains active, with continuing inflammatory activity. Inactive HBsAg carriers are able to control HBV replication and reduce HBV DNA to a low level that is not sufficient to elicit an immune reaction against infected hepatocytes (24). Our study found that MAN1A1, MAN1A2, and MAN1C1 expression in patients with immune tolerance was markedly upregulated, strongly suggesting that α-mannosidase I plays a role in the immune escape of HBV. Chronic HBV infection potentially mediates the demannosylated modification of HBV by upregulating α-mannosidase expression, thereby enabling HBV to escape immune recognition by DC-SIGN. These conditions lead to a poor antigen-presenting capacity; thus, either no response or only a weak immune response to HBV is generated by the host's immune system, causing immunotolerance to the virus in these patients. Although the MAN1A1, MAN1A2, and MAN1C1 expression levels were also higher in the patients in the CHB phase than those in the patients in the inactive HBsAg carrier state, their immune response was significantly stronger compared with the latter group, perhaps because of the low level of virus replication that occurs in the inactive carrier state (24).
IL-12 is the dominant cytokine that is generated by macrophagocytes, DCs, and other APCs. It promotes cell-mediated immunity by facilitating type 1 helper T-lymphocyte responses, inducing the secretion of IFN-γ from both T and natural killer cells, thereby enhancing the lytic activities of these cells, and augmenting specific cytolytic T-lymphocyte responses (10,27). Therefore, serum IL-12 and IFN-γ levels were selected to reflect cellular immunity in our study. The serum IL-12 and IFN-γ levels in the HBV-infected patients were significantly higher than those in the uninfected healthy donors, which is consistent with previous results (25). Significantly upregulated MAN1A1, MAN1A2, and MAN1C1 expression was also detected in the immune tolerance group, whereas the serum IL-12 and IFN-γ levels were lower than those in the CHB group, further confirming that α-mannosidase I participates in cellular immunity during HBV infection. HBV may escape immune recognition by DC-SIGN by upregulating α-mannosidase I expression, leading to the inhibition of an efficient antiviral immune response. Although the expression levels of MAN1A1, MAN1A2, and MAN1C1 in the inactive HBsAg carriers were lower than those in the immunotolerant patients, the serum IL-12 and IFN-γ levels were also lower. This finding may be a result of the ability of chronic HBsAg carriers to control HBV replication and reduce HBV DNA to a low level that is not sufficient to elicit an immune response against infected hepatocytes (24).
HBV-infected individuals in the immune tolerance phase are HBeAg positive, and they have a normal ALT level, an elevated HBV DNA level of at least 100,000 copies/mL and typically >1 million copies/mL (22), and high MAN1A1, MAN1A2, and MAN1C1 expression levels. A single analysis of this group revealed that the expression levels of both MAN1A1 and MAN1A2 were linearly and positively correlated with the HBeAg titer and serum HBV DNA level, whereas the expression level of MAN1C1 had a linear positive correlation only with the HBeAg titer. The CHB phase is characterized by an elevated ALT level and an elevated HBV DNA level >10,000 copies/mL. Patients may be either HBeAg positive or HBeAg negative/anti-HBe positive (22). Similar to the immune tolerance phase, the MAN1A1, MAN1A2, and MAN1C1 expression levels remained positively correlated with the HBeAg titer and serum HBV DNA level, although no correlation with the serum ALT level was observed. These results indicate that despite the differences in the expression levels, α-mannosidase I expression was closely associated with virus replication activity in both the immune tolerance and CHB groups. However, the MAN1A1, MAN1A2, and MAN1C1 expression levels were not correlated with the serum ALT level, which reflects the degree of liver inflammation. This result may be attributed to the multiple mechanisms and factors involved in liver inflammation.
In conclusion, our study combines the results of clinical indicators and basic experiments to demonstrate that the upregulation of α-mannosidase I in PBMCs occurs in individuals with chronic HBV infection and that the greatest increase occurs in the patients in the immune tolerance phase. Moreover, we found that the α-mannosidase I expression level was positively correlated with the HBeAg titer and HBV DNA level in both the immune tolerance and CHB groups. These results suggest that α-mannosidase I may play an important role in the immune escape of HBV; however, further study is required to determine the exact mechanism.
Our results will aid in the further elucidation of the mechanism of HBV persistence. This mechanism may become a new target for drugs in the prevention of HBV immune escape, thereby facilitating the development of new drugs for treating HBV infection.
Footnotes
Acknowledgments
This research was supported by the National Natural Science Foundation of China (81171559). We thank P. Yin (from Tongji Medical College, Huazhong University of Science and Technology, Wuhan, China) for helpful instruction on statistical analysis and all the anonymous reviewers for their valuable suggestions on the quality improvement of our article.
Author Disclosure Statement
No competing financial interests exist.