
Abstract
This study was to evaluate the immunostimulatory effects of N-(2-hydroxy) propyl-3-trimethylammonium chitosan chloride (HTCC) as an adjuvant for improving a commercial live attenuated hepatitis A virus (HAV) vaccine efficacy in mice. Mice in the experimental group were intraperitoneally immunized with a solution of HTCC and live attenuated HAV vaccine. And for those injected with sterile water, HTCC or live attenuated HAV vaccine were treated as mock group, negative group, and positive group in turn. The serum HAV-specific IgG titers and the ratios of the serum HAV-specific IgG2a/IgG1 in the experimental group were significantly increased (p = 0.00042 and p = 0.040, respectively). Splenocyte proliferation stimulation index in experimental group was higher than positive group (p = 0.021), and significantly higher than mock group and negative group (p = 0.0078 and p = 0.0050, respectively). The percentages of CD4+ T lymphocytes in the peripheral blood in experimental group were significantly higher than positive group, negative group, and mock group (p = 0.012, p = 0.012, and p = 0.045, respectively). Compared to the other three groups, experimental group showed a slightly higher ratio of CD4+/CD8+, but there were no significant differences (p > 0.05). In the percentages of CD8+ T lymphocytes, there were no significant differences among the four groups (p > 0.05). HTCC can enhance live attenuated HAV vaccine to generate stronger humoral responses and induce a Th1-biased immune response, as well as IgG2a class switching, compared with the live attenuated HAV vaccine alone. This study validated an important concept for further development of a safe and potent vaccine adjuvant.
Introduction
T
This article studied the effect of the biocompatible chitosan ammonium salt HTCC as an adjuvant for live attenuated hepatitis A virus (HAV) vaccine. We demonstrated the adjuvant effects of HTCC on HAV-specific humoral and cellular immune responses in mice.
Materials and Methods
Materials
Specific-pathogen-free female BALB/c mice, 6–8 weeks old, were purchased from Sino-British SIPPR/BK Lab. Animal Ltd. (Shanghai, China). All animal procedures were approved and carried out in accordance with the Institutional Guidelines for Animal Experiments of the Animal Care and Use Committee at the Zhejiang Academy of Medical Sciences. Chitosan with deacetylation degree of 94% (average molecular weight 28.8 × 10⁴ Da, Lot: 20061201) was purchased from Qingdao Lizhong chitin of China. Live attenuated HAV vaccine was purchased from Zhejiang Pukang Biotechnology Ltd. (Hangzhou, China). 3-chloro-2-hydroxypropyltrimethylammonium chloride (CTA) was purchased from Shaanxi Dasheng of China.
Synthesis of HTCC
HTCC was synthesized as per previous article (39). Briefly, 9 mL 40% NaOH was added to a reactor containing 6 g chitosan in 90 mL isopropanol, and the mixed solution was stirred at 55°C for 5 h. After heating up to 60°C, the reactor was added 48 mL 50% CTA drop by drop and stirred for 10 h. Then, the obtained transparent yellowish solution was precipitated in acetone and was kept at room temperature overnight. The material was dried by infrared fast dryer to constant weight and structurally elucidated with Fourier Transform Infrared Spectroscopy and 1H-NMR (Fig. 1).
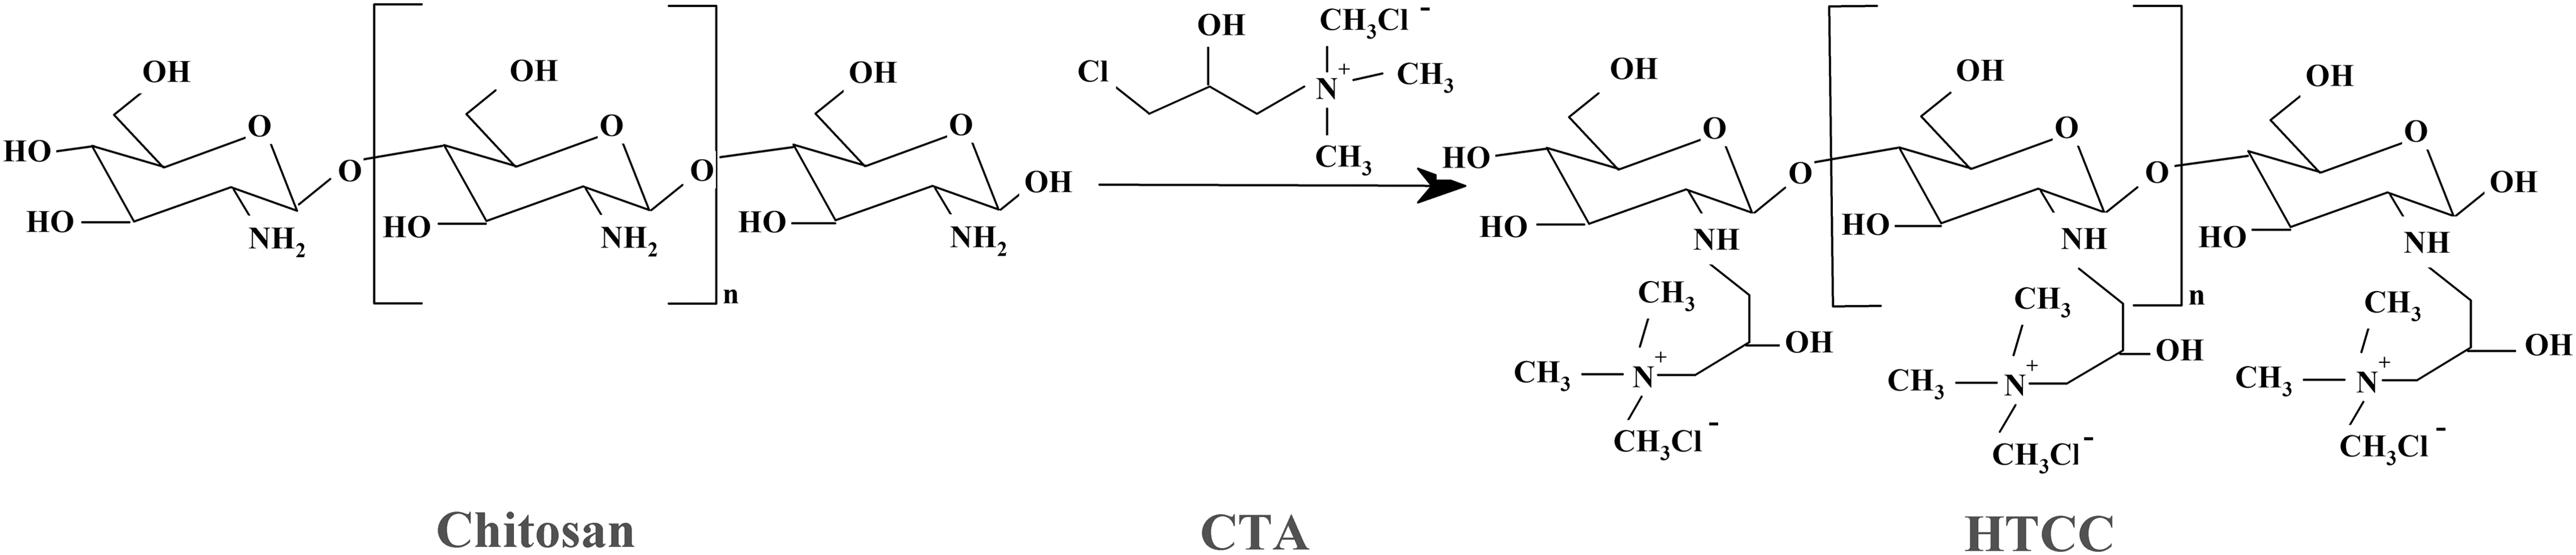
Synthesis and structure of HTCC. CTA, 3-chloro-2-hydroxypropyltrimethylammonium chloride; HTCC, N-(2-hydroxy) propyl-3-trimethylammonium chitosan chloride.
The characterization of HTCC
DQ of HTCC was calculated by the formula (13) DQ% = (∫(CH3)3/∫H) × 1/9 × 100 and the powder was dissolved in sterile water for testing the HTCC solubility. HTCC cytotoxity was determined by the MTS (3-(4, 5-dimethylthiazol-2-yl)-5-(3-carboxymethoxyphenyl)-2-(4-sulfophenyl)-2H-tetrazolium) assay (CellTiter 96® AQueous One Solution Cell Proliferation Assay; Promega, Madison, WI, USA). Briefly, exponentially growing 293 T cells (Institute of Biochemistry and Cell Biology, Shanghai Institutes for Biological Sciences, Chinese Academy of Sciences, China) were incubated with different concentrations of HTCC (0.005, 0.01, 0.02, 0.04, and 0.08 mg/mL) and medium alone (negative control) for 24 h at 37°C, respectively, then added 40 μL MTS per well and incubated for another 4 h at 37°C. And the optical density (OD) of light at 490 nm wave length was measured using a Multiskan MK3 Microplate Reader (Thermo Fisher Scientific, Inc., Waltham, MA, USA). Results were expressed as cell viability (%) calculated from average of ODsample/ODnegative control × 100%.
Immunization of mice
Thirty-two female mice were randomly divided into four groups and immunized intraperitoneally on day 0. Mice in the experimental group were injected with a solution (200 μL) of HTCC (250 μg) and live attenuated HAV vaccine (6.5lgCCID50, CCID50, 50% cell culture infective dose). And for those injected with sterile water (200 μL), HTCC (250 μg, 200 μL) or live attenuated HAV vaccine (6.5 lgCCID50, 200 μL) was treated as mock group, negative group, and positive group in turn.
Sample collection
On day 14 and 28 after immunization, mice were bled through the tail vein and sera were prepared and stored at −20°C for future assay. A single-cell suspension of splenocytes was prepared on day 28 as per following description. Splenocytes were isolated by passing spleen from immunized mice through a 70-μm cell strainer (Biologix Group Ltd., Jinan, China) followed by lysis buffer of erythrocytes (Lysing Buffer, BD Pharm Lyse™; BD Biosciences, San Jose, CA, USA). Splenocytes were washed once in sterile phosphate-buffered saline (PBS), then resuspended in 10 mL of RMPI1640 containing 10% FBS and antibiotics (GIBCO; Invitrogen Corporation, Grand Island, NY, USA).
Detecting HAV-specific total IgG
Serum HAV-specific antibodies were detected by HAV-specific total IgG ELISA Kit (Zhejiang Academy of Medical Sciences, China). Briefly, wells of 96-well, flat-bottomed polystyrene microplates (Shenzhen Jincanhua Ltd., China) were coated with HAV-specific mAb (1 μg/mL) in bicarbonate-carbonate buffer, pH 9.6 (100 μL per well) overnight at 4°C. After washing thrice with 0.05% v/v Tween 20 in PBS (PBST), the plates were added inactivated HAV (400 μg/mL) in bicarbonate-carbonate buffer, pH 9.6 (100 μL per well) overnight at 4°C. The inactivated HAV was discarded, and the plates were blocked at 37°C for 1 h with 3% nonfat milk in PBS (pH 7.4; 250 μL per well). The block solution was discarded, and the plates were washed thrice with PBST. Ten microliters 10-fold diluted serum sample and fifty microliters 1:2000 streptavidin-horse radish peroxidase (HRP, Sigma)-HAV-specific mAb (5 mg/mL) were applied in duplicate wells and incubated for 2 h at 37°C. After washing with PBST, 100 μL 3,3′,5,5′-tetramethylbenzidine (TMB) substrate was added, and the reaction was terminated with 2M sulfuric acid. The absorbance was measured at 450 nm using a Multiskan MK3 Microplate Reader. According to the OD of positive control and negative control, the cutoff value was calculated using the formula 1/2 (ODpositive control + ODnegative control). Samples were considered positive if the OD <cutoff value.
Detecting HAV-specific IgG titers and IgG subclasses
HAV-specific IgG titers and IgG subclasses were determined by an indirect ELISA method. Briefly, wells of 96-well, flat-bottomed polystyrene microplates (Shenzhen Jincanhua Ltd.) were coated with HAV-specific mAb (1 μg/mL) in bicarbonate-carbonate buffer, pH 9.6 (100 μL per well) overnight at 4°C. After washing thrice with PBST, the plates were added inactivated HAV (400 μg/mL) in bicarbonate-carbonate buffer, pH 9.6 (100 μL per well) overnight at 4°C. The inactivated HAV was discarded, and the plates were blocked at 37°C for 1 h with 3% nonfat milk in PBS (pH 7.4; 250 μL per well). The block solution was discarded, and plates were washed thrice with PBST. The plates were added serial 2- or 10-fold dilutions of the serum samples in 3% w/v BSA (bovine serum albumin) in PBS and incubated at 37°C for 1 h. Six washes with PBST were followed by incubation with HRP goat anti-mouse IgG, IgG1, or IgG2a (Southern Biotech, USA), 1:5000 in 3% w/v BSA in PBS for 1 h at 37°C. After washing six times with PBST, the plates were incubated with TMB at 37°C for 15 min, and the reaction was terminated with 2M sulfuric acid. The absorbance was measured at 450 nm using a Multiskan MK3 Microplate Reader. Samples were considered positive if the ODsample ≥2.1 ODnegative.
Splenocyte proliferation assay
Splenocytes were covered in 96-well plate (Corning, Inc., Corning, NY, USA) at a density of 5 × 10⁵ cell per well and were stimulated with concanavalin A (ConA, 5 μg/mL, Sigma) or medium alone (negative control), respectively, and incubated for 68 h at 37°C, then added 40 μL MTS per well and incubated for another 4 h at 37°C. And the OD of light at 490 nm wave length was measured using a Multiskan MK3 Microplate Reader. Results were expressed as the stimulation index (SI) calculated from the OD490 per well containing ConA divided by the OD490 of negative control well and corrected for background value observed in blank control well (12).
Flow cytometry analysis
T cell subpopulations in peripheral blood were analyzed for expression of phenotypic markers using fluorescent antibodies specific for CD4 and CD8 (all BD Biosciences Pharmingen). Briefly, 100 μL peripheral blood containing heparin was collected in 5 mL Fluorescence Activated Cell Sorter tube, then added 2 μL fluoresceine isothiocyanate conjugated rat anti-mouse CD4 (0.5 mg/mL) and 5 μL phycoerythrin conjugated rat anti-mouse CD8a (0.2 mg/mL) monoclonal antibodies and incubated in the dark at room temperature for 30 min. Added 1 mL 1 × red blood cell lysis buffer (BD Biosciences Pharmingen) and incubated in the dark at room temperature for 10 min. After centrifuged and washed cells in PBS, added 500 μL PBS and resuspended the cells for final flow cytometric analysis. Flow cytometry data from 10,000 cells/sample were acquired on a FACSCalibur (BD Biosciences) and analyzed using the computer program CellQuest™ software (BD Biosciences).
Statistical method
Data were summarized as mean ± standard deviation. The unpaired t test was used for statistical analysis. p-Value <0.05 was considered to be statistically significant.
Results
The characterization of HTCC
According to the 1H-NMR spectra of HTCC, DQ of HTCC was 71.4%. The solubility of HTCC in distill water is more than 70.1 mg/mL. HTCC cytotoxity was expressed as cell viability (%) and results showed 0.005, 0.01, 0.02, and 0.04 mg/mL. HTCC had a low toxicity to 293 T cells; the cell viability (%) was greater than 75% (Fig. 2).

HTCC cytotoxicity by cell viability assay. Two hundred ninety-three T cells were coincubated with different concentrations (0.005, 0.01, 0.02, 0.04, and 0.08 mg/mL) of HTCC for 24 h. Cell viability was calculated from ODsample/ODnegative control × 100%. All results are shown as mean ± standard deviation (n = 3). OD, optical density.
HAV-specific total IgG levels
The serum HAV-specific total IgG levels on day 14 and 28 of the immunized mice were tested by a competitive ELISA method. According to the ODpositive control and ODnegative control, the cutoff value was 1.275. Samples were considered positive if the OD <1.275. On day 14 and 28, mock group and negative group were negative results, but positive group and experimental group were positive results (Fig. 3A). Furthermore, the HAV-specific IgG titer of experimental group either on day 14 or 28 is higher than positive group (p = 0.00042; Fig. 3B).
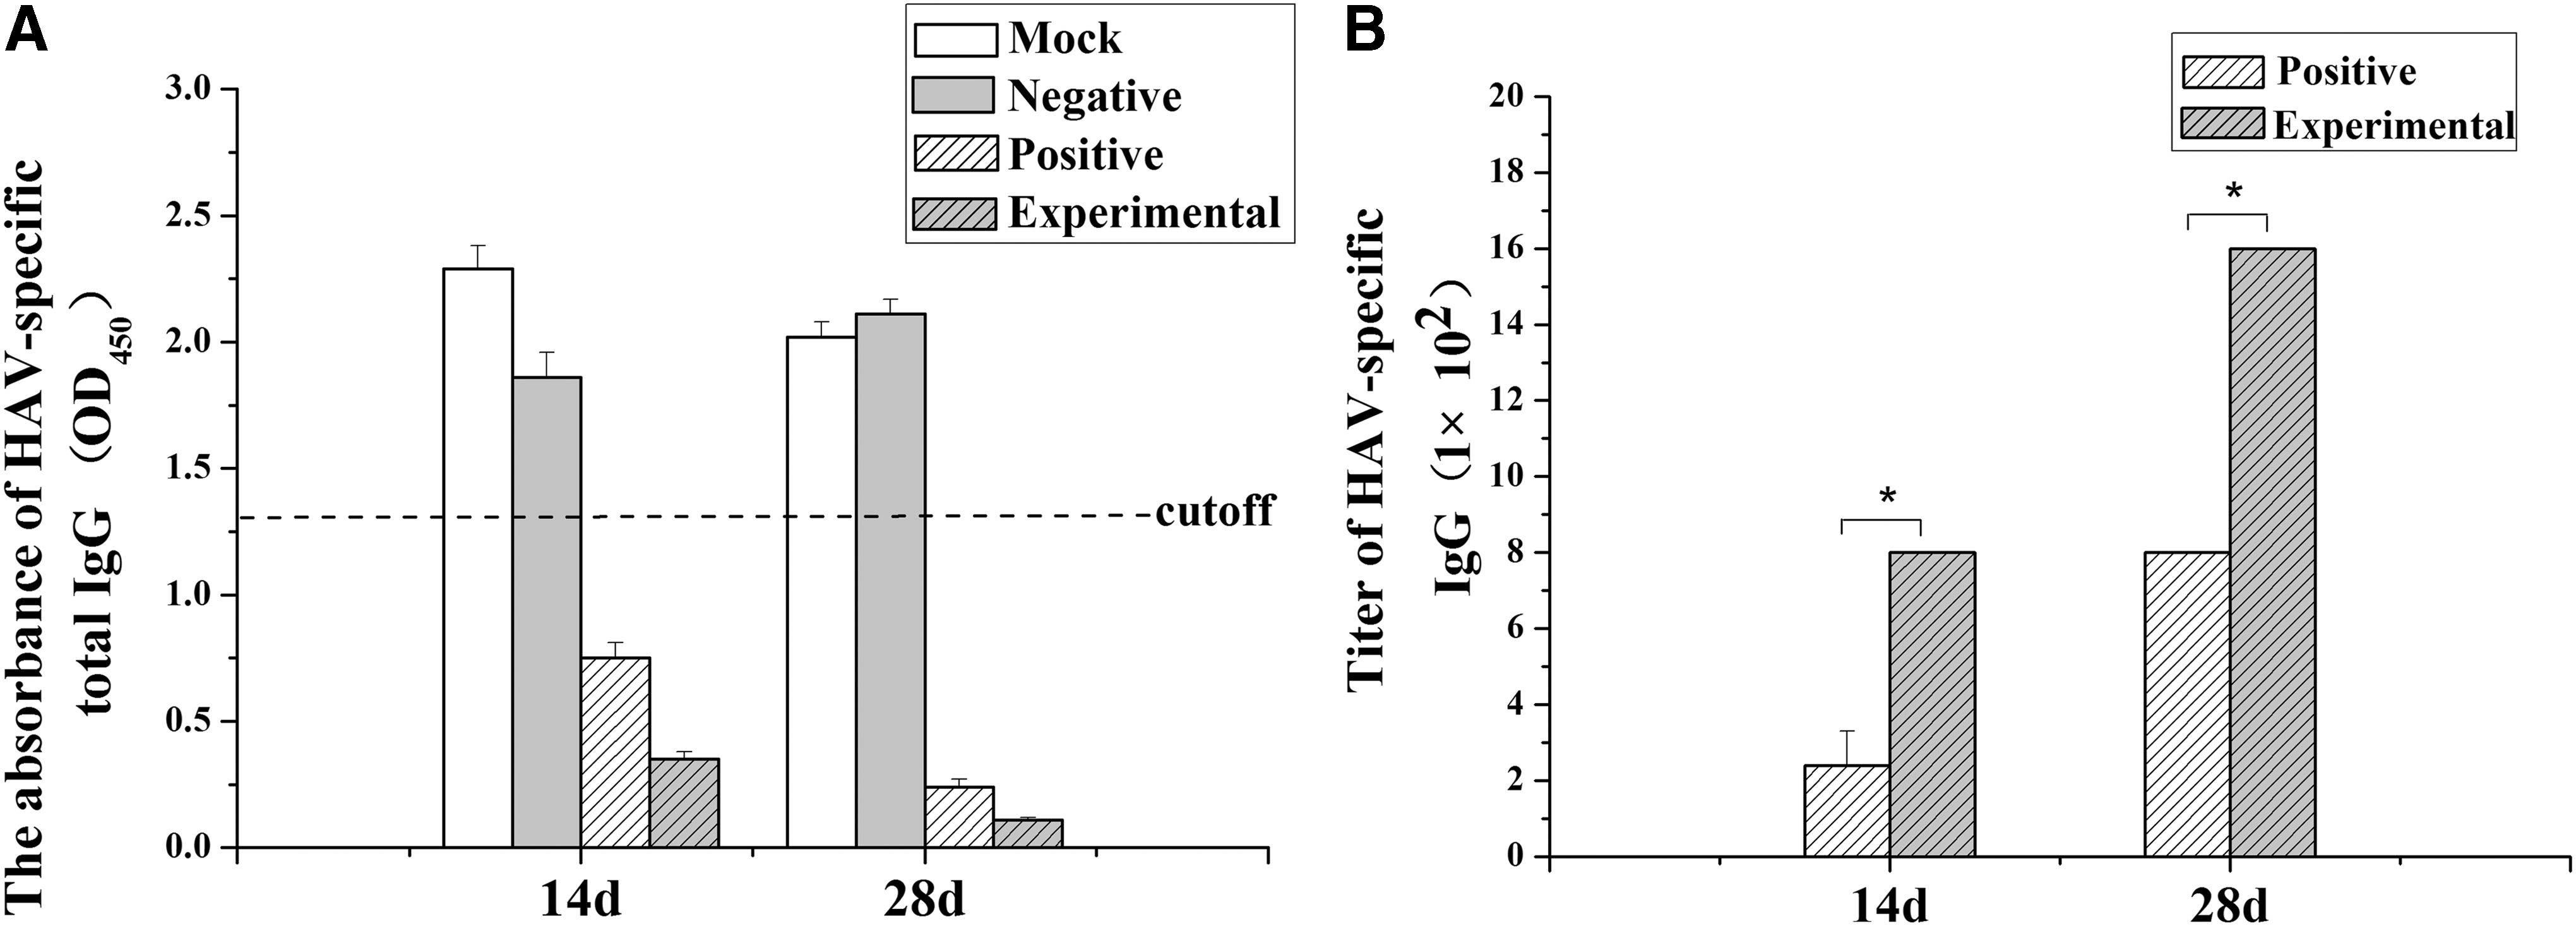
HAV-specific total IgG levels. Mice were immunized with sterile water alone (Mock), or HTCC alone (Negative), or live attenuated HAV vaccine alone (Positive), or HTCC and live attenuated HAV vaccine (Experimental). All results are shown as mean ± SD. The error bars represent the SD with eight mice per group. Cutoff value was calculated using the formula 1/2 (ODpositive control + ODnegative control).
HAV-specific IgG subclass levels
We analyzed the sera on day 28 of the immunized mice described above for their levels of HAV-specific IgG subclasses by an indirect ELISA method. The titers of IgG1 and IgG2a in experimental group were higher than positive group (p = 0.015 and p = 0.020, respectively; Fig. 4A, B). The type of immune response was evaluated by the ratio of IgG2a/IgG1. The results showed a significantly higher ratio of IgG2a/IgG1 in experimental group (p = 0.040; Fig. 4C) and demonstrated that a Th1-type cell immune response was elicited by immunization with HTCC+HAV compared with HAV alone.

HAV-specific IgG subclass levels. Mice were immunized with sterile water alone (Mock), or HTCC alone (Negative), or live attenuated HAV vaccine alone (Positive), or HTCC and live attenuated HAV vaccine (Experimental). Sera samples of these mice were analyzed for their HAV-specific
Splenocyte proliferation
Splenocytes were obtained from the immunized mice on day 28 and stimulated by ConA (5 μg/mL) or culture medium for 68 h before the MTS assay was performed. Splenocyte proliferation SI measured at A490nm in experimental group was higher than positive group (p = 0.021), and significantly higher than mock group and negative group (p = 0.0078 and p = 0.0050, respectively; Table 1).
Data are presented as mean ± standard deviation (n = 8).
Indicates highly significant difference compared with the mock group and negative group by the unpaired t test (p < 0.01).
Indicates significant difference compared with positive group by the unpaired t test (p < 0.05).
SI, stimulation index.
The percentages of CD4+ and CD8+ T lymphocytes in the peripheral blood
On day 28, the percentages of CD4+ T lymphocytes in the peripheral blood in experimental group were significantly higher than mock group, negative group, and positive group (p = 0.045, p = 0.012, and p = 0.012, respectively; Table 2; Fig. 5). Compared to the other three groups, experimental group showed a slightly higher ratio of CD4+/CD8+, but there were no significant differences (p > 0.05). In the percentages of CD8+ T lymphocytes, there were no significant differences among the four groups (p > 0.05).
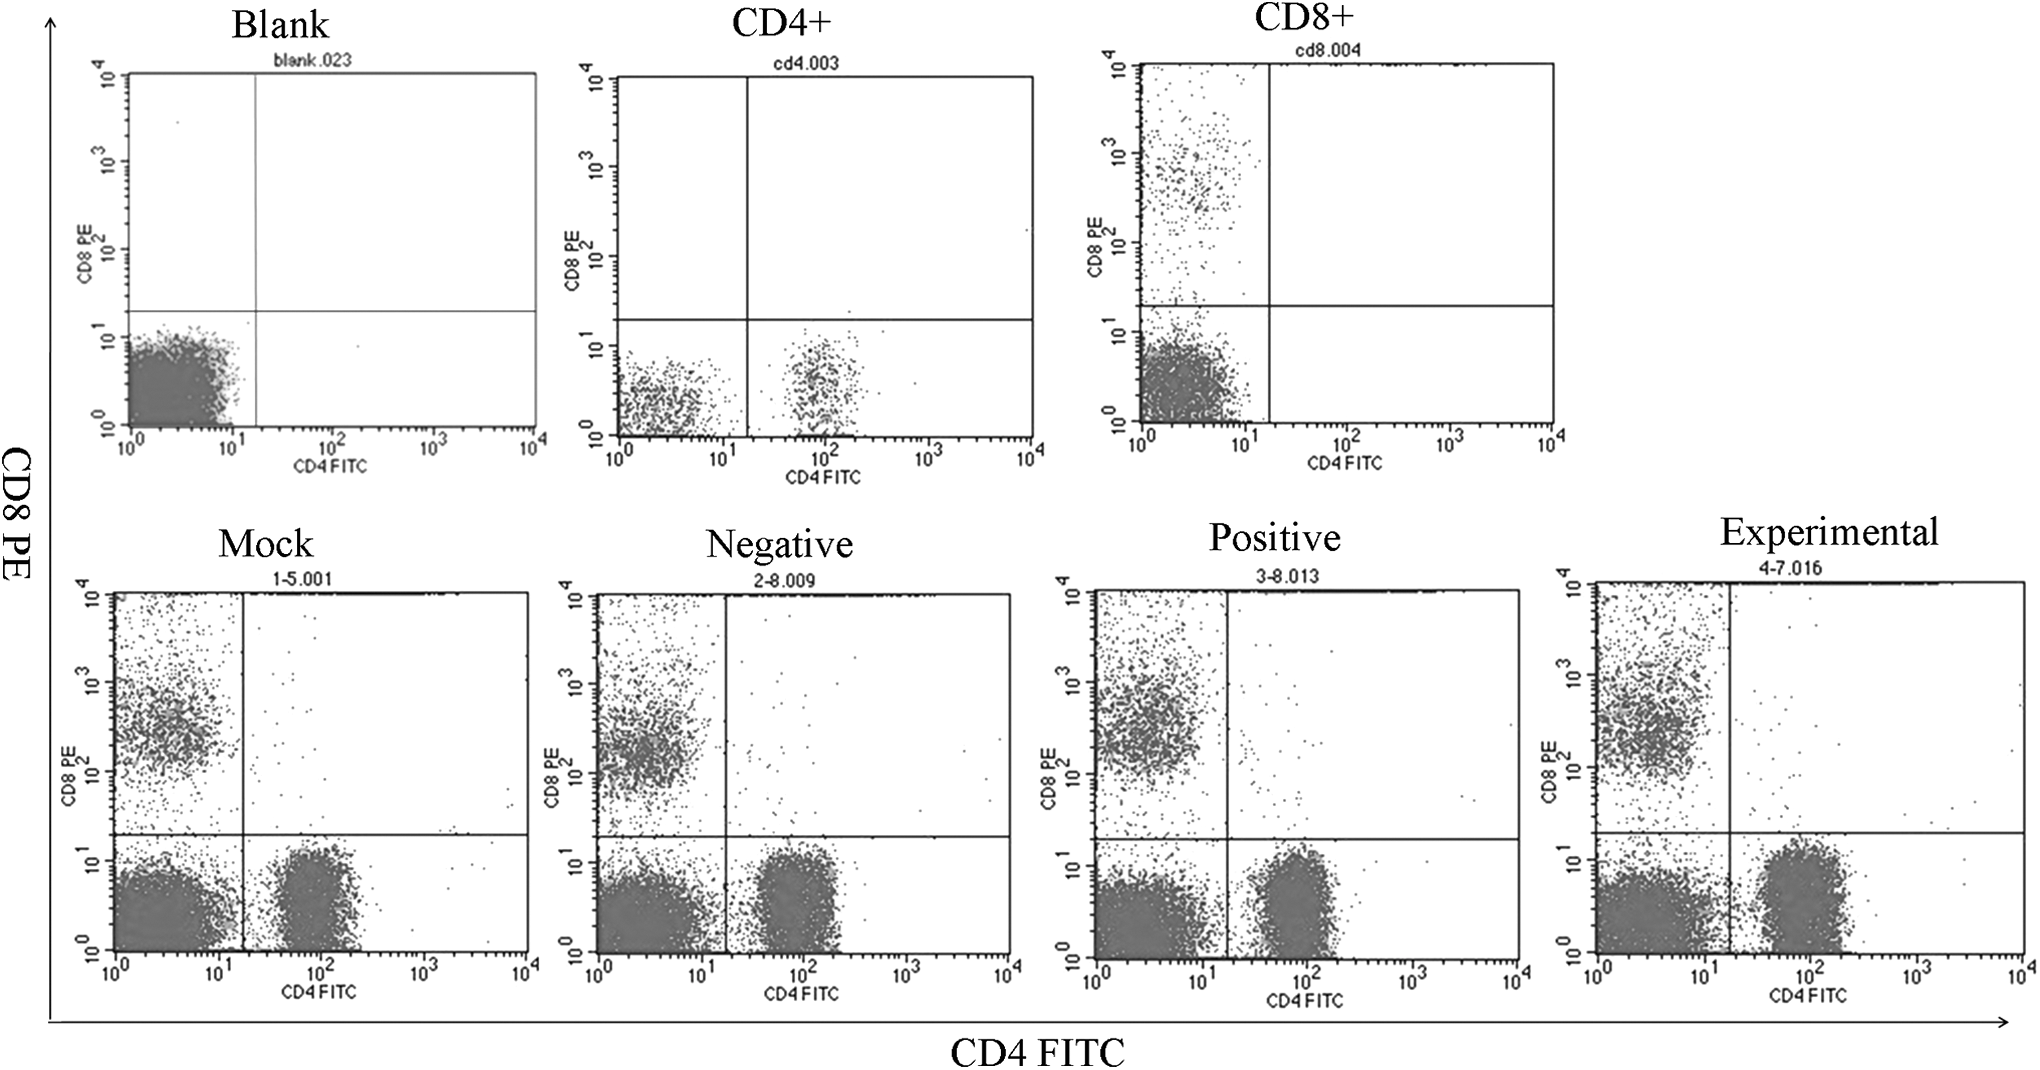
A representative flow cytometry result of CD4+ and CD8+ T lymphocytic subclasses. Mice were immunized with sterile water alone (Mock), or HTCC alone (Negative), or live attenuated HAV vaccine alone (Positive), or HTCC and live attenuated HAV vaccine (Experimental). FITC, fluoresceine isothiocyanate; PE, phycoerythrin.
Data are presented as mean ± standard deviation (n = 8).
Indicates significant difference compared with the other groups by the unpaired t test (p < 0.05).
Discussion
Chitosan-based formulations are found to trigger both humoral and cellular responses and represent the most promising candidates for vaccine adjuvant (28). Therefore, it is essential to make best use of the advantages of chitosan and bypass the disadvantages by chemical modification. Positive charged HTCC not only enhances its water solubility but also improves the cationic nature of HTCC, which enhances its interactions with antigens or cell membranes, boosting antigen adsorption/encapsulation and cellular internalization, as well as extending the antigen residence time (35).
As the major class of immunoglobulin in serum, IgG antibodies generally represent the level of humoral immune responses. In this study, HTCC as live attenuated vaccine adjuvant not only generated stronger HAV-specific IgG antibodies but also produced HAV-specific IgG antibodies earlier. It is demonstrated that HTCC has an obvious ability to improve the vaccine to generate stronger systemic humoral immune responses after vaccination. Similar results are showed in Wu et al. studies (36).
IgG subclass expression reflects the subset of CD4+ T helper (Th) cells polarized in immune responses leading to the different mechanisms of host protection process (15) and is associated with multiple factors, containing the prevailing cytokine environment, such as the Th2 cytokine interleukin-4 (IL-4), which mainly induces switching to IgG1 and IgE (8,33), whereas interferon-γ (IFN-γ) induces switching to IgG2a, IgG2b, and IgG3 (22). IgG1 is normally the most abundant subclass and dominated with antibody mediated responses. IgG2a is associated with clearing virus infections. Among IgG subclasses, IgG2a and 2b are generally considered to be the most potent for activating immunity responses and dominating antiviral immunity and autoimmune diseases (7,9,21,24). IgG1 corresponds to Th2-biased responses, while IgG2a corresponds to Th1-biased responses (15). In this study, we evaluated the production levels of serum HAV-specific IgG1 and IgG2a antibodies and calculated the IgG2a/IgG1 ratio as the indicative of Th1/Th2 immune responses. Results showed that HTCC enhanced HAV-specific IgG1 and IgG2a antibody titers that were consistent with the increase of total IgG levels, although Th1 type cytokine stimulated the B cells to generate IgG2a antibodies, while inhibit IgG1 production. And almost the same moderate levels of IgG1 and IgG2a antibodies were observed, showing a mixed humoral/cellular (Th1/Th2) immune response. The increased IgG2a/IgG1 ratio confirmed that HTCC as live attenuated vaccine adjuvant tended to induce a Th1 immune response, as well as IgG2a class switching. HTCC had the potential to prolong the antigen residence time and antigen permeation due to positive surface charges, resulting in a boosted cellular response (36). A new study found that HTCC as a Th1 cell adjuvant might be associated with the DNA sensing cGAS–STING pathway (5,26).
Lymphocyte proliferation is a crucial event in the activation cascade of both cellular and humoral immune responses (6). Splenocytes induced by ConA in vitro may be used as a method to evaluate splenocyte activity (6). Mice immunized with HTCC and live attenuated HAV vaccine showed a definite and clear synergistic effect on splenocyte proliferation induced by ConA. It was indicated that HTCC coadministered with live attenuated HAV vaccine could significantly increase the activation of lymphocytes. The similar results had been showed in another study (10). Otherwise, the ability of the HTCC to drive the expansion of CD4+ CD8− T lymphocytes and CD4− CD8+ T lymphocytes in peripheral blood was also examined. CD4+ CD8− and CD4− CD8+ T lymphocytes play an important role in host resistant to pathogen infection. The CD4+ CD8− is the surface marker of Th cells that can regulate immune reactivity and cytokine secretions, as well as augment the ability of B cells to produce antibodies (4), and participate in the adaptive immune responses, while CD8+ CD4− is expressed on cytotoxic T cells, which is classified as a predefined cytotoxic role within the immune system (19) that causes direct cytolysis of infected target cells (3,29). Reductions in CD4+ T cell counts have been associated with increased susceptibility to subsequent infections (25), and good vaccine adjuvant is a useful tool for directing the immune response toward the desired CD4+ T helper cell response to combat different types of pathogens (11). In our study, HTCC stimulated a significant CD4+ T lymphocyte expansion in experimental group; no CD8+ T lymphocyte expansion was detected. It can be proposed that positively charged HTCC triggered immune responses, as well as enhanced the ability of B cells to produce antibodies as discussed above.
In conclusion, these results showed that HTCC provided vaccine adjuvant activity when coadministered with live attenuated HAV vaccine by intraperitoneal route. Vaccination using HTCC as an adjuvant increased serum HAV-specific IgG titer, as well as IgG2a class switching compared with the live attenuated HAV vaccine alone. Furthermore, it was also related to splenocyte proliferation and increases of CD4+ T lymphocyte expansion and CD4+/CD8+ T cell ratio in the peripheral blood of immunized mice. To the best of our knowledge, our findings are the first to demonstrate that HTCC is safe and effective in inducing a good antibody response and stimulating Th1-biased immune responses for live attenuated vaccine. According to current study, our future intention focuses on two aspects. One is to study whether HTCC has an ability to enhance mucosal immune responses; the other is to explore the best immunization route for human use, such as oral vaccinations.
Footnotes
Acknowledgment
This work was financially supported by Public Technology Research and Social Development Project of Zhejiang Province, China (Grant No. 2014C33276).
Author Disclosure Statement
No competing financial interests exist.