
Abstract
Stage of liver fibrosis is critical for treatment decision and prediction of outcomes in chronic hepatitis C (CHC) patients. We evaluated the diagnostic accuracy of transient elastography (TE)-FibroScan and noninvasive serum markers tests in the assessment of liver fibrosis in CHC patients, in reference to liver biopsy. One-hundred treatment-naive CHC patients were subjected to liver biopsy, TE-FibroScan, and eight serum biomarkers tests; AST/ALT ratio (AAR), AST to platelet ratio index (APRI), age-platelet index (AP index), fibrosis quotient (FibroQ), fibrosis 4 index (FIB-4), cirrhosis discriminant score (CDS), King score, and Goteborg University Cirrhosis Index (GUCI). Receiver operating characteristic curves were constructed to compare the diagnostic accuracy of these noninvasive methods in predicting significant fibrosis in CHC patients. TE-FibroScan predicted significant fibrosis at cutoff value 8.5 kPa with area under the receiver operating characteristic (AUROC) 0.90, sensitivity 83%, specificity 91.5%, positive predictive value (PPV) 91.2%, and negative predictive value (NPV) 84.4%. Serum biomarkers tests showed that AP index and FibroQ had the highest diagnostic accuracy in predicting significant liver fibrosis at cutoff 4.5 and 2.7, AUROC was 0.8 and 0.8 with sensitivity 73.6% and 73.6%, specificity 70.2% and 68.1%, PPV 71.1% and 69.8%, and NPV 72.9% and 72.3%, respectively. Combined AP index and FibroQ had AUROC 0.83 with sensitivity 73.6%, specificity 80.9%, PPV 79.6%, and NPV 75.7% for predicting significant liver fibrosis. APRI, FIB-4, CDS, King score, and GUCI had intermediate accuracy in predicting significant liver fibrosis with AUROC 0.68, 0.78, 0.74, 0.74, and 0.67, respectively, while AAR had low accuracy in predicting significant liver fibrosis. TE-FibroScan is the most accurate noninvasive alternative to liver biopsy. AP index and FibroQ, either as individual tests or combined, have good accuracy in predicting significant liver fibrosis, and are better combined for higher specificity.
Introduction
A
Over the past decade, researchers developed several noninvasive methods; imaging techniques and serum biomarkers, hoping to replace liver biopsy. The ideal noninvasive marker for evaluating liver fibrosis should be available, simple, inexpensive, reliable, safe, and well proved. Also, it should be helpful in the assessment of liver disease progression (2,42,44).
Transient elastography (TE)-Fibroscan is a simple noninvasive imaging technique, well accepted by the patients, and can be frequently repeated according to the need (24).
Serum biomarkers are either direct or indirect; the direct biomarkers include proteins involved in the synthesis or degradation of hepatic extracellular matrix (ECM) during the fibrosis process (2,21,32,33), while the indirect biomarkers reflect changes in liver functions related to liver inflammation, but they do not correlate with ECM turnover (2,32). Indirect serum biomarkers involve simple laboratory tests, easily available and included in the routine monitoring and investigations of patients with chronic liver disease (19). Combinations of indirect biomarkers are used in calculations to create different score models to assess liver fibrosis.
In the current study, we evaluated the diagnostic accuracy of eight different serum biomarkers tests; “AST/ALT ratio (AAR), AST to platelet ratio index (APRI), age-platelet index (AP index), Fibrosis quotient (FibroQ), Fibrosis 4 index (FIB-4), cirrhosis discriminant score (CDS), King score, and Goteborg University Cirrhosis Index (GUCI)” and TE-FibroScan in the assessment of liver fibrosis stage in treatment-naive CHC Egyptian patients. Results were compared to liver fibrosis stage assessed histopathologically by METAVIR scoring system of liver biopsy samples.
Patients and Methods
One hundred treatment-naive CHC patients were included in this cross-sectional study. HCV infection was diagnosed by anti-HCV antibodies testing and detection of HCV-RNA by real time-polymerase chain reaction. Patients with previous anti-HCV therapy, HBV coinfection, decompensated liver disease, hepatocellular carcinoma, body mass index >30, and presence of absolute contraindication for liver biopsy were excluded from this study.
Informed consent was obtained from all patients before participation in the study. The study was approved by Faculty of Medicine, Cairo University Ethics Committee, and was conducted according to the ethics guidelines of the Declaration of Helsinki.
Patients were subjected to detailed history, thorough clinical examination, liver stiffness (LS) measurement by TE-FibroScan, liver biopsy, and routine laboratory tests, including complete blood picture (CBC), aspartate aminotransferase (AST), alanine aminotransferase (ALT), total bilirubin, serum albumin, and prothrombin time (PT)-international normalized ratio (INR).
LS measurement was performed by a single experienced operator blinded to patients' clinical and laboratory data using a TE-FibroScan instrument (EchosensTM, Paris, France). Interpretation of measurement as valid required more than 10 successful acquisitions, with a success rate of at least 60% and an interquartile range lower than 30% (9).
Ultrasound-guided liver biopsy was performed within a week of LS measurement. All samples were examined by a single pathologist, blinded to the results of the noninvasive methods. Fibrosis was staged according to the METAVIR scoring system from F0 to F4 (4). Significant liver fibrosis was defined as METAVIR fibrosis scores of ≥2 (F2, F3, and F4).
The following eight serum biomarkers tests were calculated according to previously published equations and evaluated; AAR (48), APRI (47), AP index (34), FibroQ (18), FIB-4 (46), CDS (5), King score (10), and GUCI (20).
The performance of a noninvasive diagnostic method was evaluated by calculating the area under the receiver operating characteristic (AUROC) curve, taking liver biopsy as the reference standard (17). AUROC values close to 1 indicate a high diagnostic accuracy (36).
Statistical analyses
All statistical calculations were done using computer programs SPSS (Statistical Package for the Social Science) for Microsoft Windows, Version 16.0. Chicago, SPSS, Inc. Continuous data are presented as mean ± standard deviation, while categorical data are presented as number (percent). p-Value less than 0.05 was considered statistically significant. Student t-test is used when appropriate. Spearman correlation was done among the METVIR score, serum biomarkers, and the elastography. The diagnostic performance of the TE-FibroScan and serum markers was assessed by measuring the AUROCs. Diagnostic accuracy was also evaluated by comparing the sensitivity, specificity, positive predictive value (PPV), and negative predictive value (NPV).
Results
Patients' clinical data, laboratory data, and histopathological classification are shown in Table 1.
Data are presented as number (%) and mean ± SD.
ALT, alanine aminotransferase; AST, aspartate aminotransferase; BMI, body mass index; HCV, hepatitis C virus; INR, international normalized ratio; PT, prothrombin time; T. Bil, total bilirubin.
The mean values of TE-FibroScan and indirect serum biomarkers tests showed statistically significant increase as the stage of liver fibrosis advanced, except for AAR which also increased as fibrosis advanced, but did not reach statistical significance (Table 2).
p-Value ≤0.05 is significant.
p < 0.05 relative to F4.
<0.01 relative to F4.
< 0.01 relative to F2, ** p < 0.01 relative to F3, *** p < 0.01 relative to F4.
AAR, AST/ALT ratio; AP index, age-platelet index; APRI, AST to platelet ratio index; CDS, cirrhosis discriminate score; FIB-4, fibrosis 4 index; FibroQ, fibrosis quotient; GUCI, Goteborg University cirrhosis index; TE, transient elastography.
The ability of TE-FibroScan and indirect serum biomarkers tests to discriminate between nonsignificant (<F2) and significant (≥F2) liver fibrosis was statistically highly significant (p < 0.001) except for AAR (p = 0.4) (Table 3).
p-Value ≤0.05 is significant.
Diagnostic accuracy of indirect serum biomarkers and TE-FibroScan in prediction of significant fibrosis (F ≥ 2) in 100 HCV patients is shown in Table 4 and Figures 1 –3. TE-FibroScan was found superior to other noninvasive markers tested, in prediction of significant fibrosis (F ≥ 2), with cutoff value of 8.5, 83% sensitivity, 91.5% specificity, PPV of 91.2%, and NPV of 84.4% with AUROC 0.90. AP index and FibroQ showed the highest diagnostic accuracy in prediction of significant fibrosis (F ≥ 2) among indirect serum biomarkers with AUROC 0.8, sensitivity 73.6%, and specificity 70.2% and 68.1%, respectively. Combined AP index and FibroQ further increased their diagnostic accuracy with AUROC 0.83, sensitivity 73.6%, and specificity 80.9%.
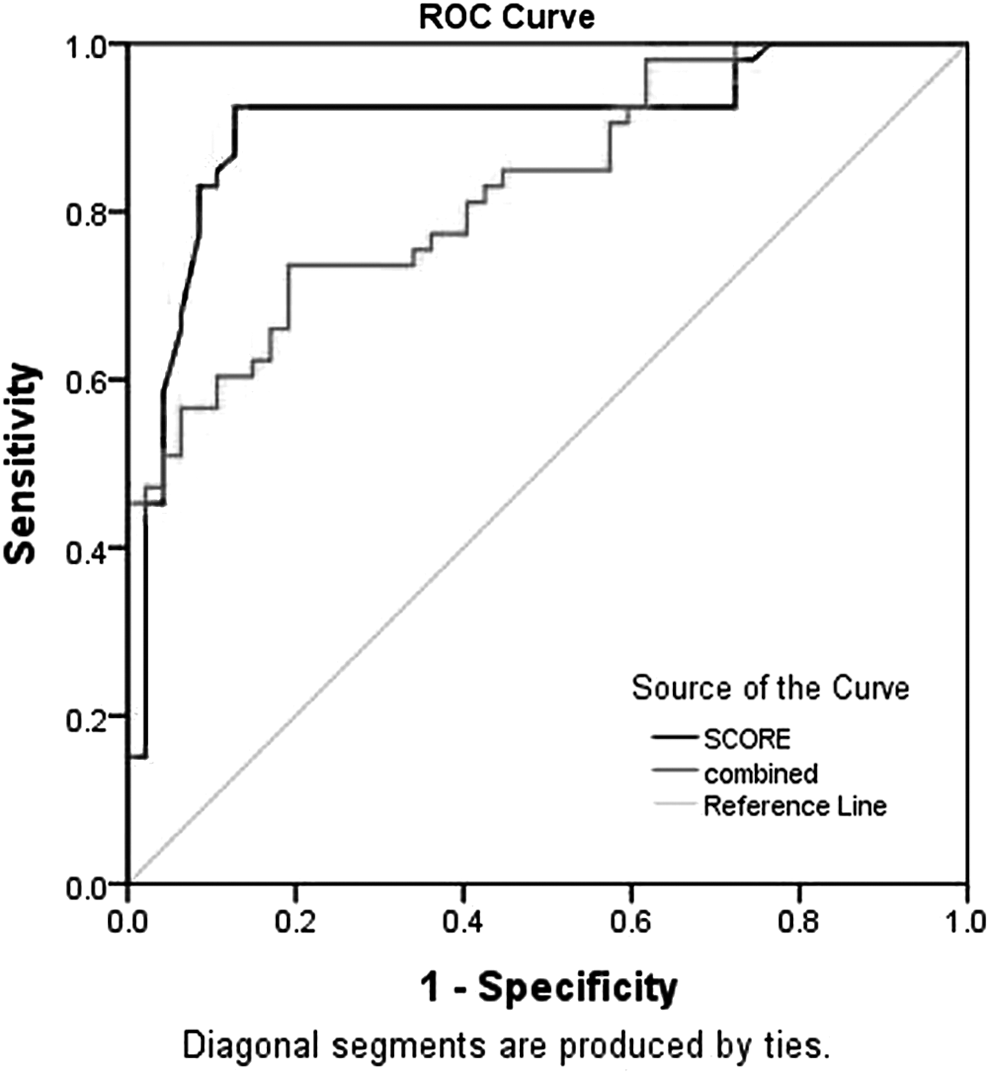
ROC curve for TE-FibroScan and combined AP index and FibroQ. AP index, age-platelet index; FibroQ, fibrosis quotient; ROC, receiver operating characteristic; TE, transient elastography.
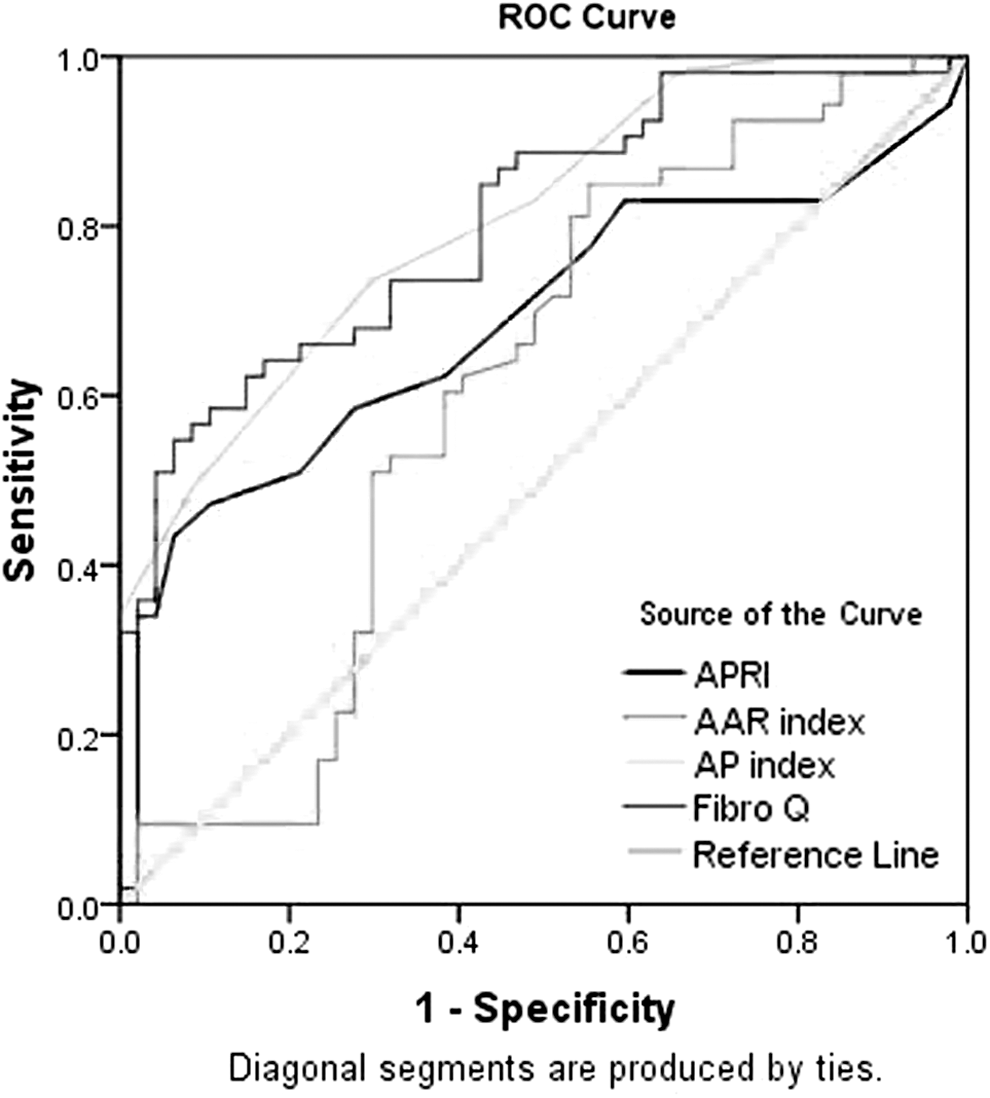
ROC curve for APRI, AAR, AP index, and FibroQ. AAR, AST/ALT ratio; APRI, AST to platelet ratio index.
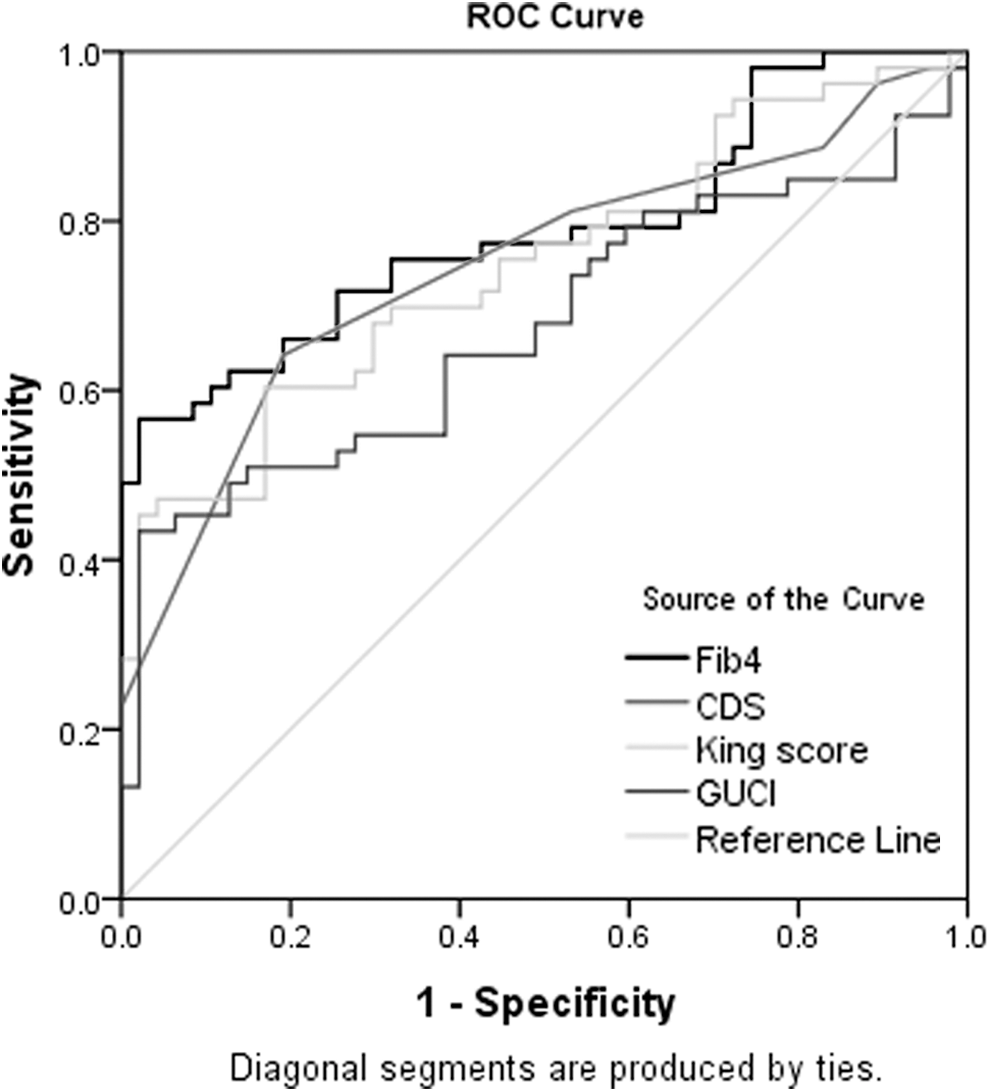
ROC curve for FIB-4, CDS, King score, and GUCI. FIB-4, fibrosis 4 index; GUCI, Goteborg University cirrhosis index.
AUROC, area under the receiver operating characteristic curve; LR (−), negative likelihood ratio; LR (+), positive likelihood ratio; NPV, negative predictive value; PPV, positive predictive value; SEN, sensitivity; SPE, specificity.
There was positive correlation between the stage of liver fibrosis and TE-FibroScan (r = 0.8, p = 0.001) and the eight studied serum biomarkers; AAR (r = 0.3, p = 0.007), APRI (r = 0.4, p = 0.001), AP index (r = 0.6, p = 0.001), FibroQ (r = 0.6, p = 0.001), FIB-4 (r = 0.6, p = 0.001), CDS (r = 0.5, p = 0.001), King score (r = 0.5, p = 0.001), and GUCI (r = 0.4, p = 0.001).
Discussion
Validation of noninvasive alternatives to liver biopsy for assessment of liver fibrosis stage is required especially in areas with hyperendemic HCV infection and in low-income countries. In addition to the high cost of liver biopsy (40), it is associated with being generally not accepted by patients especially when repeated biopsy is required for follow-up (14).
Up till now, no single noninvasive test is considered ideal alternative to liver biopsy. A possible explanation is the difficulty to achieve an area under receiver operating characteristic curve >0.90, even for a perfect marker when a range of accuracies of biopsy and a range of prevalence of fibrosis are taken into account (28).
In the present study, we evaluated diagnostic accuracy of TE-FibroScan and eight serum biomarkers tests in assessing the stage of liver fibrosis and in predicting significant fibrosis (F ≥ 2). The presence of significant fibrosis (F ≥ 2) is important in decision-making to start antiviral therapy in CHC patients (41).
TE-FibroScan at cutoff value 8.5 kPa diagnosed significant fibrosis (F ≥ 2) with sensitivity 83%, specificity 91.5%, PPV of 91.2%, and an NPV of 84.4% with AUROC 0.90. Our results are comparable to previous studies, including Egyptian CHC patients (13,29). Also, several multicenter studies reported the accuracy of TE-FibroScan in assessment of liver fibrosis (12,31).
We evaluated eight serum biomarkers tests (AAR, APRI, AP index, FibroQ, FIB-4, CDS, King score, and GUCI); including standard laboratory tests routinely performed to CHC patients that are available in every laboratory and of low cost. Cost effectiveness is very important in low-income countries as in Egypt; having the highest prevalence of HCV infection worldwide (30).
AP index and FibroQ had the highest diagnostic accuracy in predicting significant liver fibrosis (F ≥ 2) at cutoff 4.5 and 2.7, AUROC was 0.8 and 0.8 with sensitivity 73.6% and 73.6%, specificity 70.2% and 68.1%, PPV 71.1% and 69.8%, and NPV 72.9% and 72.3%, respectively. In accordance with our results, FibroQ was found superior to FIB 4, AAR, APRI, and Lok's model in predicting significant fibrosis in CHC patients (18,19). A recent study, including various noninvasive serum markers, reported diagnostic accuracy of AP index in predicting significant liver fibrosis with AUROC 0.75, but its accuracy was comparable to other studied parameters (22).
Several studies have attempted to combine different fibrosis tests to improve the diagnostic accuracy of liver fibrosis in CHC infection (7,25,43). In our study, combined AP index and FibroQ had AUROC 0.83 with sensitivity 73.6%, specificity 80.9%, PPV 79.6%, and NPV 75.7% for predicting significant liver fibrosis (F ≥ 2).
APRI, FIB-4, CDS, King score, and GUCI had intermediate accuracy in predicting significant liver fibrosis (≥F2) with AUROC 0.68, 0.78, 0.74, 0.74, and 0.67, respectively, while AAR had low accuracy in predicting significant liver fibrosis (≥F2). The intermediate accuracy of APRI (27), FIB-4 (16), and CDS (39) in assessing fibrosis in CHC has been reported. King score is applicable index for prediction of cirrhosis in CHC patients (6,10,11). AAR has been reported to have low diagnostic accuracy in detecting significant liver fibrosis (F ≥ 2) (1,22,23).
In conclusion, TE-FibroScan is the most accurate noninvasive alternative to liver biopsy. However, it cannot be used when patients are not suitable candidates (15,45). Also, TE-FibroScan availability is a considerable issue as it is limited to high-volume centers (26). Widespread adoption of noninvasive, easily available, and cost effective diagnostic tools is major contributor to healthcare improvement in low-income countries with limited resources, where cost is a limitation to proper medical care. AP index and FibroQ either as individual tests or combined have good accuracy in predicting significant liver fibrosis (F ≥ 2) and are better combined for higher specificity.
Footnotes
Acknowledgments
This research was supported by the Science and Technology Development Fund (STDF), Egypt, Grant No. 5380, basic and applied research.
Author Disclosure Statement
No competing financial interests exist.