
Abstract
The exact cause of altered dynamics in T cells compartment during HIV infection remains elusive to date. In this longitudinal study, the proliferation frequency of different T cell subsets was investigated in untreated HIV-1-infected Indian individuals stratified as rapid (R), viremic slow (VS), slow (S) progressors, and healthy controls. Ten healthy and 20 treatment-naive HIV-1-infected individuals were enrolled. Expression of Ki67 nuclear antigen was examined on HIV-specific T cell subsets in peripheral blood lymphocytes. Upon stimulation with HIV-1 Gag-C peptide pools, effector memory (EM) CD4 T cells (R vs. S, EM CD4, p < 0.05) of R progressors proliferated significantly compared with those of S progressors at baseline. However, central memory (CM) CD8 T cell subsets proliferated significantly in VS and S progressors compared with those in R progressors, wherein highest proliferation frequency of EM CD8 T cells was observed. At follow-up visit, the proliferation frequency of naive CD8 T cells was significantly higher in R progressors than S progressors (R vs. S naive CD8, p < 0.05). The findings suggest altered dynamics of different CD4+ and CD8+ T cell subsets in R, VS, and S progressors. The increase in CM T cell proliferation in VS and S progressors could be attributed to slower progression of the HIV infection. Hence, treatment strategies must be focused on restoring the homeostatic balance to restore T cell functionality.
Introduction
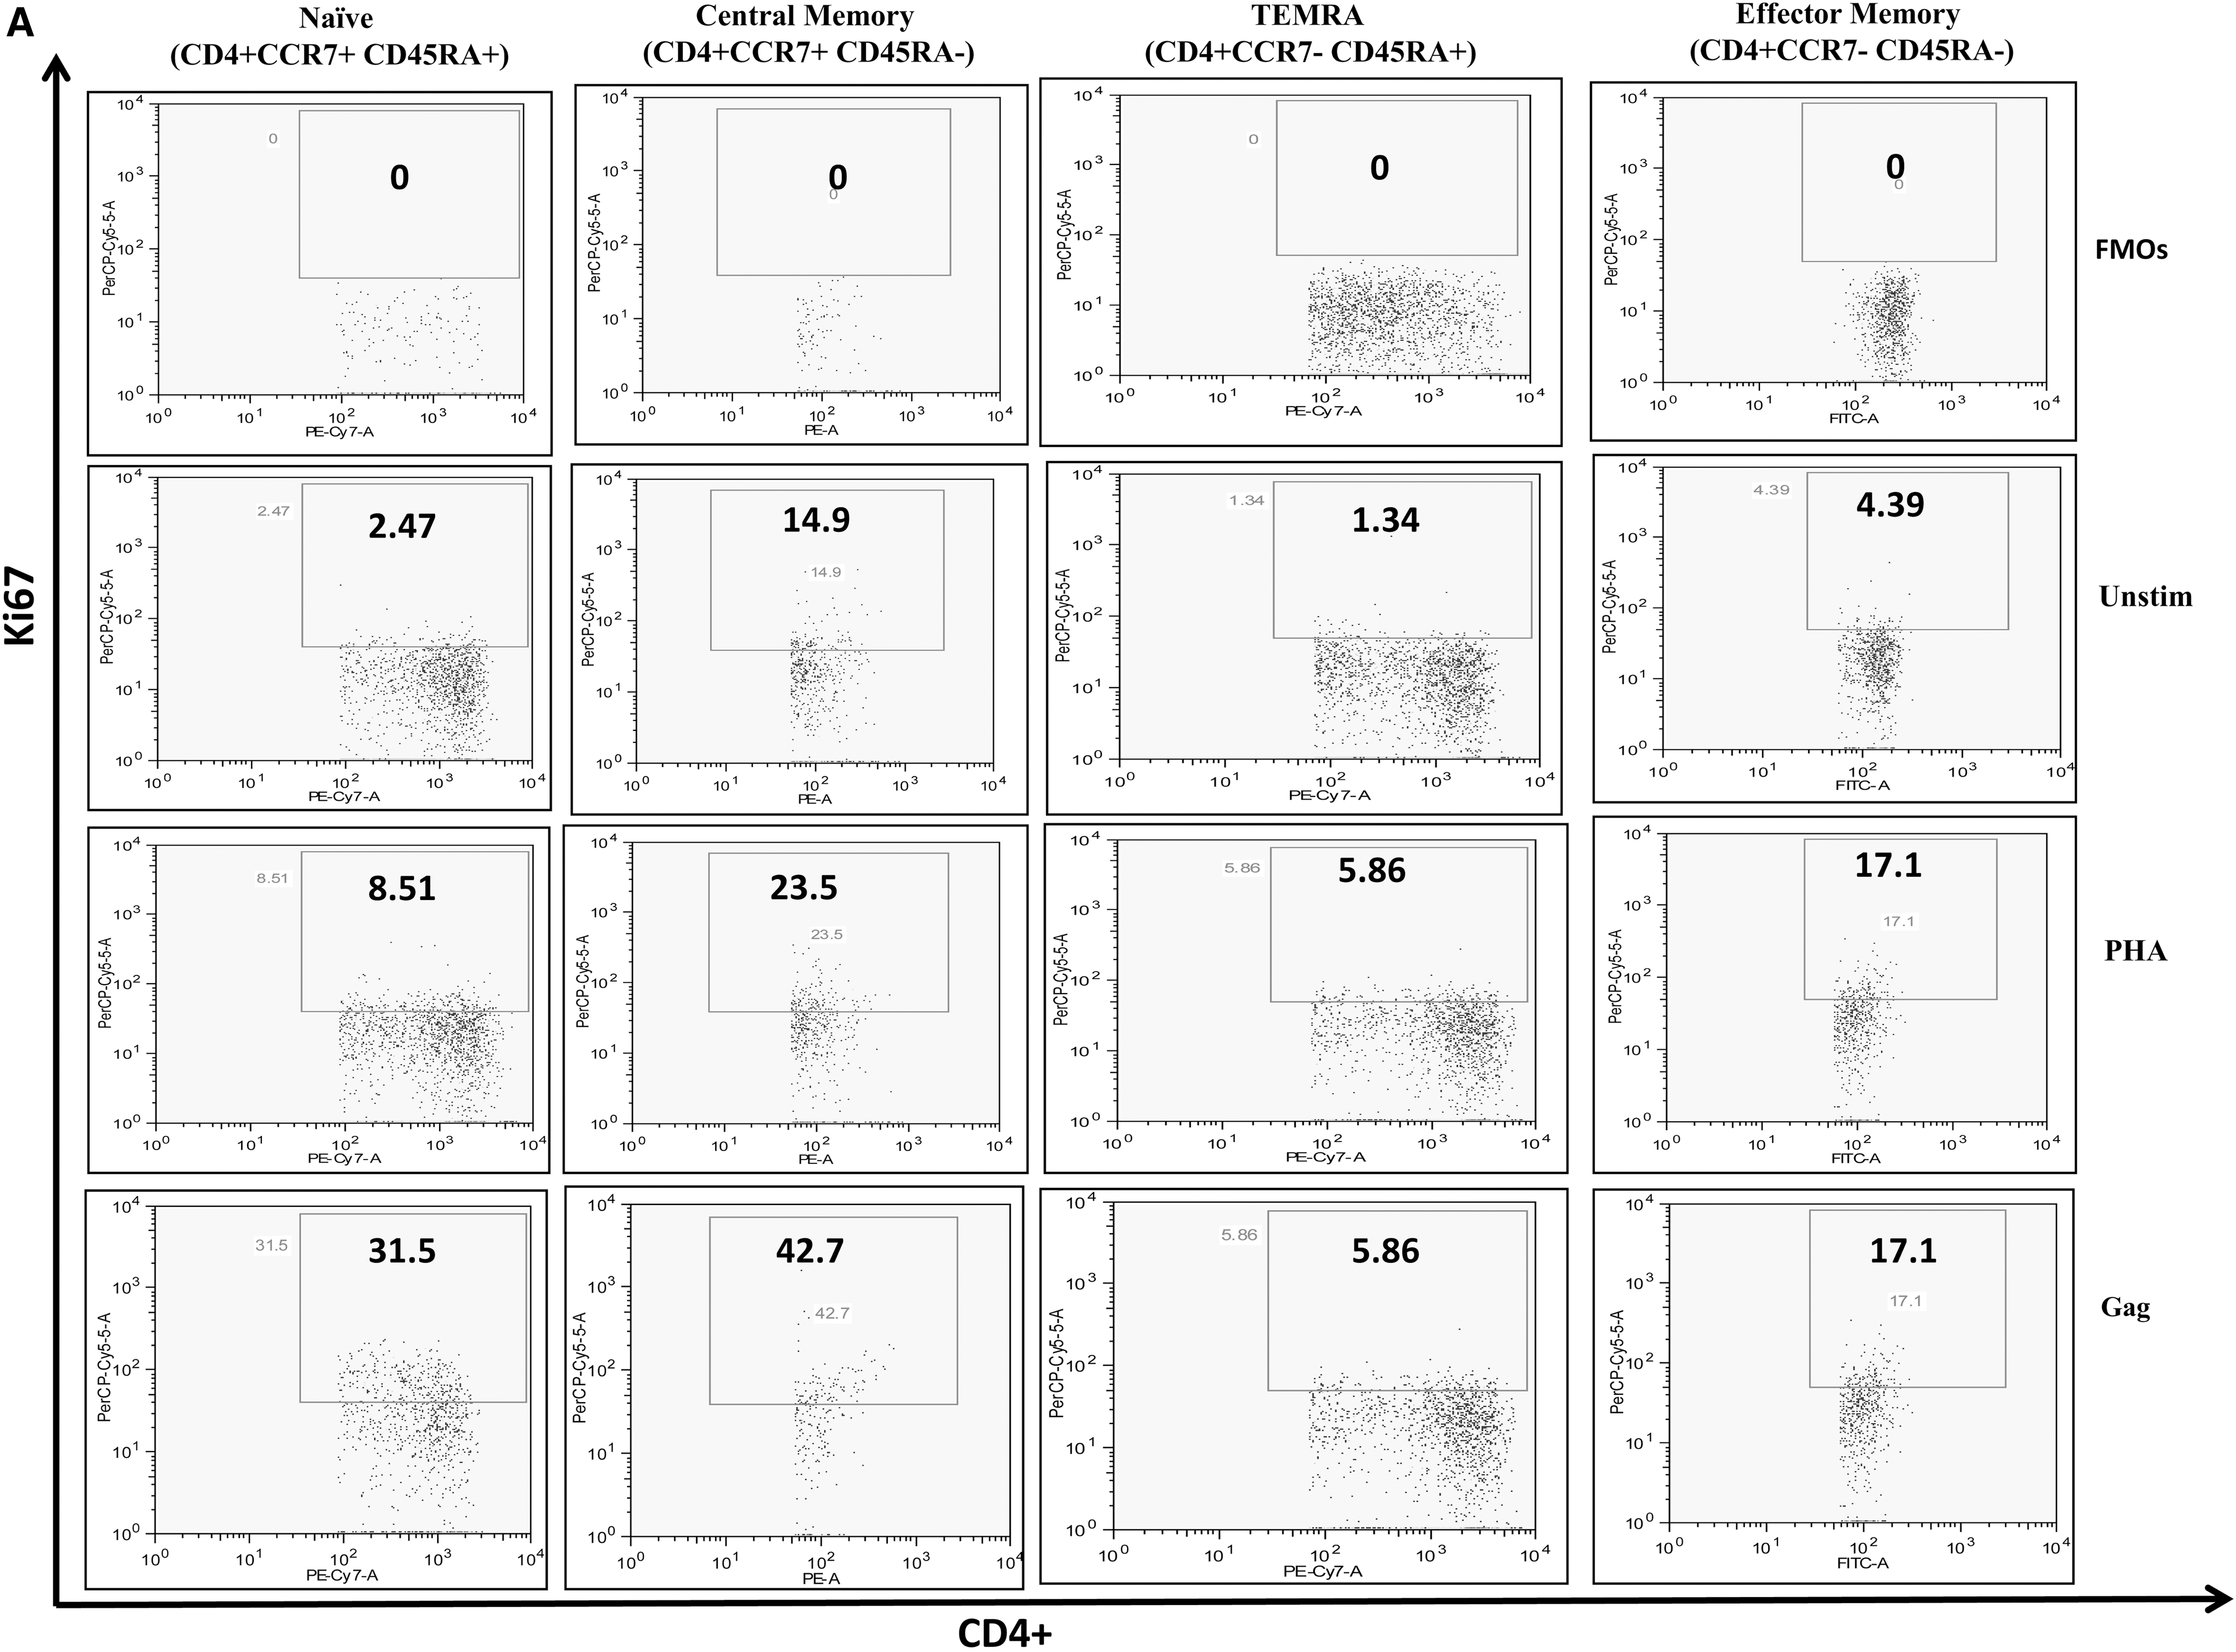
A
The dynamics of T cells in infected individuals have been assessed by several direct and indirect methods including deuterated glucose incorporation, in vivo labeling with bromodeoxyuridine (BrdU), Ki67 staining, differences in telomere length, and tracking of chromosomal abnormalities (10,27). Ki67 has emerged as the most reliable and popular proliferation marker in proliferation kinetics studies as it offers a number of benefits over other methods (30). Ki-67 is a nuclear antigen expressed only in proliferating cells mainly during the G2/M phase of the cell cycle (3,7), and many studies have reported high level of correlation between Ki67 and in vivo labeling with BrDu (8) with greater sensitivity. Keng and Siemann reported similar findings and supported the fact that detection of proliferation activities by Ki67 nuclear antigen is useful over other flow cytometric methods (12). As far as studies on HIV infection are concerned, conflicting results have been reported wherein few studies using Ki67 expression as marker of cell proliferation have shown that the mean proliferation rate of both naive and memory T cells increases in the peripheral blood after HIV-1 and Simian immunodeficiency virus (SIV) infection (19,20). Contrary to this, others have reported that the proliferation of CD8+ T cells increases dramatically while no significant change was observed in the proliferation of CD4+ T cell pool (27). Recent studies have also highlighted the fact that developmentally immature long-lasting CD4 memory T cells serve as reservoirs for HIV and persist in peripheral blood despite antiretroviral therapy (16). Wagner et al. also demonstrated that integrated HIV may promote proliferation, resulting in clonal expansion of latently HIV-infected cells that slows down the decay of viral reservoir even during treatment (33). These findings prompted us to analyze the significance of viremia and CD4 T cell count in HIV infection in relation to effector/memory cell populations and to further identify the subset of CD4/CD8 T cells that could serve as potential HIV reservoirs for long-term control of infection. Though studies have reported changes in CD4+ and CD8+ T cell population however the difference in proliferation capacity of different T cell subsets have not been explored to date (11,35).
To the best of our knowledge, no study has addressed the effects of HIV replication on the proliferative capacity of different subsets of CD4+ and CD8+ T cell lymphocyte, that is, naive (N), central memory (CM), effector memory (EM), and TEMRA (T effector memory cells re-expressing RA) in HIV-1 Subtype C infection. Hence attempts are required to fully understand how this alteration in proliferation of T cells sets the stage for long-term disease progression in infected individuals. Through this preliminary study, we aim to identify the factors responsible for slower disease progression in viremic slow (VS) and slow (S) progressors compared with rapid (R) progressors in the absence of ART. Thus, to better understand the dynamics of T cells, we undertook this longitudinal study to investigate the proliferation of different T cell subsets using Ki67 staining in Indian HIV-1-infected individuals. The findings presented here will have a great impact on current antiretroviral strategies. The results reported advocate that future treatment methodologies should not only focus on restoration of number of CD4 cells and suppression of viremia but should also divert the cycle to complete reconstitution of T cell homeostasis.
Materials and Methods
This longitudinal cohort study was conducted at the Immunology Division of the Department of Microbiology, All India Institute of Medical Sciences (AIIMS), New Delhi, from January 2016 to February 2017. Patients visit our center every 6 months for CD4 T cell count. The study was approved by the Institutional Ethics Committee. Written informed consent was obtained from all subjects.
Study population
Twenty treatment-naive HIV-1-infected subjects were enrolled and followed up after 6 months. They were further stratified into three groups based on their CD4+ T cell count and plasma viral load: R progressors: CD4+ < 350 cells/μL, duration <3–4 years, plasma HIV-RNA levels >10,000 copies/mL; VS progressors: CD4+ >500 cells/μL, duration >7 years, plasma HIV-RNA levels >10,000 copies/mL; and S progressors: CD4+ > 500 cells/μL, plasma HIV-RNA levels <10,000, duration >10 years. All the enrolled participants were asymptomatic, had heterosexual route of transmission, and did not have any kind of opportunistic infections. Ten HIV uninfected individuals (40% men) with no history of infection were included as healthy controls (HCs).
CD4+ T cell counts and viral RNA loads
CD4+ T cell count was performed on FACS Count™ system (Becton Dickinson, San Jose, CA), and COBAS TaqMan HIV-1 test, v2.0 (Roche Diagnostics), was employed for HIV-1 viral load quantitation.
Monoclonal antibodies
The following fluorochrome-conjugated antibody panel was used: allophycocynanin-H7 (APC-H7)-CD3, fluorescein isothiocyanate (FITC)-CD4+, Pacific Blue-CD8, phycoerythrin- Cy7 (PE-Cy7)-CD45RA, phycoerythrin (PE)-CCR7, and peridinin chlorophyll protein (PerCP)-Cy5.5-Ki67 (eBioscience, San Diego, CA). Based on the expression of CD45RA and CCR7 markers, CD4+ and CD8+ T cells were divided into naive (CD45RA+CCR7+, N), CM (CD45RA−CCR7+, CM), EM (CD45RA−CCR7−, EM), and terminally differentiated effector memory (CD45RA+CCR7−, TEMRA) as previously described by Mojumdar et al. (21).
Intracellular Ki67 staining
Intracellular staining for Ki67 was performed on cryopreserved peripheral blood mononulcear cells (PBMCs) isolated by ficoll gradient centrifugation. A pool of 121 overlapping peptides corresponding to consensus HIV-1 subtype “C” Gag peptide of 510 amino acids (NIH) (2 μg/mL) was used to stimulate PBMCs along with anti-CD28 and anti-CD49d costimulatory antibodies (1 μg/mL; eBioscience, San Diego, CA). Phytohaemagglutinin (PHA) (1 μg/mL; Sigma–Aldrich) was used as positive control. Cells without antigenic stimulation served as background controls. The cultures were incubated for 72 h at 37°C in a 5% CO2 incubator followed by washing with phosphate buffered saline (PBS). After staining with fluorochrome-conjugated monoclonal antibodies, cells were stained for Ki67 as per the recommended protocol.
Flow cytometric analysis
Flow cytometric analyses were performed on LSR-II flow cytometer (BD Biosciences) with 50,000 events acquired per sample. FlowJo software (Tree Star Version 6.4.7, CA) was used for analysis. The lymphocyte gate (G1) was defined on forward scatter and side scatter for each of the stimulation in the sample. CD3+ and CD4+ T cells were defined by the second gate (G2) and fluorescence minus one controls were used as negative controls to check the nonspecific staining.
Statistical analysis
All statistical analyses were performed using the STATA 7.0 software. Student's t tests were performed to compare the median differences between baseline and follow-up data. Kruskal–Wallis and Analysis of variance (ANOVA) tests were used to compare the proliferation of different subsets of CD4+ and CD8+ T cell population among HIV-infected groups at both time points. Correlations were performed using Spearman's ranked test. A p-value of <0.05 was considered statistically significant. Data are expressed as median (interquartile range) unless otherwise indicated.
Results
Demographic and clinical characteristics of the study population
The median age of HIV-infected individuals (60% men) was 35 (32–38) years. The median CD4+ T cell count at baseline and follow-up was 414 (332–572) and 523 (426–639) cells/μL, respectively. The median baseline plasma viral load was 15,250 (8,165–43,125) and 13,600 (730–37,800) copies/mL at baseline and follow up, respectively. Clinical characteristics of different groups are summarized in Table 1.
Values are expressed as median (IQR) unless stated otherwise.
IQR, interquartile range; R, rapid; S, slow; VS, viremic slow.
Frequency of CD4+ and CD8+ T cell subsets in HIV-infected individuals and HCs
We investigated changes in N, CM, EM, and TEMRA subsets of both CD4+ and CD8+ population in HIV-infected and HCs at both time points (0 and 6 months). Comparative analysis of CD4+ and CD8+ T subsets (N, CM, EM, and TEMRA) among HIV-infected subjects and HCs revealed significantly higher frequency of CD8+ CM cells in HIV-infected subjects (HIV: 33.95%; HC: 5.77%, p = 0.0039). In addition, there was a trend for higher proportion of EM CD4+ and CD8+ T cells in HIV-infected individuals (although not significant) than HCs (71.35% vs. 55.95% and 43.45% vs. 35.15%, respectively). This increase in memory T cell subsets was associated with a decline in naive CD8+ T cells in the infected study group (66.05% vs. 94.95%, p = 0.0039) (Supplementary Table S1; Supplementary Data are available online at

Frequency of proliferating CD4+ and CD8+ T cell subsets in HIV-infected individuals and HCs
To define baseline proliferating capacity of HIV-infected CD4+ and CD8+ T cell subsets, we first assessed the proportion of Ki67-expressing cells in each of the compartments and compared them with those observed in the HCs, in the absence of any ex vivo stimulation. In absence of ex vivo stimulation, most T cell subsets do not proliferate in culture, and this is what we reported in healthy subjects wherein CD4+ and CD8+ T cell subsets expressed very low and similar levels of Ki67. Both CD4+ and CD8+ T cells from the HIV-infected group showed a higher Ki67 expression with CM and EM subsets being the highest proliferating cells compared with their healthy T cell subset counterparts (Fig. 2). This increase in proportion of proliferating cells reached statistical significance for CD8+ CM (p < 0.05) and EM (p < 0.05) subsets.
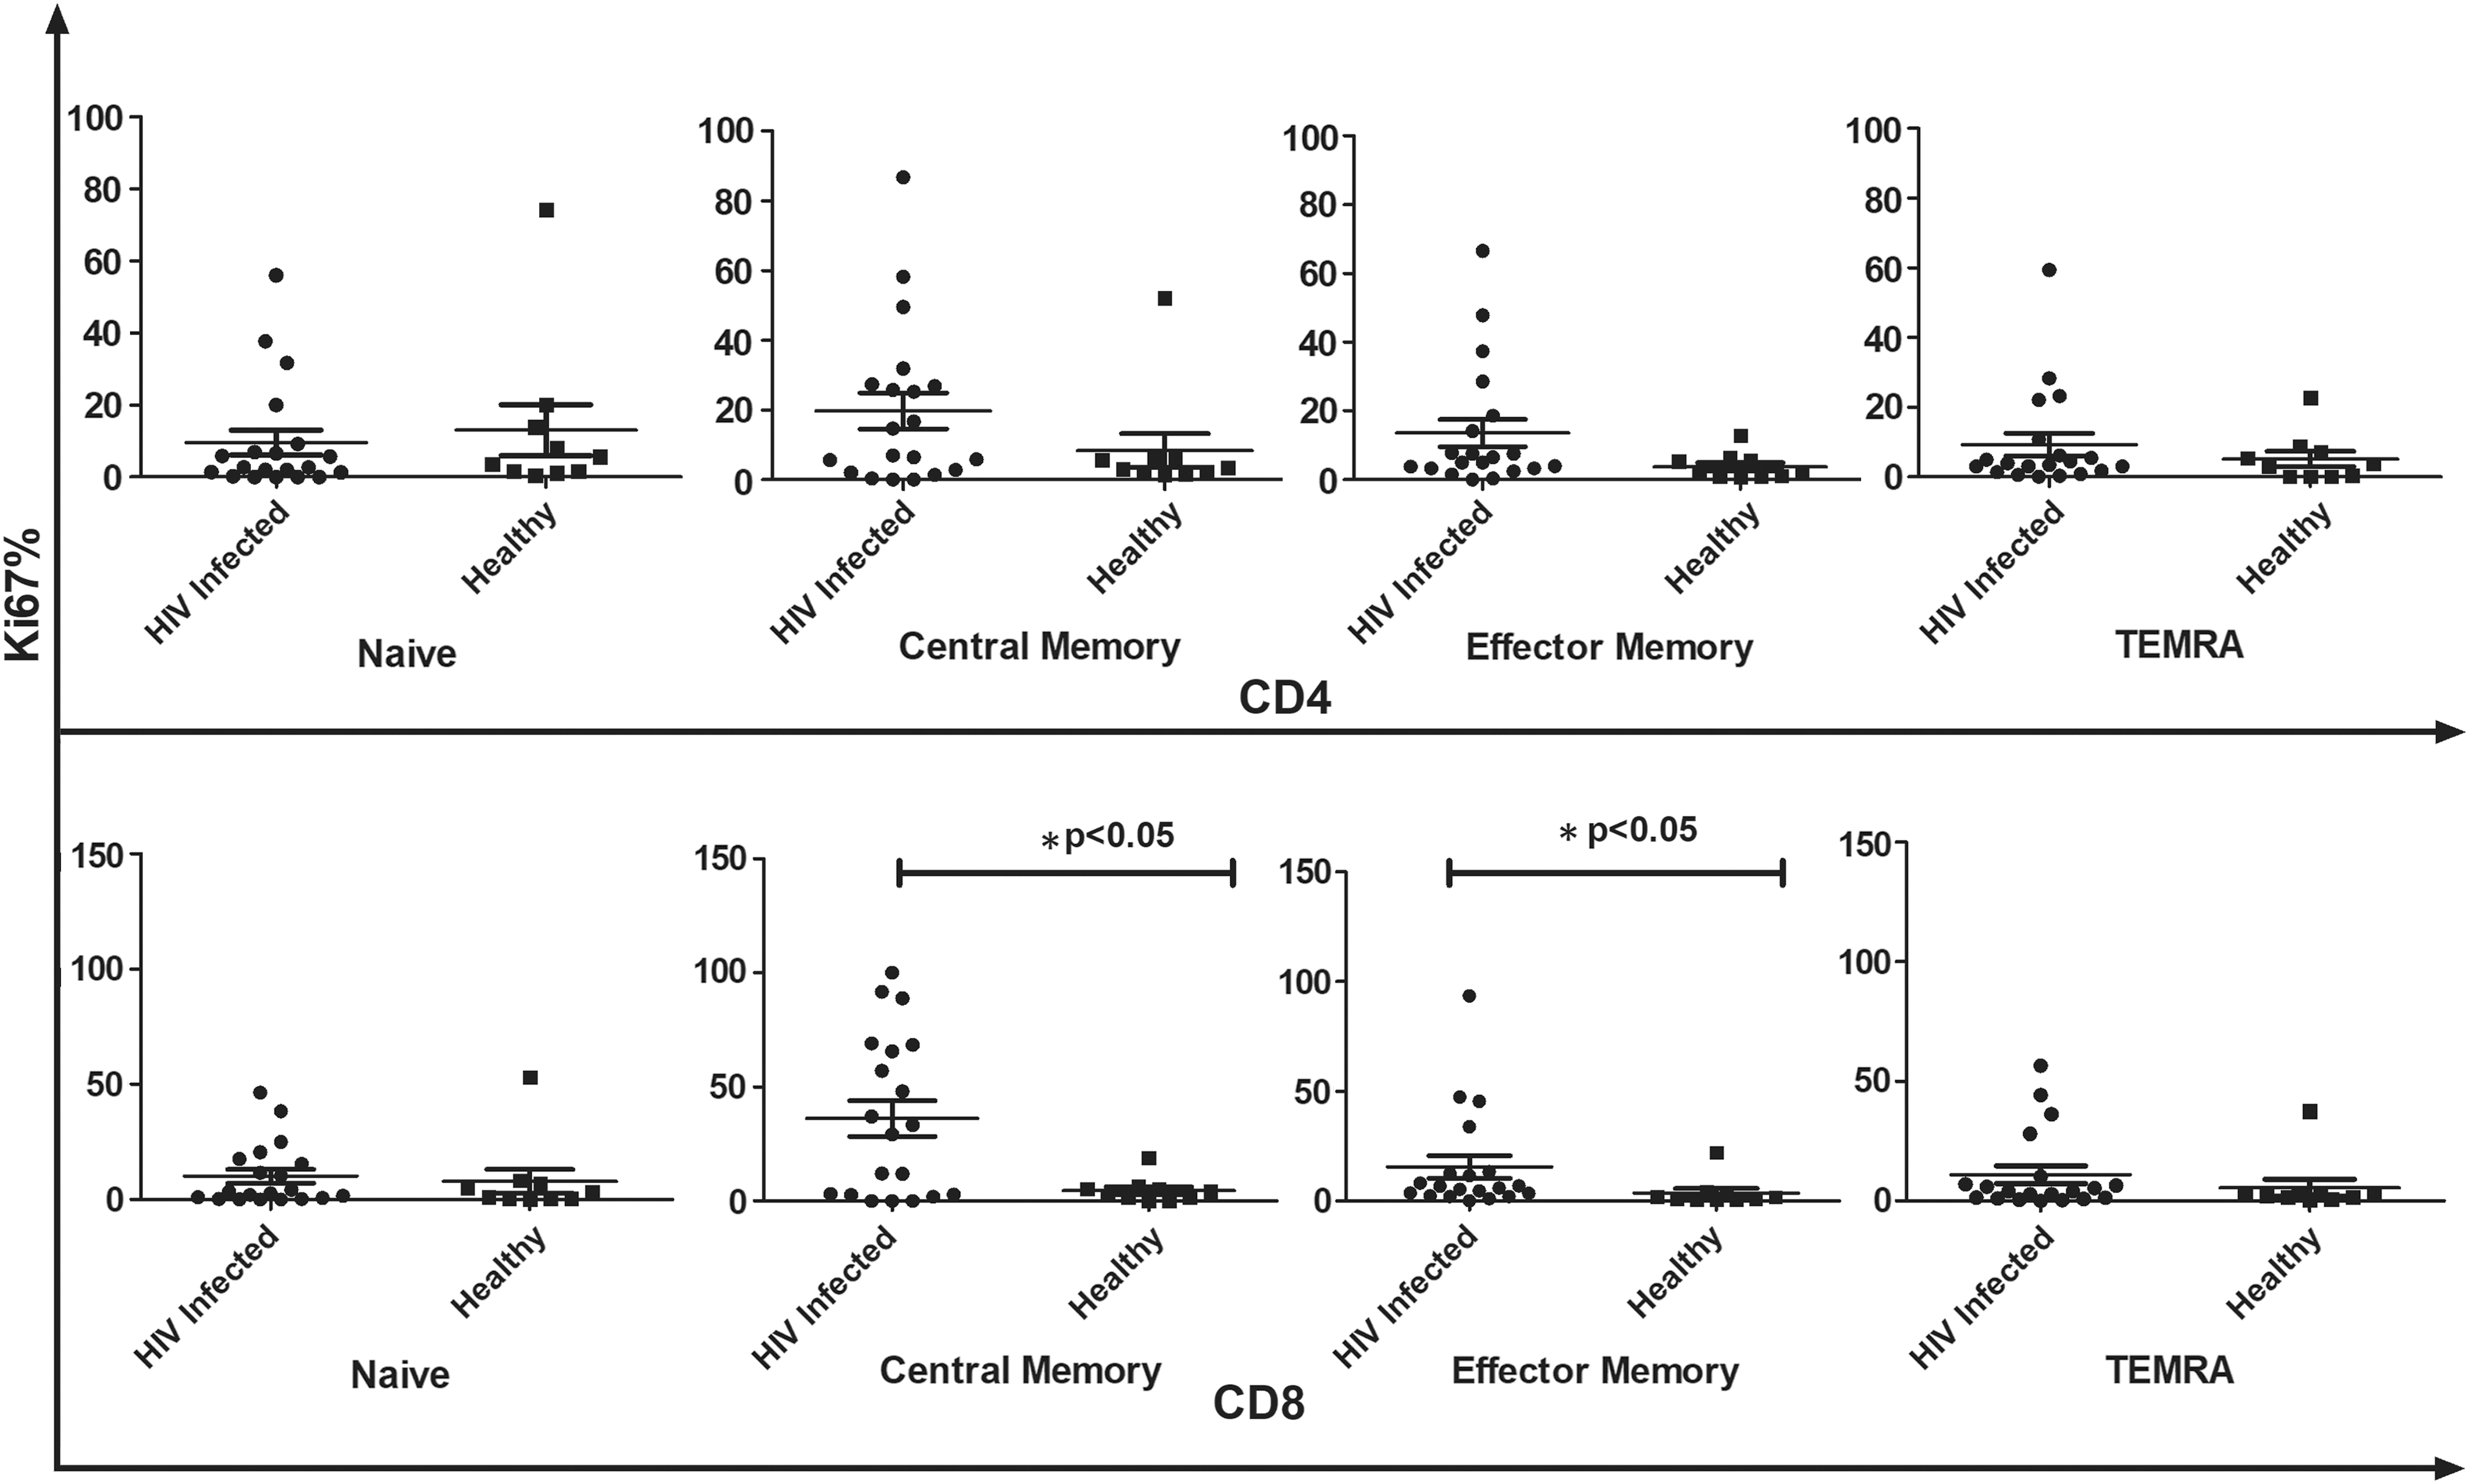
Comparative analysis of Ki67+ CD4+ and CD8+ T cell subsets between HIV-infected individuals (n − 20) and healthy controls in the absence of ex vivo stimulation. Data represent median ± SD. Comparison with statistical significance is shown as *p < 0.05. SD, standard deviation.
Frequency of proliferating CD4+ and CD8+ T cell subsets after antigenic stimulation
Loss of proliferative response to polyclonal and recall antigen stimulation often precedes CD4+ T cell depletion in course of HIV infection (18). Stimulation with PHA resulted in increased Ki67 expression on both CD4+ and CD8+ T cells of HIV-infected individuals compared with HCs (Fig. 3). CD8+ T cell compartment of HIV-infected individuals showed increased proliferation in naive and EM T cell (p < 0.05) compartment compared with other subsets.
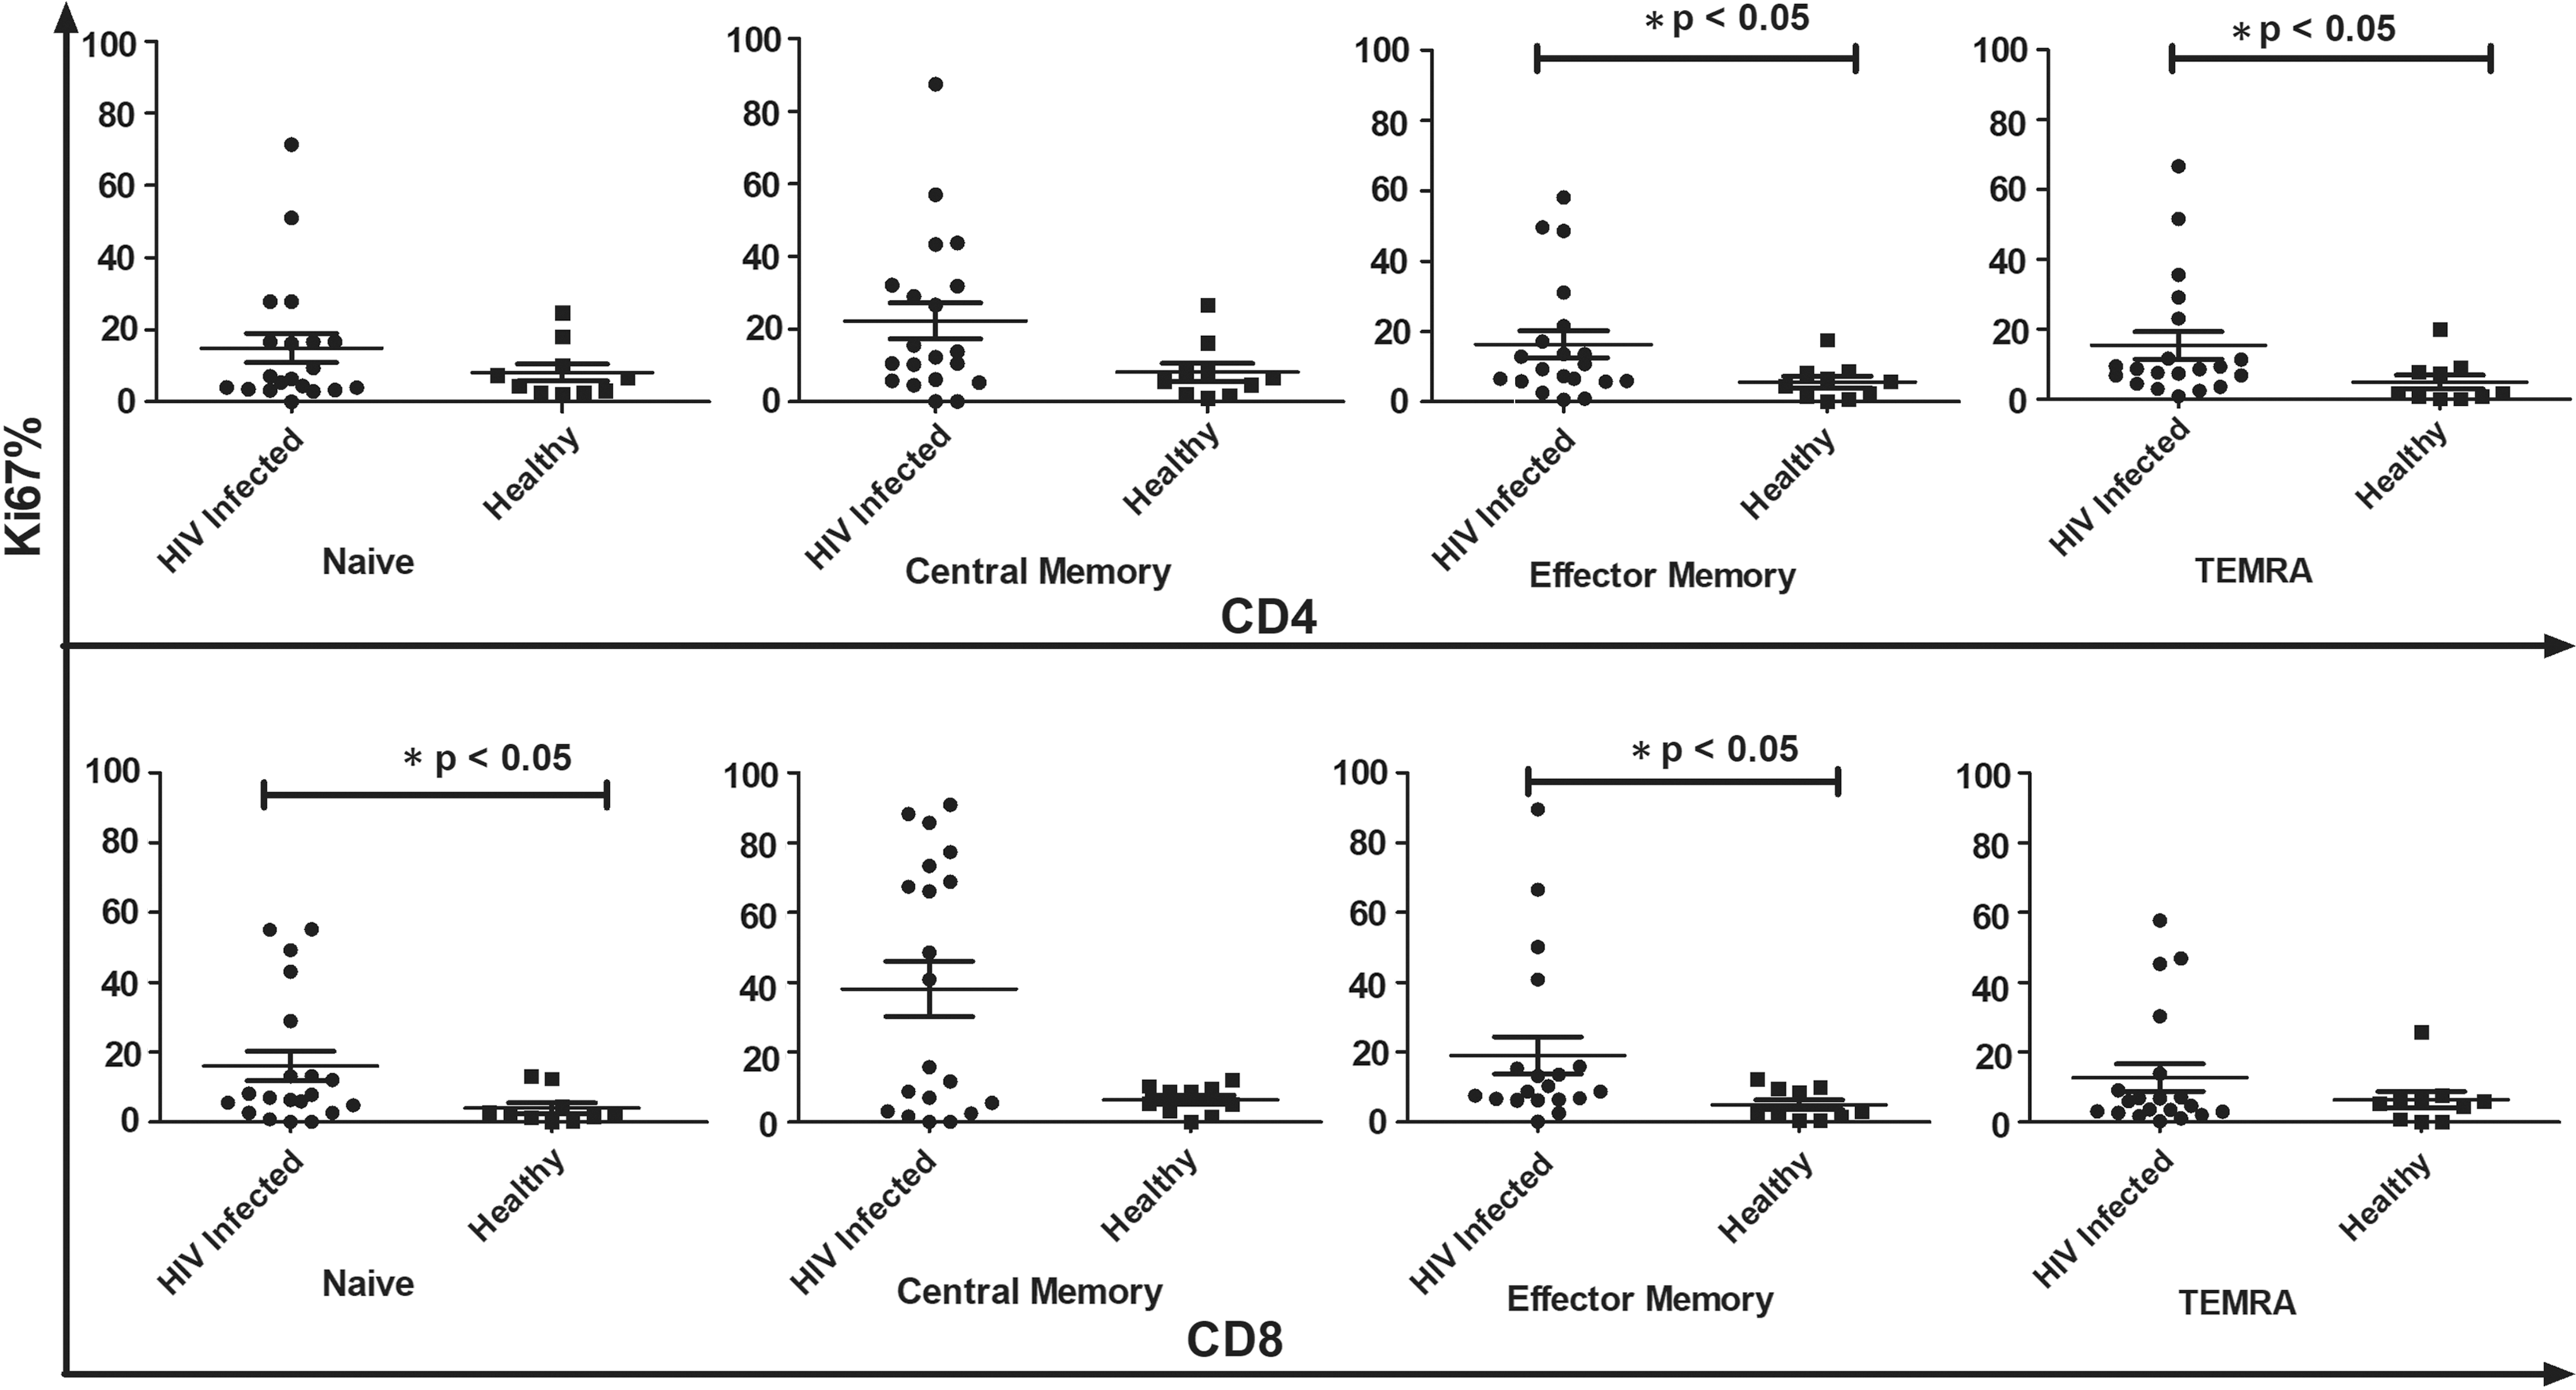
Comparative analysis of Ki67+ T cell subsets in HIV-infected individuals (n − 20) and healthy controls with polyclonal (PHA) stimulation. Data represent median ± SD. Comparison with statistical significance is shown as *p < 0.05.
Stimulation with PHA resulted in increased Ki67 expression on CD4+ CM and EM cells of the control subjects. In contrast, all subsets of CD4+ T cells from the HIV-infected study subjects showed enhanced Ki67-expressing proliferating cells in response to polyclonal stimulation. In the CD8+ T cell compartment of the HCs, stimulation with PHA resulted in increased proliferation of all subsets except the naive (p = 0.58), with highest increase observed for the CM subset (p < 0.05). The HIV-infected subjects presented the opposite picture, wherein the naive CD8+ T cells (p < 0.01) showed maximum increase in Ki67+ proliferating cells upon stimulation (Fig. 3).
Correlation of CD4+ count and plasma viral load with proliferation of CD4+ and CD8+ T cell subsets
We next analyzed the association of plasma viral load and CD4+ T cell count with the CD4+ and CD8+ T cell subsets. No significant change in CD4+ T cell count and plasma viral load was observed in the subjects throughout the study period. At baseline, the EM subset of CD8+ T cells correlated positively with the viral load (r = 0.5152, p = 0.02), whereas negative correlation was observed with other T cell subsets. At follow-up, all the CD4+ and CD8+ T cell subsets correlated negatively with viral load. Similarly, we found that all CD4+ and CD8+ T cell subsets correlated negatively with CD4+ T cell counts at both time points.
In HIV-1-infected individuals, we observed a negative correlation between baseline viral load and Gag-specific proliferation of N, CM, EM, and TEMRA subsets of CD4+ and CD8+ T cell population. However, positive correlation was obsevered at follow-up visit. We found negative correlation of CD4+ count with proliferation of CD4+ and CD8+ T cell population except for N and CM subsets of CD4+ T cells, where positive correlation was observed at follow-up and baseline, respectively.
Proliferation frequency of CD4+ and CD8+ T cell subsets in HIV-1-infected (R, VS, and S progressors) and HCs
Comparative analysis of different CD4+ and CD8+ T cells among R, VS, and S progressors did not reveal any significant differences. However, CM subsets of CD4 and CD8 T cell compartment were elevated in S progressors compared with those in R and VS progressors [(median% CM CD4+) R, 1.502; VS, 1.35; S 1.664]; [(median% CM CD8+) R, 0.6202; VS, 1.029; S 1.201]. In contrast, R progressors were found to have increased EM T cells [(median% EM CD4+) R, 1.855; VS, 1.7; S 1.8; (median% EM CD8+) R, 1.627; VS, 1.627 S; S 1.571]. In the absence of any ex vivo stimulation as shown in Figure 4, R progressors had a higher proportion of EM and TEMRA CD4+ T cells expressing Ki67 than HCs (EM, p < 0.05; TEMRA, p < 0.05). Similarly, in the CD8+ T cell compartment, EM T cell subset of R (p < 0.05) and VS progressors (p < 0.05) and TEMRA subset of R progressors (p < 0.05) were found to proliferate at a significantly higher frequency than the respective subsets of HCs. EM and TEMRA CD4+ T cell subsets of R progressors also showed higher proliferation than those of S progressors (EM, p < 0.05; TEMRA, p < 0.05). The TEMRA CD8+ T cell subsets of R progressors also showed more proliferation than those of S progressors (p < 0.05). At follow-up, a decline was observed in the proliferation capacity of all T cell subsets in the absence of any ex vivo stimulation (Fig. 4).
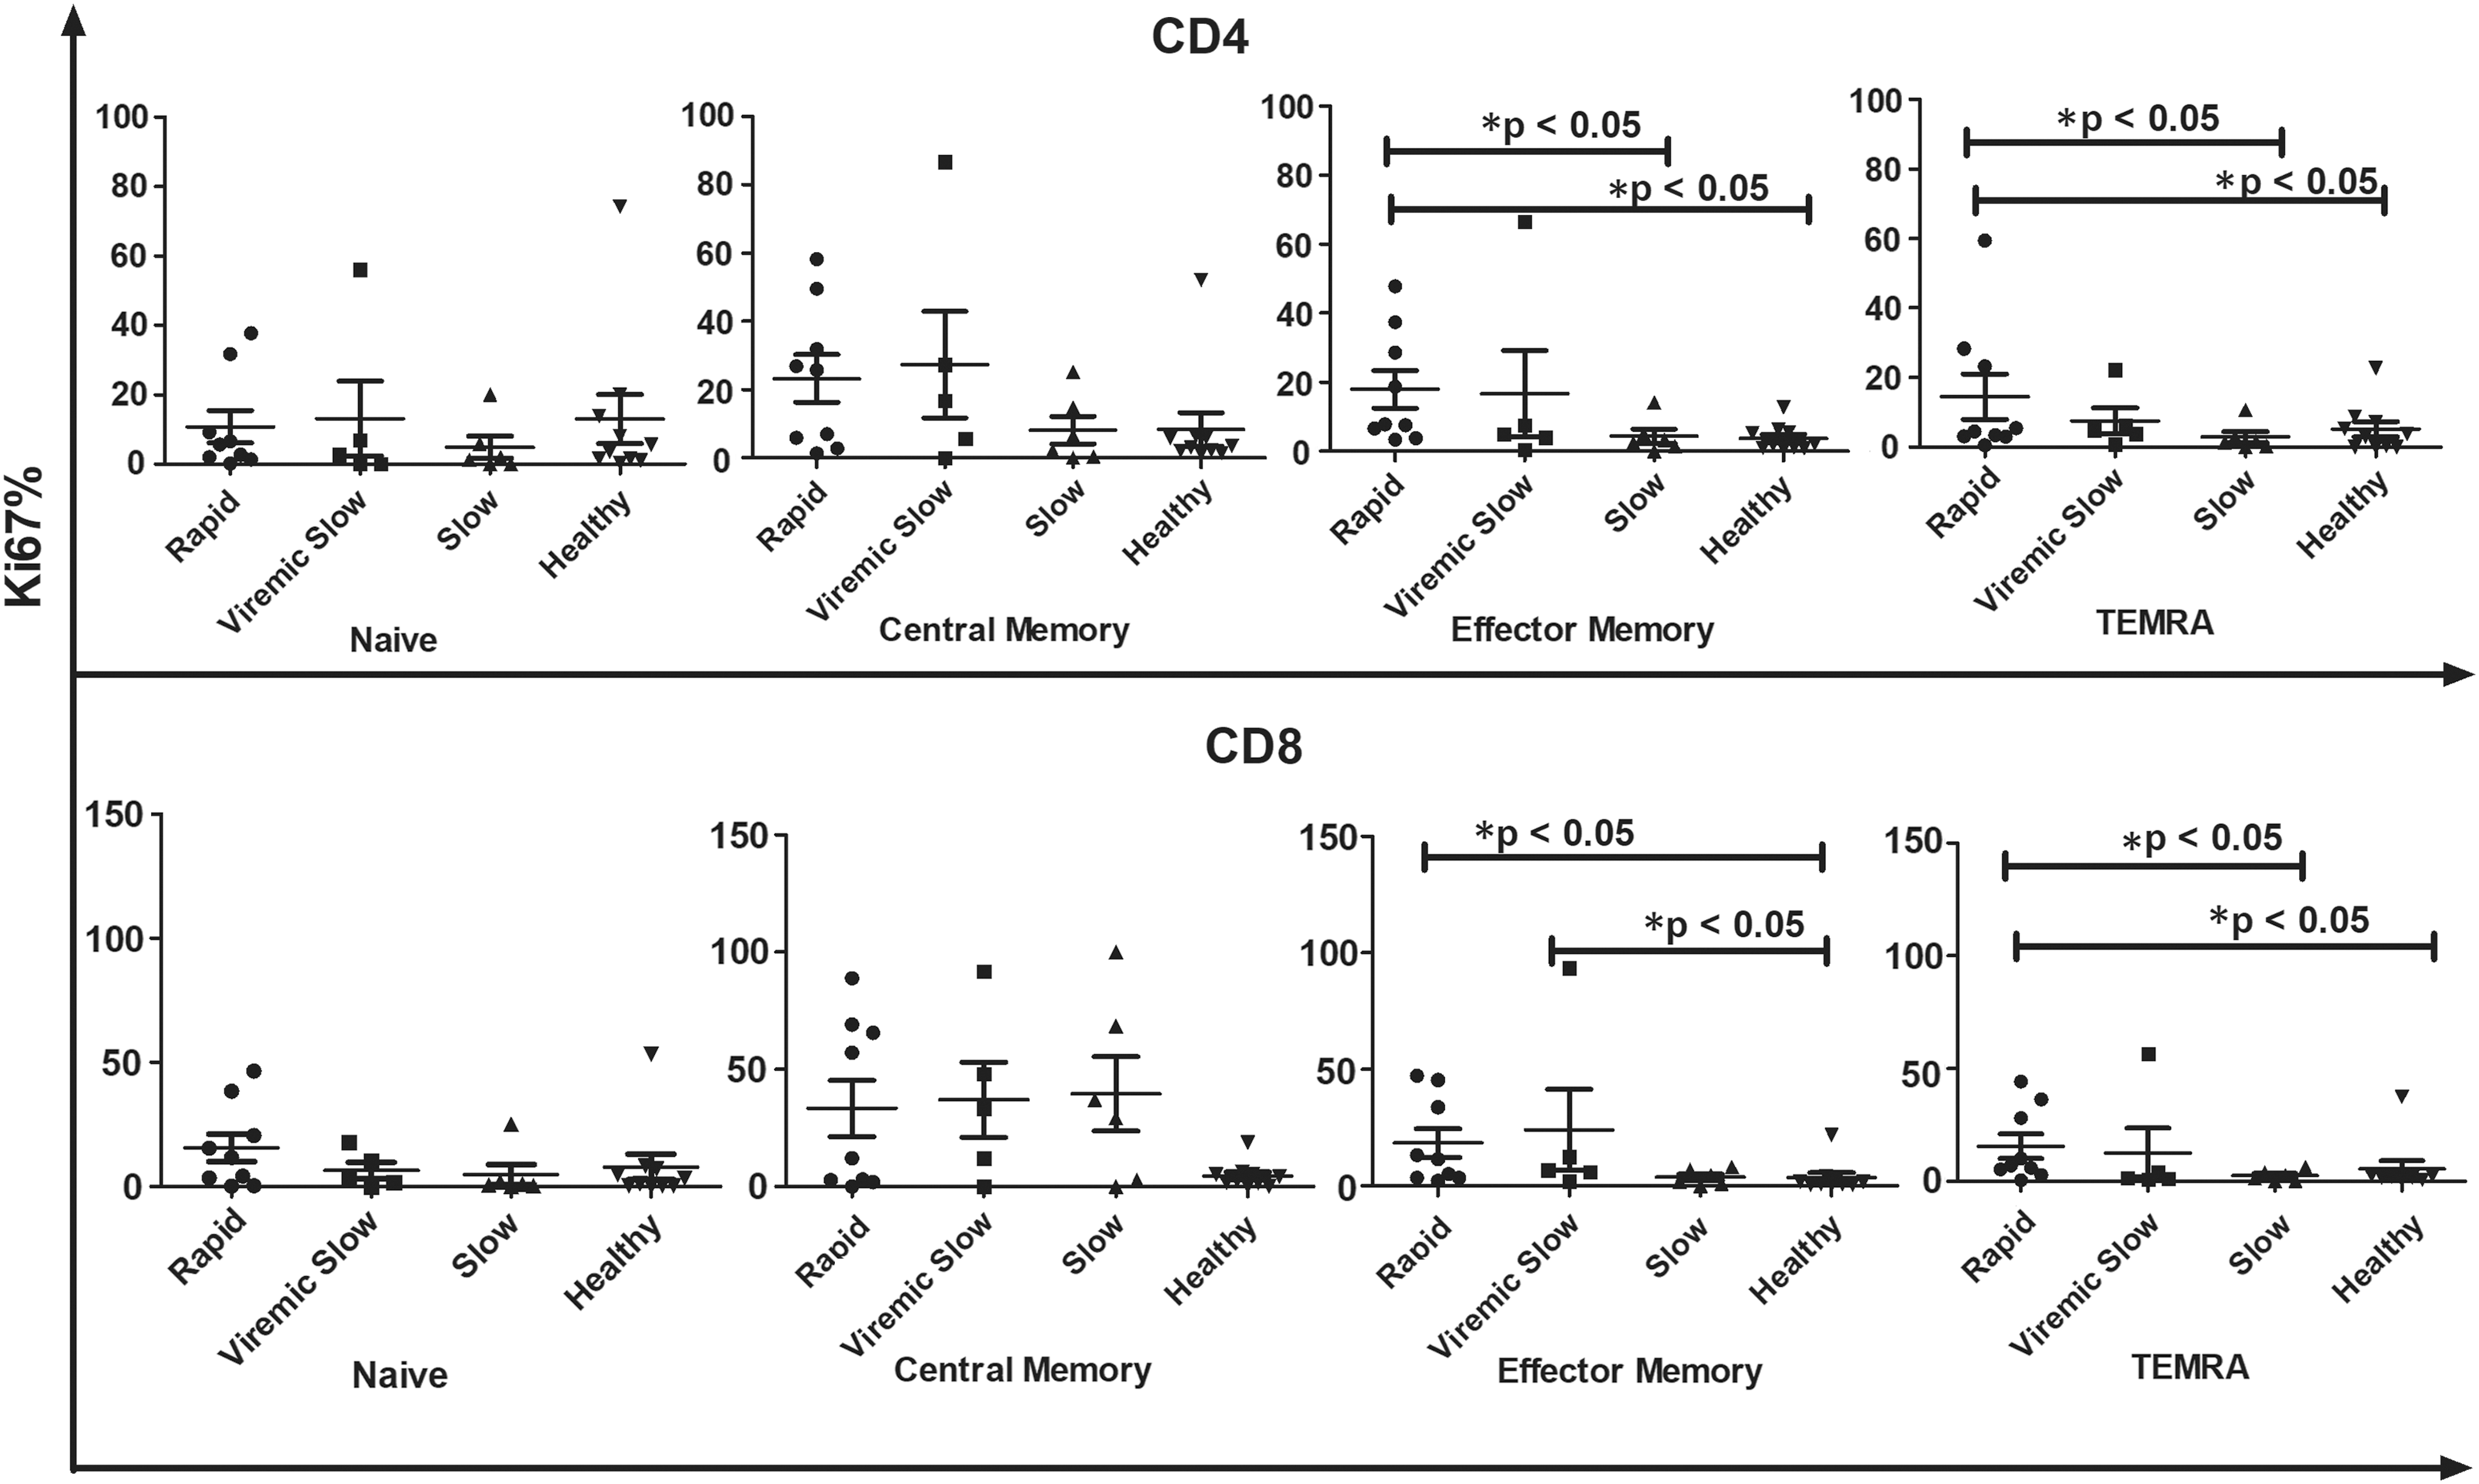
Comparative analysis of baseline proliferation frequency of different T cell subsets in R (n − 9), VS (n − 5), S progressors (n − 6), and healthy controls (n − 10) in the absence of ex vivo stimulation at baseline. X-axis represents different groups whereas Y-axis represents %Ki67 proliferation in CD4 and CD8 T cell compartments. Data represent median ± SD. Comparison with statistical significance is shown as *p < 0.05. R, rapid; S, slow; VS, viremic slow.
Proliferating frequency of HIV-specific CD4+ and CD8+ T cell subsets in R, VS, and S progressors
At both time points (0, 6 months), CM subsets of CD4+ and CD8+ T cell compartments were found to be the chief proliferating subset in all clinical groups upon stimulation with HIV-1 Gag peptides (Tables 2 and 3). We then investigated the comparative HIV-1 Gag-specific proliferation frequency of each T cell subset among R, VS, and S progressors. At baseline, proliferation frequency of CM CD4+ T cells was low in S than in VS and R progressors [(median%) R, 16.90; VS, 15.60; S 9.915; p = 0.77]. In addition, EM CD4+ T cells had significantly high proliferating frequency in R than in S progressors (R vs. S, EM CD4+; p < 0.05). Proliferation frequency of T cell subsets against Gag stimulation in each clinical group is shown in Figures 5 and 6.
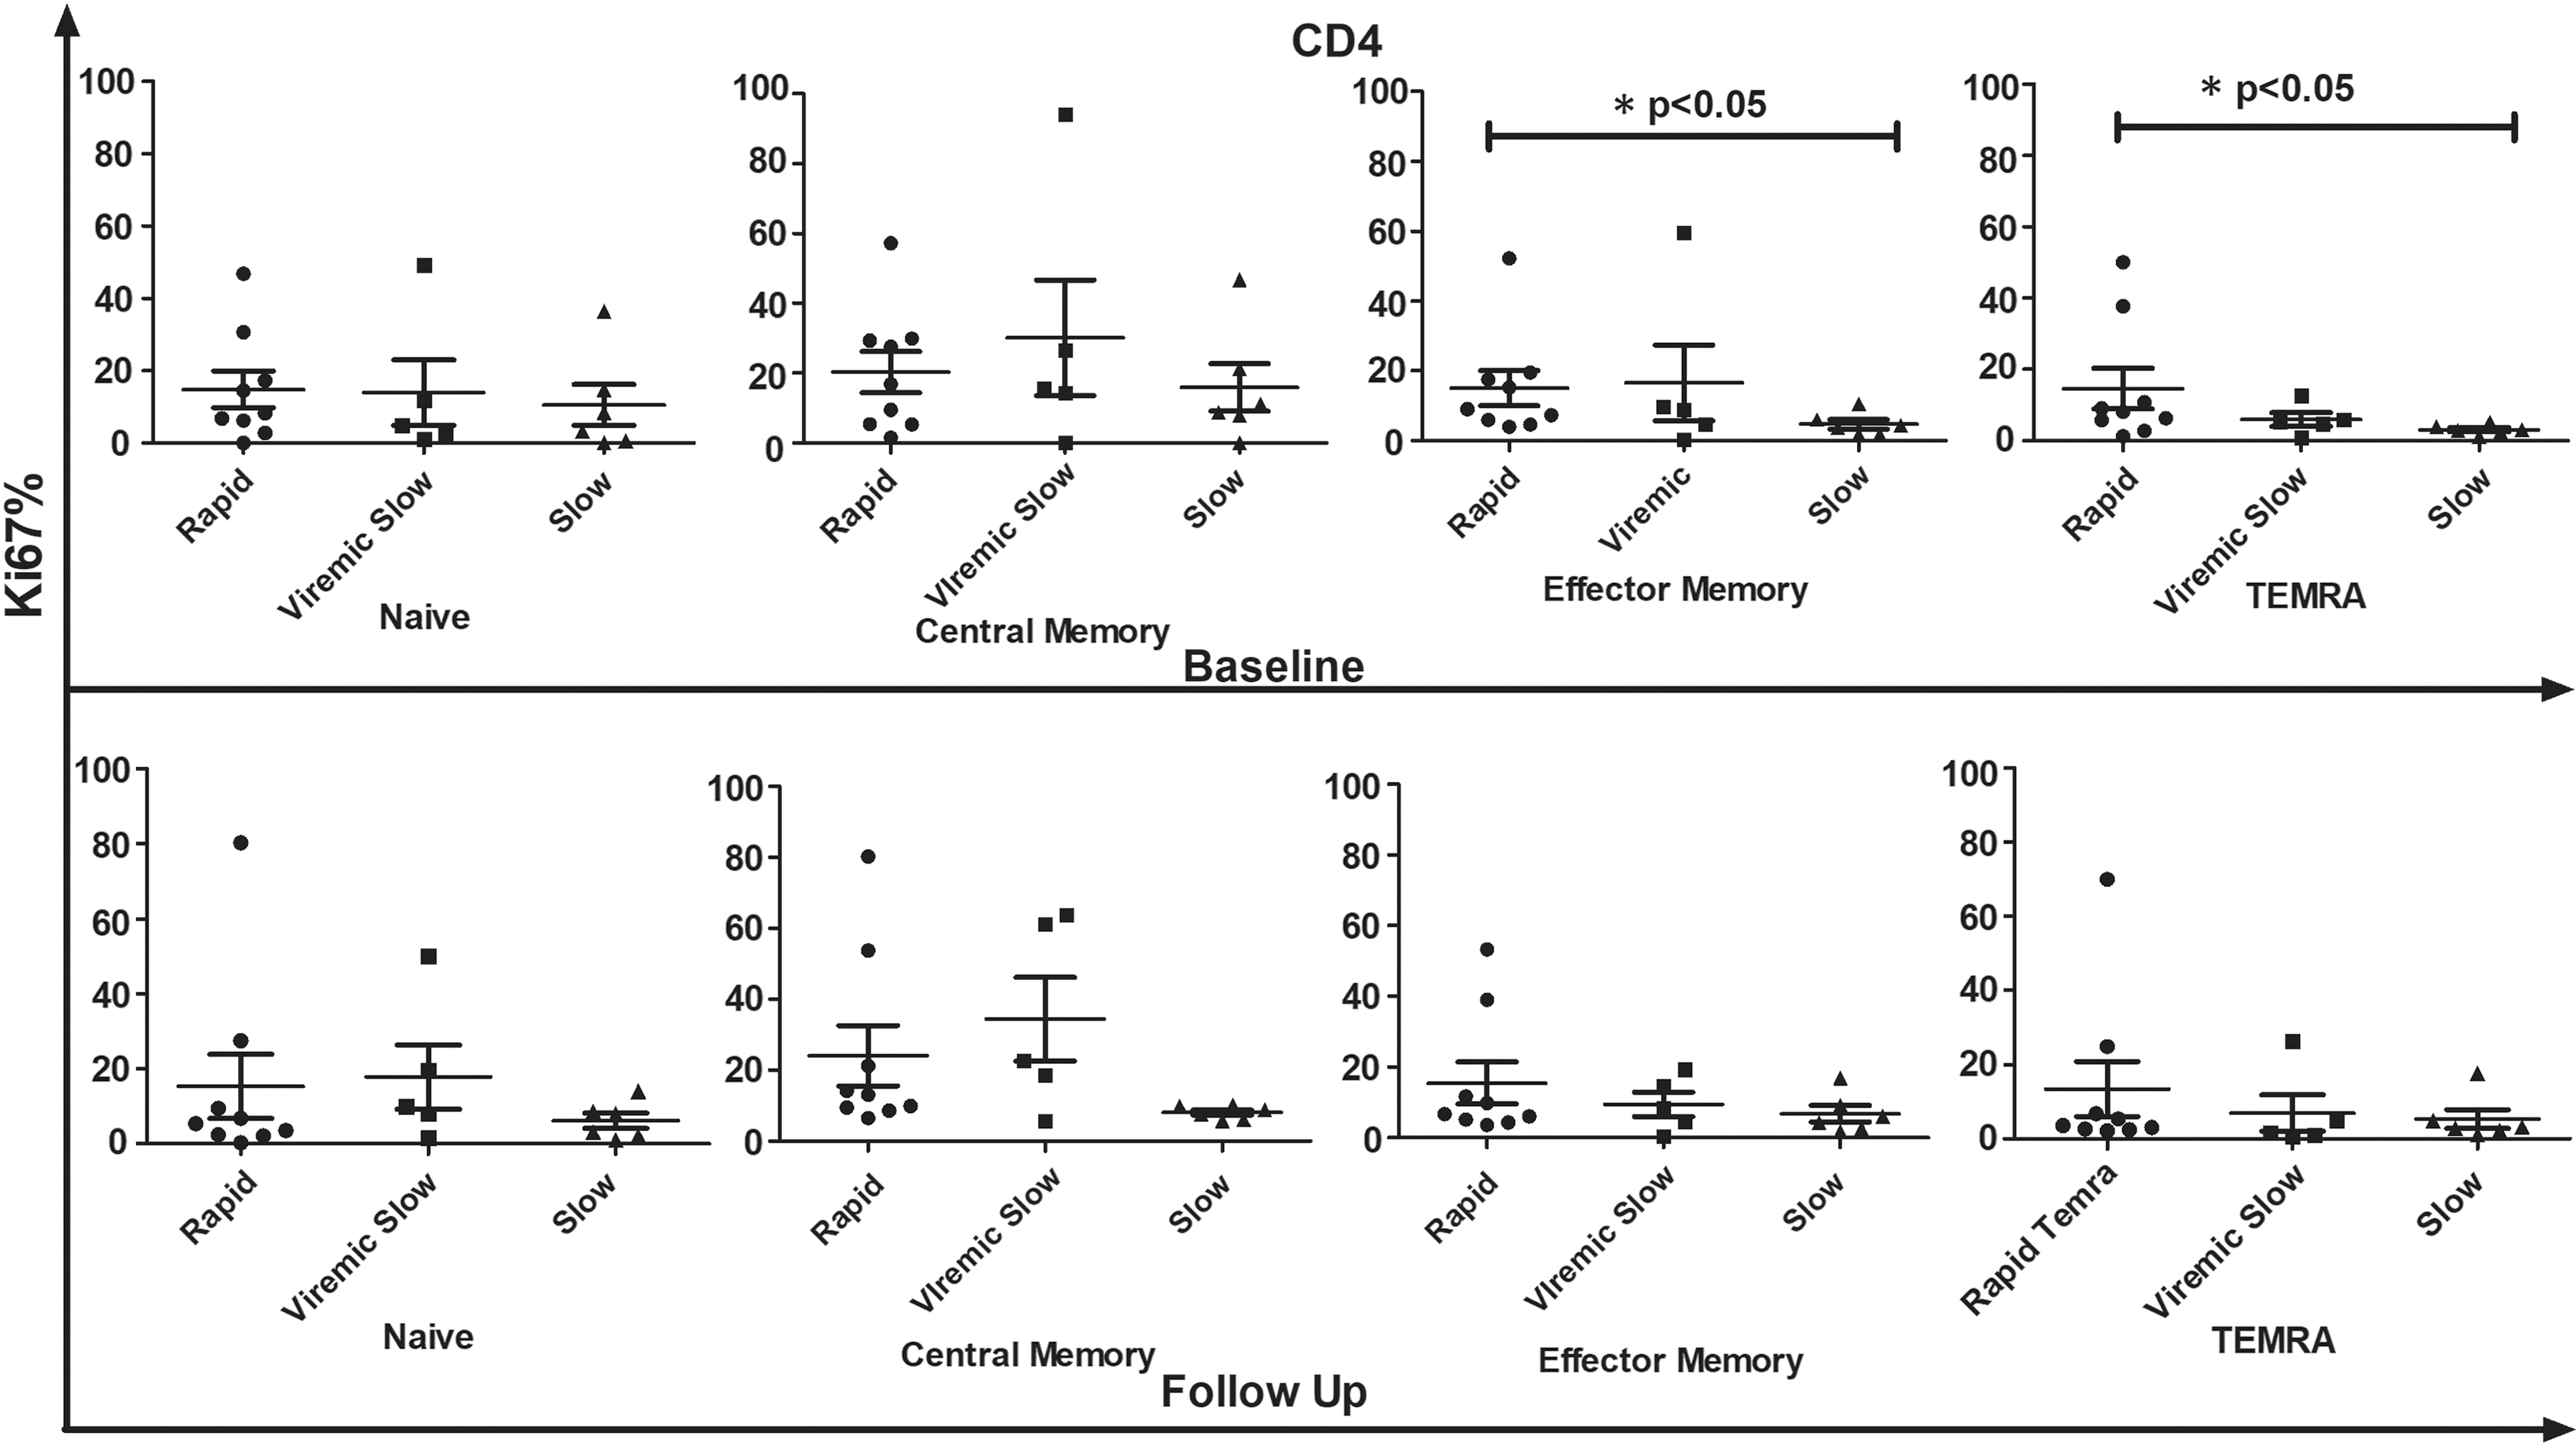
Comparative analysis of proliferation frequency of all CD4 T cell subsets in R (n − 9), VS (n − 5), and S progressors (n − 6) in response to HIV-1 Gag peptide pool stimulation at baseline and follow-up visit. X-axis represents different groups whereas Y-axis represents %Ki67 proliferation in CD4 T cell compartment. Data represent median ± SD. Comparison with statistical significance is shown as *p < 0.05.
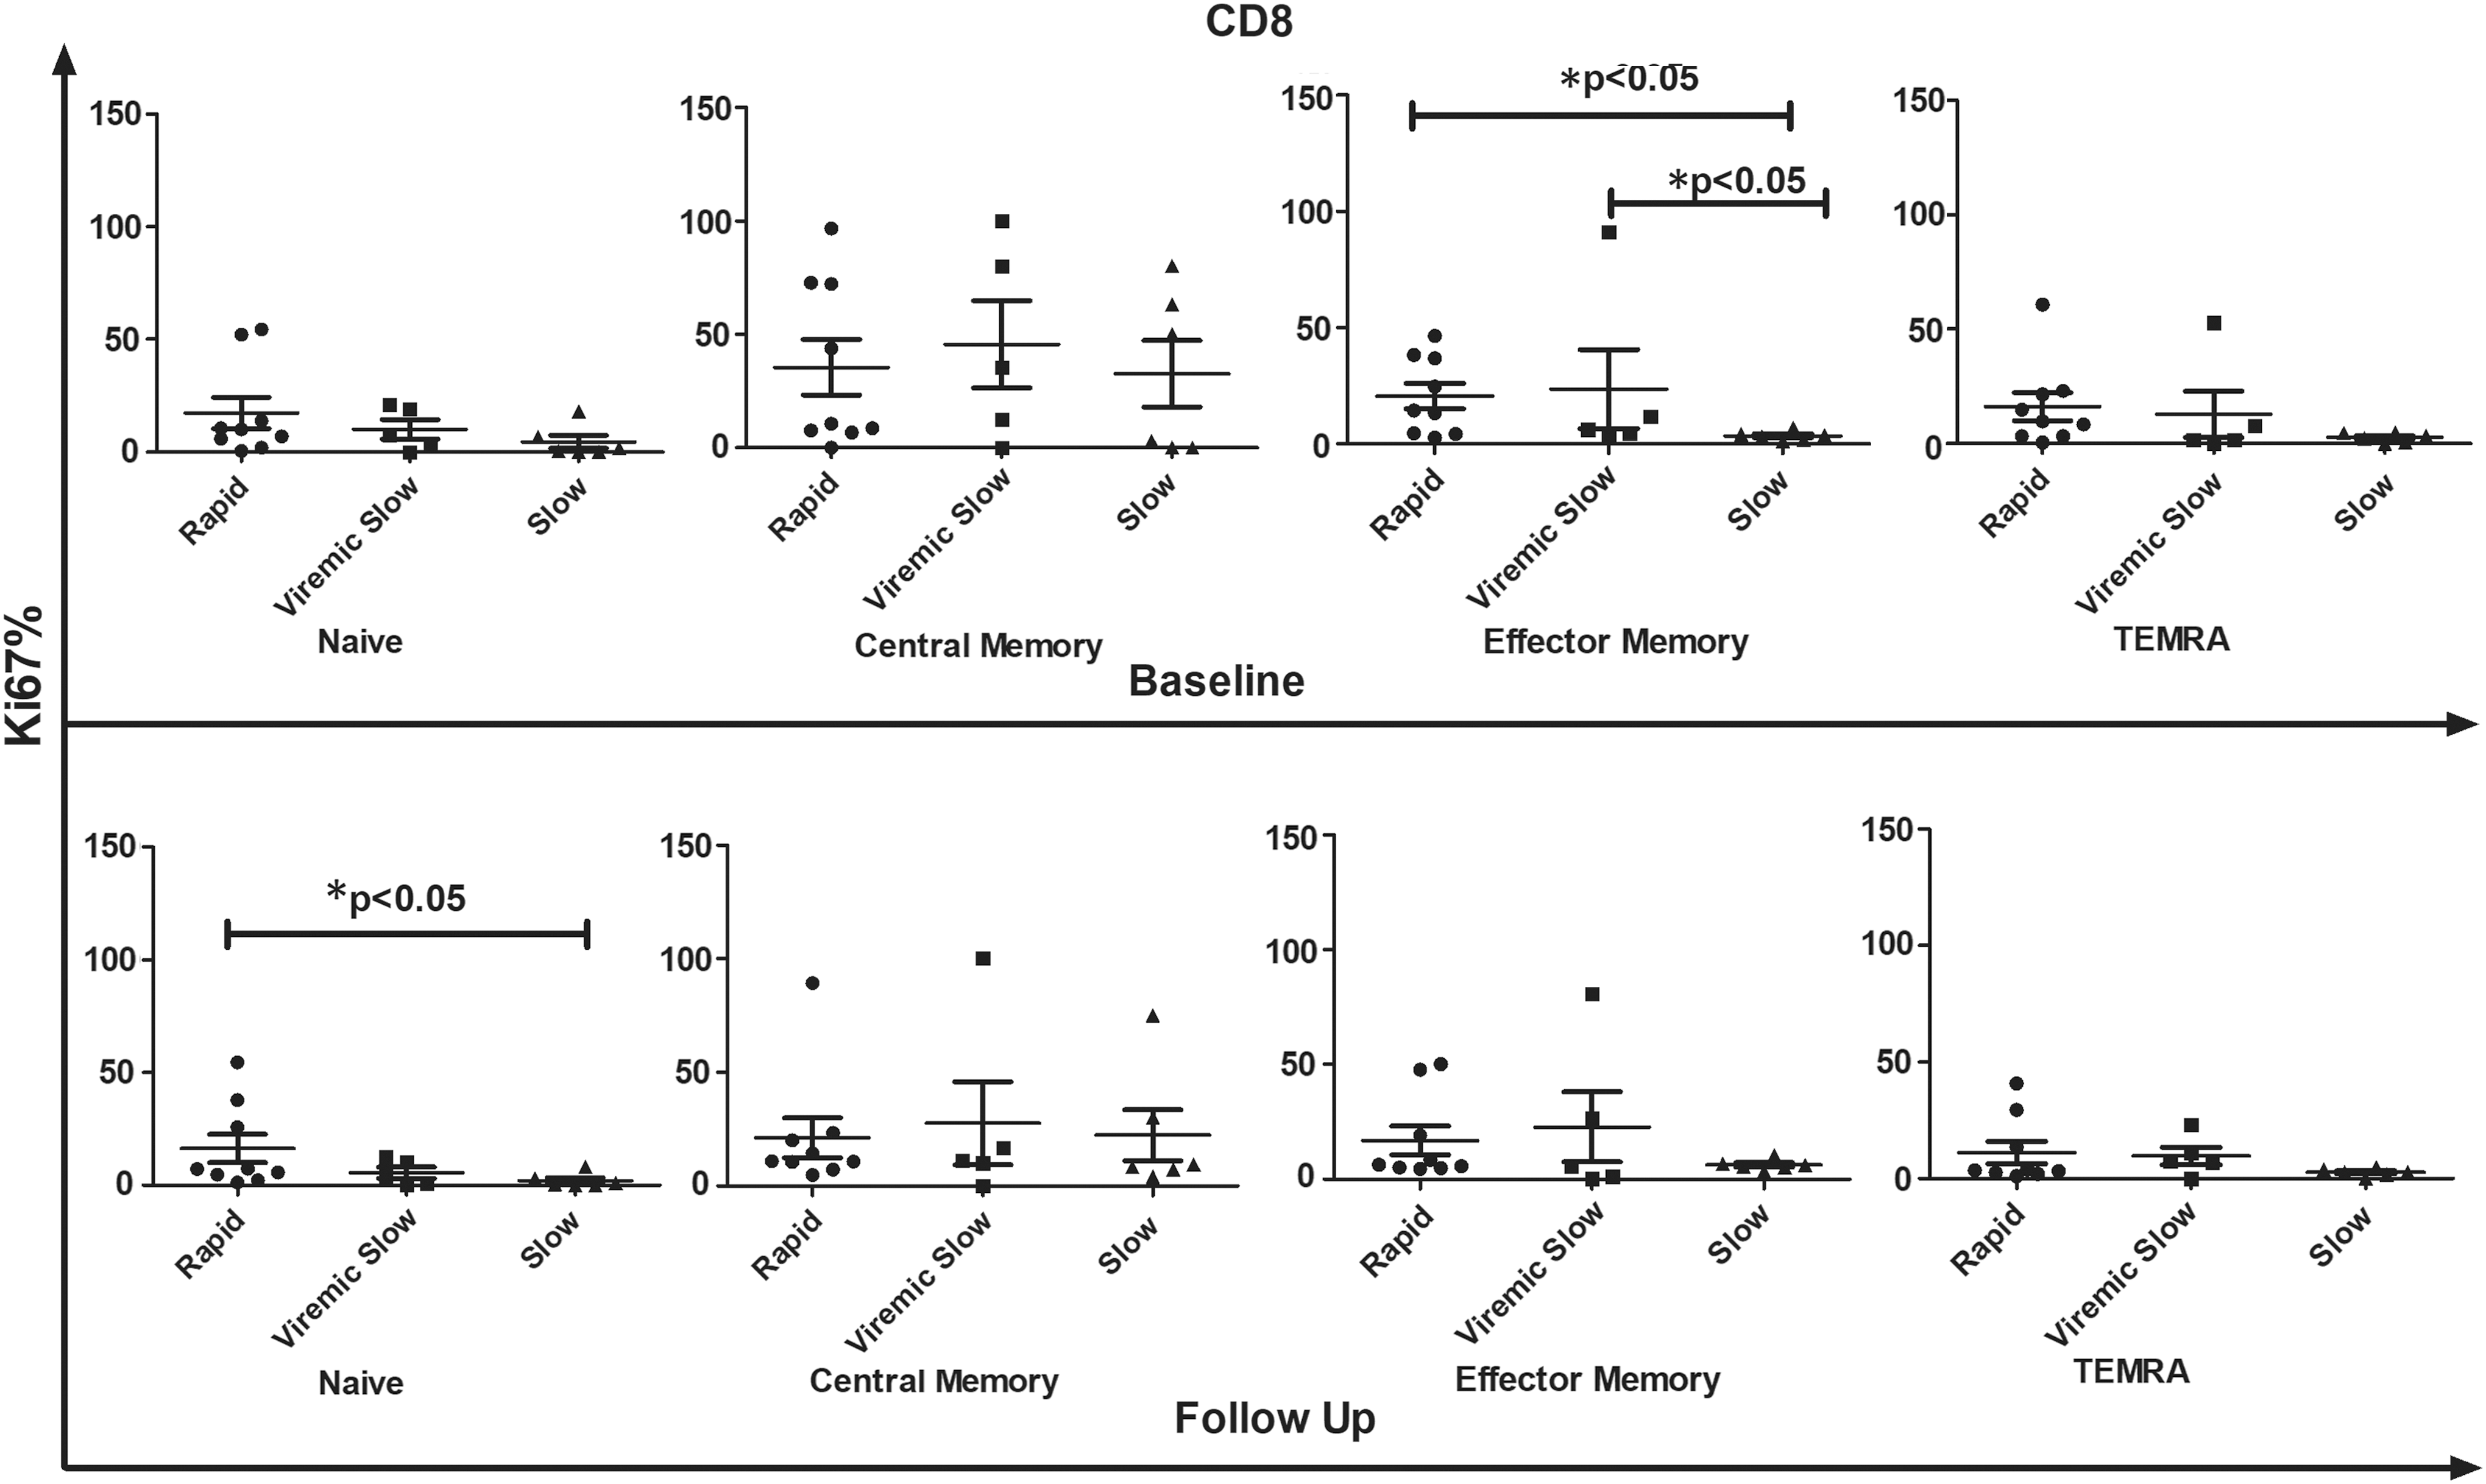
Comparative analysis of proliferation frequency of all CD8 T cell subsets in R (n − 9), VS (n − 5), and S progressors (n − 6) in response to HIV-1 Gag peptide pool stimulation at baseline and follow-up visit. X-axis represents different groups whereas Y-axis represents %Ki67 proliferation in CD8 T cell compartment. Data represent median ± SD. Comparison with statistical significance is shown as *p < 0.05.
Values are expressed as median (IQR) unless stated otherwise.
CM, central memory; EM, effector memory; N, naïve; TEMRA, T effector memory cells re-expressing RA.
For this analysis, a Kruskal–Wallis variance was applied that tests difference in more than two groups. Comparison with statistical significance is shown as * p < 0.05. A significant p-value means a significant difference between the groups.
Similarly, EM CD8+ T cell subsets proliferated significantly in R upon stimulation with HIV Gag antigen compared with those in VS and S, wherein highest proliferation frequency was observed in CM CD8+ T cells [(median% EM CD8+) R, 14.30; VS, 6.190; S 3.385; p < 0.05, (median% CM CD8+) R, 10.60; VS, 35.40; S 26.49; p < 0.05]. At follow-up, a decline was observed (although not statistically significant) in Ki67 expression of all CD8+ T cell subsets when stimulated with HIV-1 Gag peptide pool in each clinical group compared with baseline data as shown in Figure 6. Furthermore, CM CD4+ and CD8+ T cell subsets showed more proliferation in VS than in R and S progressors [(median% CM CD4+) R, 13.00; VS, 22.7; S 8.18; p = 0.09, (median% CM CD8+) R, 10.80; VS, 11.10; S 8.87; p = 0.78]. Also, the proliferation frequency of naive CD8+ T cells was significantly higher in R than in S (R vs. S naive CD8+, p < 0.05).
Intergroup analysis revealed that CD4+ T cell compartment of R showed maximum proliferative response to HIV-1 Gag peptide pool compared to polyclonal stimulation followed by VS and S progressors. On the contrary, CD8+ T cell compartment of VS and S progressors demonstrated highest proliferation capacity compared with that of R progressors. Intragroup analysis of immune response to PHA versus HIV-1 Gag peptide pools followed a trend of higher proliferation in response to Gag in R than polyclonal stimulation although no significant difference was observed. Similarly, CD8+ T cell subsets of R also showed higher proportion of proliferating Ki67+ cells upon Gag stimulation than upon polyclonal stimulation. Also, CM T cell subsets exhibited highest proliferation in VS upon stimulation with Gag than upon polyclonal stimulation.
Discussion
In this study, we dissected the proliferative capacity of CD4+ and CD8+ T cell subsets broken down on the basis of disease progression and viral replication. In recent years, the most predominant theory about HIV immunopathogenesis is progressive depletion of the CD4+ T cell pool that eventually leads to differential loss of certain T cell subsets and altered T cell homeostasis (28). We observed a decline in the number of naive T cell subset and an increment in CM and EM T cells in HIV-1-infected individuals. Our data indicate that HIV infection affects naive T cell pool maximally and the expansion of memory T cells could be explained as a compensatory mechanism to maintain flow of naive cells into memory T cells, which eventually culminates in depletion of naive T cell pool as evident by higher frequency of proliferating memory T cells. This exhaustion is due to higher viral replication in R progressors than in VS and S progressors, which eventually affects the disease progression in these groups. In concordance with previous studies, the study demonstrates that unremitting rounds of memory T cell expansion exert negative pressure on the naive T cell pool, resulting in dysregulation of normal homeostatic balance (9,32).
In addition, CD8+ T cell population was more significantly affected than CD4+ T cells. This preferential loss of HIV-specific CD8+ T cells results in loss of effector functions and leads to T cell exhaustion as they were also reported to be highly susceptible to Fas-mediated apoptosis (1,15,32). This loss of cytotoxic population would eventually lead to rapid disease progression as demonstrated in R progressors. Contrary to this, naive CD8+ T cells proliferated maximally upon stimulation with polyclonal antigen, whereas all memory subsets of HCs showed increased proliferation frequency except for naive subsets, reflecting that HIV infection completely reverts the homeostatic response to any antigen as both central and EM subsets showed increased proliferation upon stimulation with Gag at baseline and follow-up visit. HIV-mediated T cell exhaustion and apoptosis could be a possible reason for diminished proliferation of EM and TEMRA CD4+ T cell subsets in response to Gag antigen. A previous study by Blattman et al. supports this observation, reporting that T cells are unable to proliferate in response to antigenic stimulation and are functionally exhausted during untreated chronic HIV infection (2).
It has been reported earlier that CD4 T cell count and plasma viral load play a significant role in affecting the proliferation of CD4 T cells, whereas CD8 T cell proliferation is mainly driven by plasma viremia (5). We observed a positive correlation of proliferation capacity of EM CD8+ T cell subset with baseline viral load, suggesting that high viremia drives rapid expansion of EM T cell population. As reported earlier, persistent and chronic antigenic stimulation creates an environment of immune activation and viral replication and all these events set up an enduring cycle of T cell activation, expansion, and depletion, leading to poor immune response. Surprisingly, other T cell subsets including N, CM, and TEMRA showed negative correlation with viral load both at baseline and follow-up, highlighting the negative impact of plasma viral load. The expanded effector T cell population during chronic immune activation might exert their cytotoxic activity on these subsets, resulting in rapid decline of other T cell subsets. It simply points to the fact that HIV viral load indeed plays a significant role in impairment of T cell subsets. We have previously reported a negative correlation of CD4 T cell counts with all the T cell subsets, indicating a negative impact of this perturbation on host immune system (22,23). A similar decline in N and CM T cell proliferation has also been reported by other studies. The enhanced proliferation of memory T cell subsets could be attributed to slow progression of HIV in the study subjects as reflected by their high CD4 count and low viral load. These two factors (high CD4 count and low viral load) identified in this study lead to different rate of disease progression and effector functions in R, VS, and S progressors. Our results are in concordance with Younes et al. wherein they examined the effect of HIV viremia on differentiation of T cells and found that persistent viremia resulted in alteration of T cell differentiation pathway by blocking the formation of stable long-term CM T cells (34). Tussey et al. further supported the findings suggesting that low antigen load drives maturation of T lymphocytes to memory cells (31). With rise in plasma viral load, the memory subsets either revert back to their previous phenotype or undergo apoptosis. Our group also pointed out the fact that skewed maturation of T cells during chronic HIV-1 infection is a pathogenic strategy utilized by the virus, whereby CD8 T cells are prevented from achieving full effector functions (21).
We observed stark differences in proliferation frequency of different T cell subsets among R, VS, and S progressors. Baseline proliferative capacity was higher in infected subjects, and this was more apparent for EM and TEMRA subsets in the presence of viremia and active disease (R and VS progressors). Furthermore, in response to HIV-specific stimulation, EM subset of R progressors exhibited a higher proliferative capacity than that of VS and S progressors. This is corroborated by other studies highlighting the role of antigenic presence and stimulus on effector T cell proliferation. With increasing viral burden, and mounting immune activation in R, the proliferative responses in addition to total number of EM T cells increase (13,15). According to currently accepted models of HIV infection and T cell depletion, EM CD4+ T cell compartment regenerates from the CD4+ CM T cell precursors. This then ultimately drains the CM T cell compartment, leads to CD4+ effector cell insufficiency, and sets the tempo for diseases progression in these subjects (26).
In contrast, we observed decreased proliferation of CM subsets in S progressors compared with those in VS progressors and, more importantly, with those in R progressors. This decreased proliferation of CM subset was observed for both CD4 and CD8+ T cells. In a recent study on SIV-infected primates, it was demonstrated that progressive infection in rhesus monkeys was characterized by increased proliferation of the CD4+ CM subset. The nonprogressive SIV infection in Sooty mangabeys was associated with a stable CD4+ T CM population and lower proliferation of this subset (17). Another study on viremic nonprogressors reported a decreased infection of CD4+ CM T cells as a key factor for the preserved T cell homeostasis and lack of disease progression (14). Noyan et al. further provide supports to our findings wherein they have shown that the memory cell population in elite controllers (control viral replication for prolonged periods without treatment) is not undergoing T cell exhaustion as rapidly as observed in viremic and treated individuals due to less expression of inhibitory receptors, including PD-1, CTLA-4, and LAG-4 on memory cell population (25).
This study has few limitations, the number and distribution of study participants in each group are quite small that might affect the statistical analysis; however, to the best of our knowledge, the prevalence of these individuals is low. Another limitation is not being able to distinguish between intrinsic proliferative capacity of HIV-specific cells in each memory compartment versus proportions of HIV-specific T cells in each memory population for each patient cohort. We also acknowledge the fact that functional data such as surface expression of inhibitory markers, activation markers, and investigation of IFN-γ production by cytotoxic cell population would have further supported our findings.
Conclusion
We characterized the proliferative capacity of CD4 and CD8 T cells in HIV-1 subtype C-infected population for the first time. We also described a clear proliferative difference in CM T cell subset based on disease progression and viral control rates that highlights the need for exploration of newer avenues of research to identify new therapies aimed at normalizing perturbations of T cell compartment.
Footnotes
Acknowledgment
We thank Indian Council of Medical Research (ICMR), Government of India (ref. no. P-45/04.08.2009), for providing research infrastructure and financial support.
Author Disclosure Statement
No competing financial interests exist.
References
Supplementary Material
Please find the following supplemental material available below.
For Open Access articles published under a Creative Commons License, all supplemental material carries the same license as the article it is associated with.
For non-Open Access articles published, all supplemental material carries a non-exclusive license, and permission requests for re-use of supplemental material or any part of supplemental material shall be sent directly to the copyright owner as specified in the copyright notice associated with the article.