
Abstract
Altered T cell profiles have been linked with metrics of persistent cytomegalovirus (CMV) infections in healthy aging and older HIV patients stable on antiretroviral therapy (ART). In this study, we use CMV DNA to identify active infections, and levels of CMV-reactive antibody to assess the persistent burden of CMV in a longitudinal study of 78 young adult patients beginning ART in Jakarta, Indonesia, with <200 CD4 T cells/μL. CMV antibodies, inflammatory markers (C-reactive protein [CRP], soluble interferon-α/β receptor) and T cell phenotypes were assessed before ART (V0) and after 1, 3, 6, and 12 months (V1–V12). CMV DNA was detected in 41 patients (52%) at V0, irrespective of CD4 T cell counts, gender, age, or plasma HIV RNA. CMV DNA+ patients had higher levels of antibody reactive with CMV Immediate Early 1 (IE-1) at V0 and V12 (p = 0.04), and with CMV lysate at V12 (p = 0.01). Detectable CMV DNA did not align with inflammatory markers, but associated with lower CD4/CD8 ratios until V3. CMV antibody levels correlated inversely with proportions of naive CD4 and CD8 T cells, and directly with proportions of CD57+ and activated memory T cells (CD3+ CD45RA−) after 3–12 months on ART. Overall, active CMV replication is common in HIV patients beginning ART in Indonesia and associates with low CD4/CD8 ratios. Elevated levels of CMV-reactive antibody measured on ART also mark a depletion of naive T cells, accumulation of memory T cells, and may be a stable metric of the burden of CMV.
Introduction
P
We have defined the “footprint” of CMV as its effects on the immune system and on health outcomes (28). Assessment of the footprint in a particular patient begins with a reliable metric of the burden of CMV in the body and whether it is active or latent. This is complicated by the episodic nature of CMV reactivation and replication, so levels of antibody may be a more stable metric of the average burden of CMV. CMV antibodies have been used to study the effects of the virus on T cells in a number of scenarios, which reveal different aspects of a complex picture. In Australian HIV patients, levels of antibody reactive with CMV rose on ART and then decreased but remained above those seen in the general population for many years (7). A French study included seronegative patients and linked seropositivity with persistently low CD4/CD8 T cell ratios on ART (8,22). Levels of CMV-reactive antibody have also been linked with reduced numbers of naive T cells in healthy aging (3) and in older Australian HIV patients stable on ART (2). CMV has not been studied in a resource-constrained Asian setting, but we have described deficits in naive CD4 T cell numbers and monitored their function in Indonesian patients recovering on ART (26).
In this study, we use the detection of CMV DNA in blood granulocytes at the commencement of ART as a measure of active CMV replication at that time, while levels of CMV-reactive antibody in plasma were monitored as a measure of the persistent viral burden in an individual patient (28). CMV was detected more frequently in granulocytes than peripheral blood mononuclear cells (PBMCs) in preliminary studies, consistent with a role as scavengers of infected endothelial cells (17). We also assessed the activation and differentiation of CD4 and CD8 T cells before and on ART, with plasma C-reactive protein (CRP) as a marker of immune activation, and levels of a soluble receptor of type 1 interferons (sIFNα/βR). This can regulate the activity of IFNα/β through competition at high concentrations and stabilization at lower concentrations (20). While HIV and CMV induce sIFNα/β in vitro, the short half-lives of these molecules hamper meaningful analyses in vivo. Levels of sIFNα/βR may be downregulated in HIV patients with poor control of HIV on ART—potentially increasing the antiviral activity of IFNα/β (25).
Materials and Methods
Study subjects
The JakCCANDO study cohort (Jakarta CMV Cardiovascular ART Neurology Dentistry Ophthalmology) at the HIV/AIDS clinic of Cipto Mangunkusumo Hospital (Jakarta, Indonesia) comprised 82 ART-naive HIV patients aged 18–40 years, beginning ART with <200 CD4 T cells/μL in 2013–2014 (19). Blood samples were collected before ART (V0) and 1, 3, 6, and 12 months later (V1–V12). By V12, 14 patients had died, been lost to contact, withdrawn from ART, or become pregnant. Patients were tested for pulmonary tuberculosis (chest X-ray and sputum acid bacilli smear) at V0. Control donors (n = 19) matched with the patients by gender, age, and ethnicity were sampled once for immunophenotypic analyses. Controls were healthcare workers with no declared risk of infection with HIV. The study was approved by Faculty of Medicine, Universitas Indonesia, Cipto Mangunkusumo Hospital and Curtin University Ethics Committees. Participants provided written informed consent.
CD4 T cell counts were determined by routine flow cytometry. Plasma HIV RNA was measured using a Cobas Amplicor Monitor (Roche Molecular Diagnostics, Pleasanton, CA). PBMC were isolated by Ficoll density centrifugation and cryopreserved in liquid nitrogen. Plasma samples and buffy coats (collected from the surface of the erythrocyte pellet after Ficoll centrifugation) were preserved at −80°C.
CMV antibody and DNA
CMV-reactive IgG was quantified using 96-well plates coated with a lysate prepared by sonication of human foreskin fibroblasts infected with CMV strain AD169, or with CMV Immediate Early 1 (IE-1) protein prepared in Escherichia coli (Miltenyi Biotech, Cologne, Germany). Plates were coated overnight at 4°C, blocked with 5% bovine serum albumin and plasma samples were added (1:10,000 for CMV lysate and 1:300 for CMV IE-1, followed by threefold dilutions). Bound IgG was detected using goat anti-human IgG—horseradish peroxidase, followed by tetramethylbenzidine substrate (Sigma-Aldrich, St Louis, MI). CMV-reactive antibodies were quantitated relative to a standard plasma pool assigned a value of 1,000 arbitrary units (AU) (7). The protocol provides accurate quantitation in the high range.
Primer and probe sequences targeting the UL54 gene have been described previously (19). Total DNA was extracted with QIAamp DNA Blood Mini Kits (Qiagen, Hilden, Germany) and stored at −80°C. Quantitative polymerase chain reactions (PCR) were performed in 20 μL containing 10 μL Universal PCR Master mix (2 × concentration contains AmpliTaq Gold® DNA Polymerase, dNTPs with dUTP, buffer components, ROX reference dye and uracil N′-glycosylase; Applied Biosystems, Foster City, CA), 0.8 μL 10 μM primers, 0.6 μL 5 μM TaqMan probe, and 5 μL DNA. Cycling conditions were 2 min at 50°C, 10 min at 95°C, and activate AmpliTaq Gold DNA polymerase, followed by 40 cycles of 15 sec at 95°C and 60 sec at 60°C. Results were normalized against the single-copy housekeeping gene, β2-microglobulin to provide a standardized metric in AU. The protocol was adopted following a pilot study comparing plasma, PBMC and buffy coats. We identified CMV in 1/15 plasma samples, 5/15 buffy coats, and 1/19 PBMC samples (unpublished data). Samples were assayed in duplicate and only declared as positive when CMV UL54 qPCR peaks appeared in replicates.
Immune activation markers
Soluble receptors for interferon-α/β were assessed in plasma using human IFNAR2 enzyme-linked immunosorbent assay (ELISA) Kits (generously provided by PBL Assay Science, Piscataway, NJ). Plasma levels of CRP were quantified using an ELISA antibody pair (R&D Systems, Minneapolis, MN).
T cells immunophenotyping
PBMC were thawed and aliquots of 1 × 10⁶ cells were fixed with BD Cytofix/Cytoperm and stained for 15 min with CD3-APC-H7 clone SK7, CD4-PerCP-Cy5 clone RPA-T4, CD45RA-PeCy7 clone L48, CD27-BV510 clone L128, CD38-PE clone HIT2, CD57-APC clone NK-1, and HLADR-BV421 clone G46-6 (Becton Dickinson Biosciences, San Jose, CA). Stained cells were washed, and eight-color data were acquired on a Becton Dickinson FACS Canto II and analyzed using FlowJo (Tree Star, San Carlos, CA). Gating strategies are presented in Supplementary Figure S1 (Supplementary Data are available online at
Statistical analyses
As many parameters deviated from normal distributions (Shapiro–Wilk test), bivariate analyses used nonparametric statistics and are presented as median (range). Continuous variables were assessed using Wilcoxon paired tests (for changes over time) or Mann–Whitney unpaired tests (to compare groups). Correlations were analyzed by Spearman's rank tests. T cell profiles that approached normal distributions were also assessed using two-way analysis of variance (AOV).
Results
CMV replication was assessed via the presence of CMV DNA at V0 and persistent CMV infection via levels of antibodies (Table 1). CMV DNA was detected in 41/78 patients at V0 (52%) and did not align with gender, age, or plasma HIV RNA (p ≥ 0.01). Patients with CMV DNA at V0 had marginally lower CD4 T cell counts (p = 0.09) and higher levels of CMV IE-1 antibody (p = 0.04). CMV DNA+ patients also had higher levels of CMV antibody after 12 months, whereas the association with CD4 T cell counts disappeared on ART. CMV DNA was more commonly detected in patients with pulmonary tuberculosis at V0 (χ 2, p = 0.04).
p-Values <0.05 are marked in bold.
Mann–Whitney tests comparing patients with and without CMV DNA at V0.
Fisher's exact test.
ART, antiretroviral therapy; AU, arbitrary units; CMV, cytomegalovirus; CRP, C-reactive protein; IE-1, Immediate Early 1; sIFNα/βR, soluble receptor of type 1 interferons.
Persistent (if intermittent) replication of CMV is a likely scenario as levels of antibody reactive with CMV lysate or CMV IE-1 rose on ART, stabilizing between V6 and V12 (Fig. 1A, B). Levels of antibody reactive with CMV IE-1 were higher in patients with CMV DNA at V0 and V12 while CMV lysate only showed a significant difference at V12 (Table 1). Levels of antibody recorded at V0, V1, V3, V6, and V12 were tightly correlated (lysate: r = 0.48–0.81, IE-1: r = 0.64–0.89, p < 0.001), so high or low responses are a stable feature of an individual. Levels of CMV lysate antibody at any visit correlated with age (r = 0.23–0.28, p = 0.07–0.02), while high levels of CMV IE-1 antibody associated with low CD4 T cell counts at V0 (r = −0.34 to −0.40; p = 0.01–0.002).
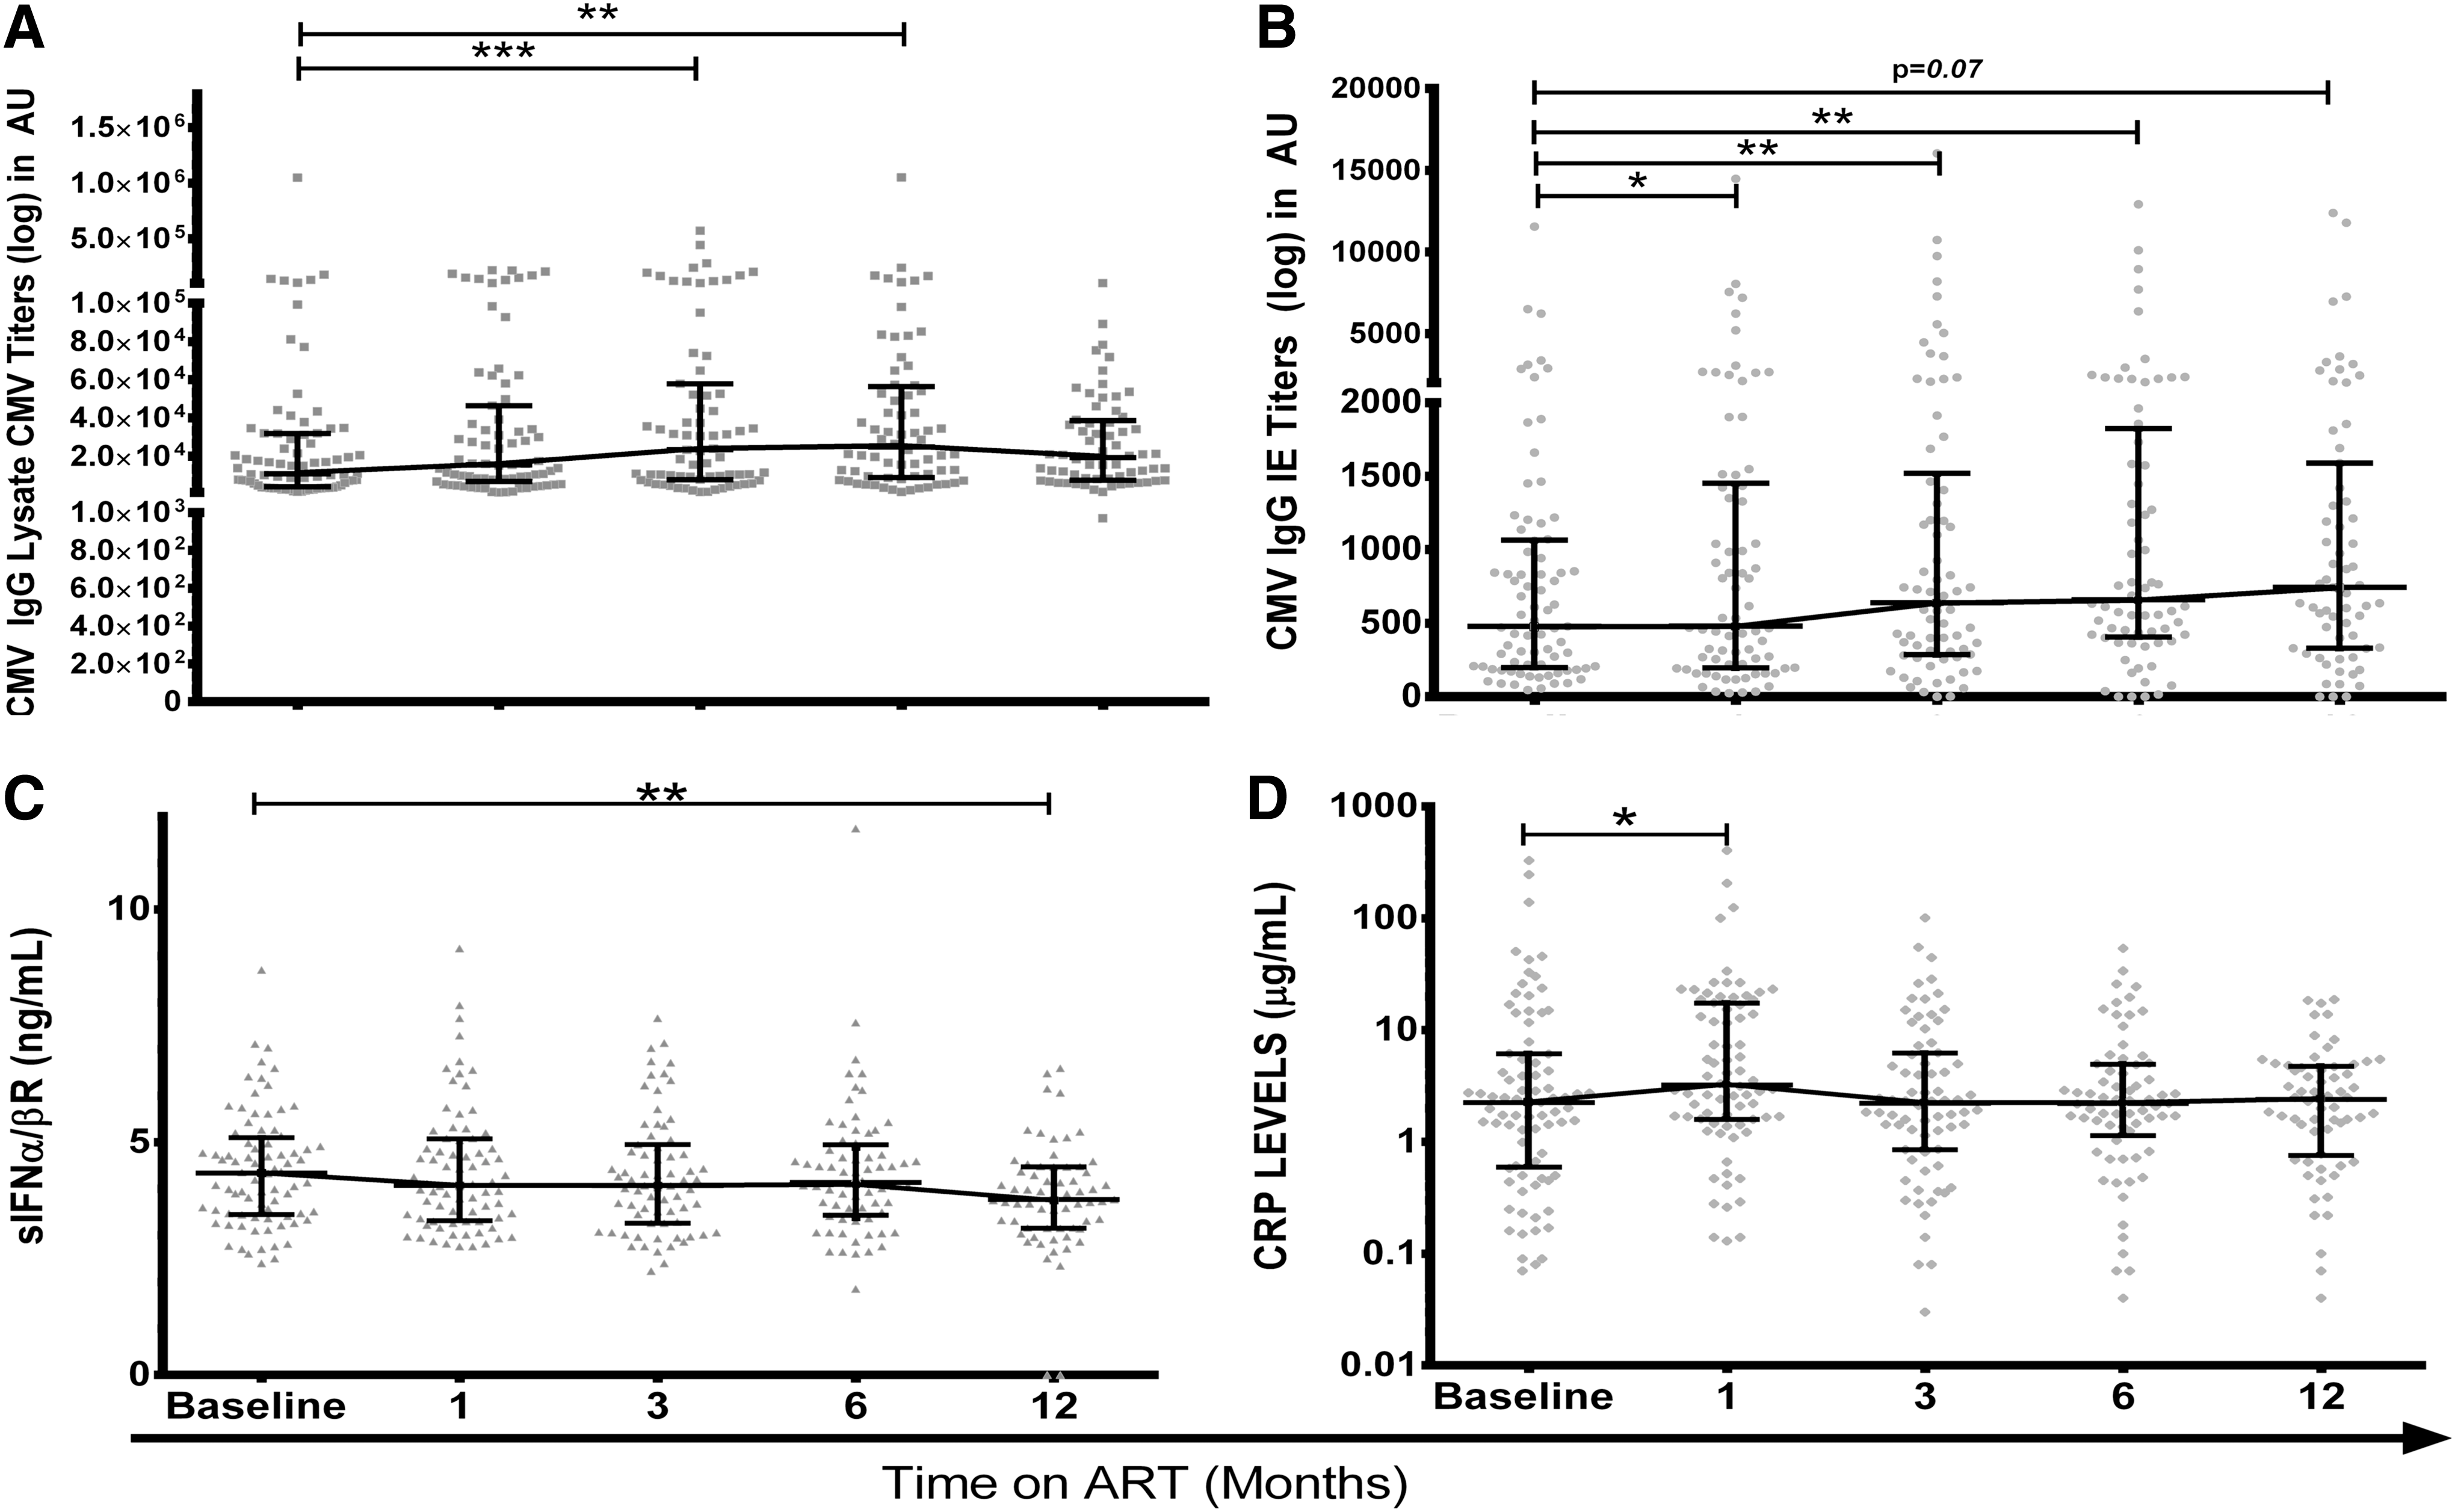
Plasma markers of CMV infection and immune activation.
If CMV is simply a marker of “inflammaging” (10,11), then the burden of CMV would correlate with levels of inflammatory markers. In this study, sIFNα/βR levels declined over 12 months on ART (Fig. 1C), but patients with and without CMV DNA had similar levels at V0 and V12 (Table 1) and V1, V3, and V6 (data not shown). Levels of sIFNα/βR did not correlate with antibodies reactive with CMV lysate or CMV IE-1 (r = −0.03 to 0.18, p > 0.15). CRP levels rose between V0 and V1 (p = 0.04) and then stabilized from V3 to V12 (Fig. 1D), While CMV DNA positivity did not affect CRP levels, correlations between CMV IE-1 antibodies and levels of CRP were significant at V3 and V12 (r = 0.27–0.29, p = 0.03).
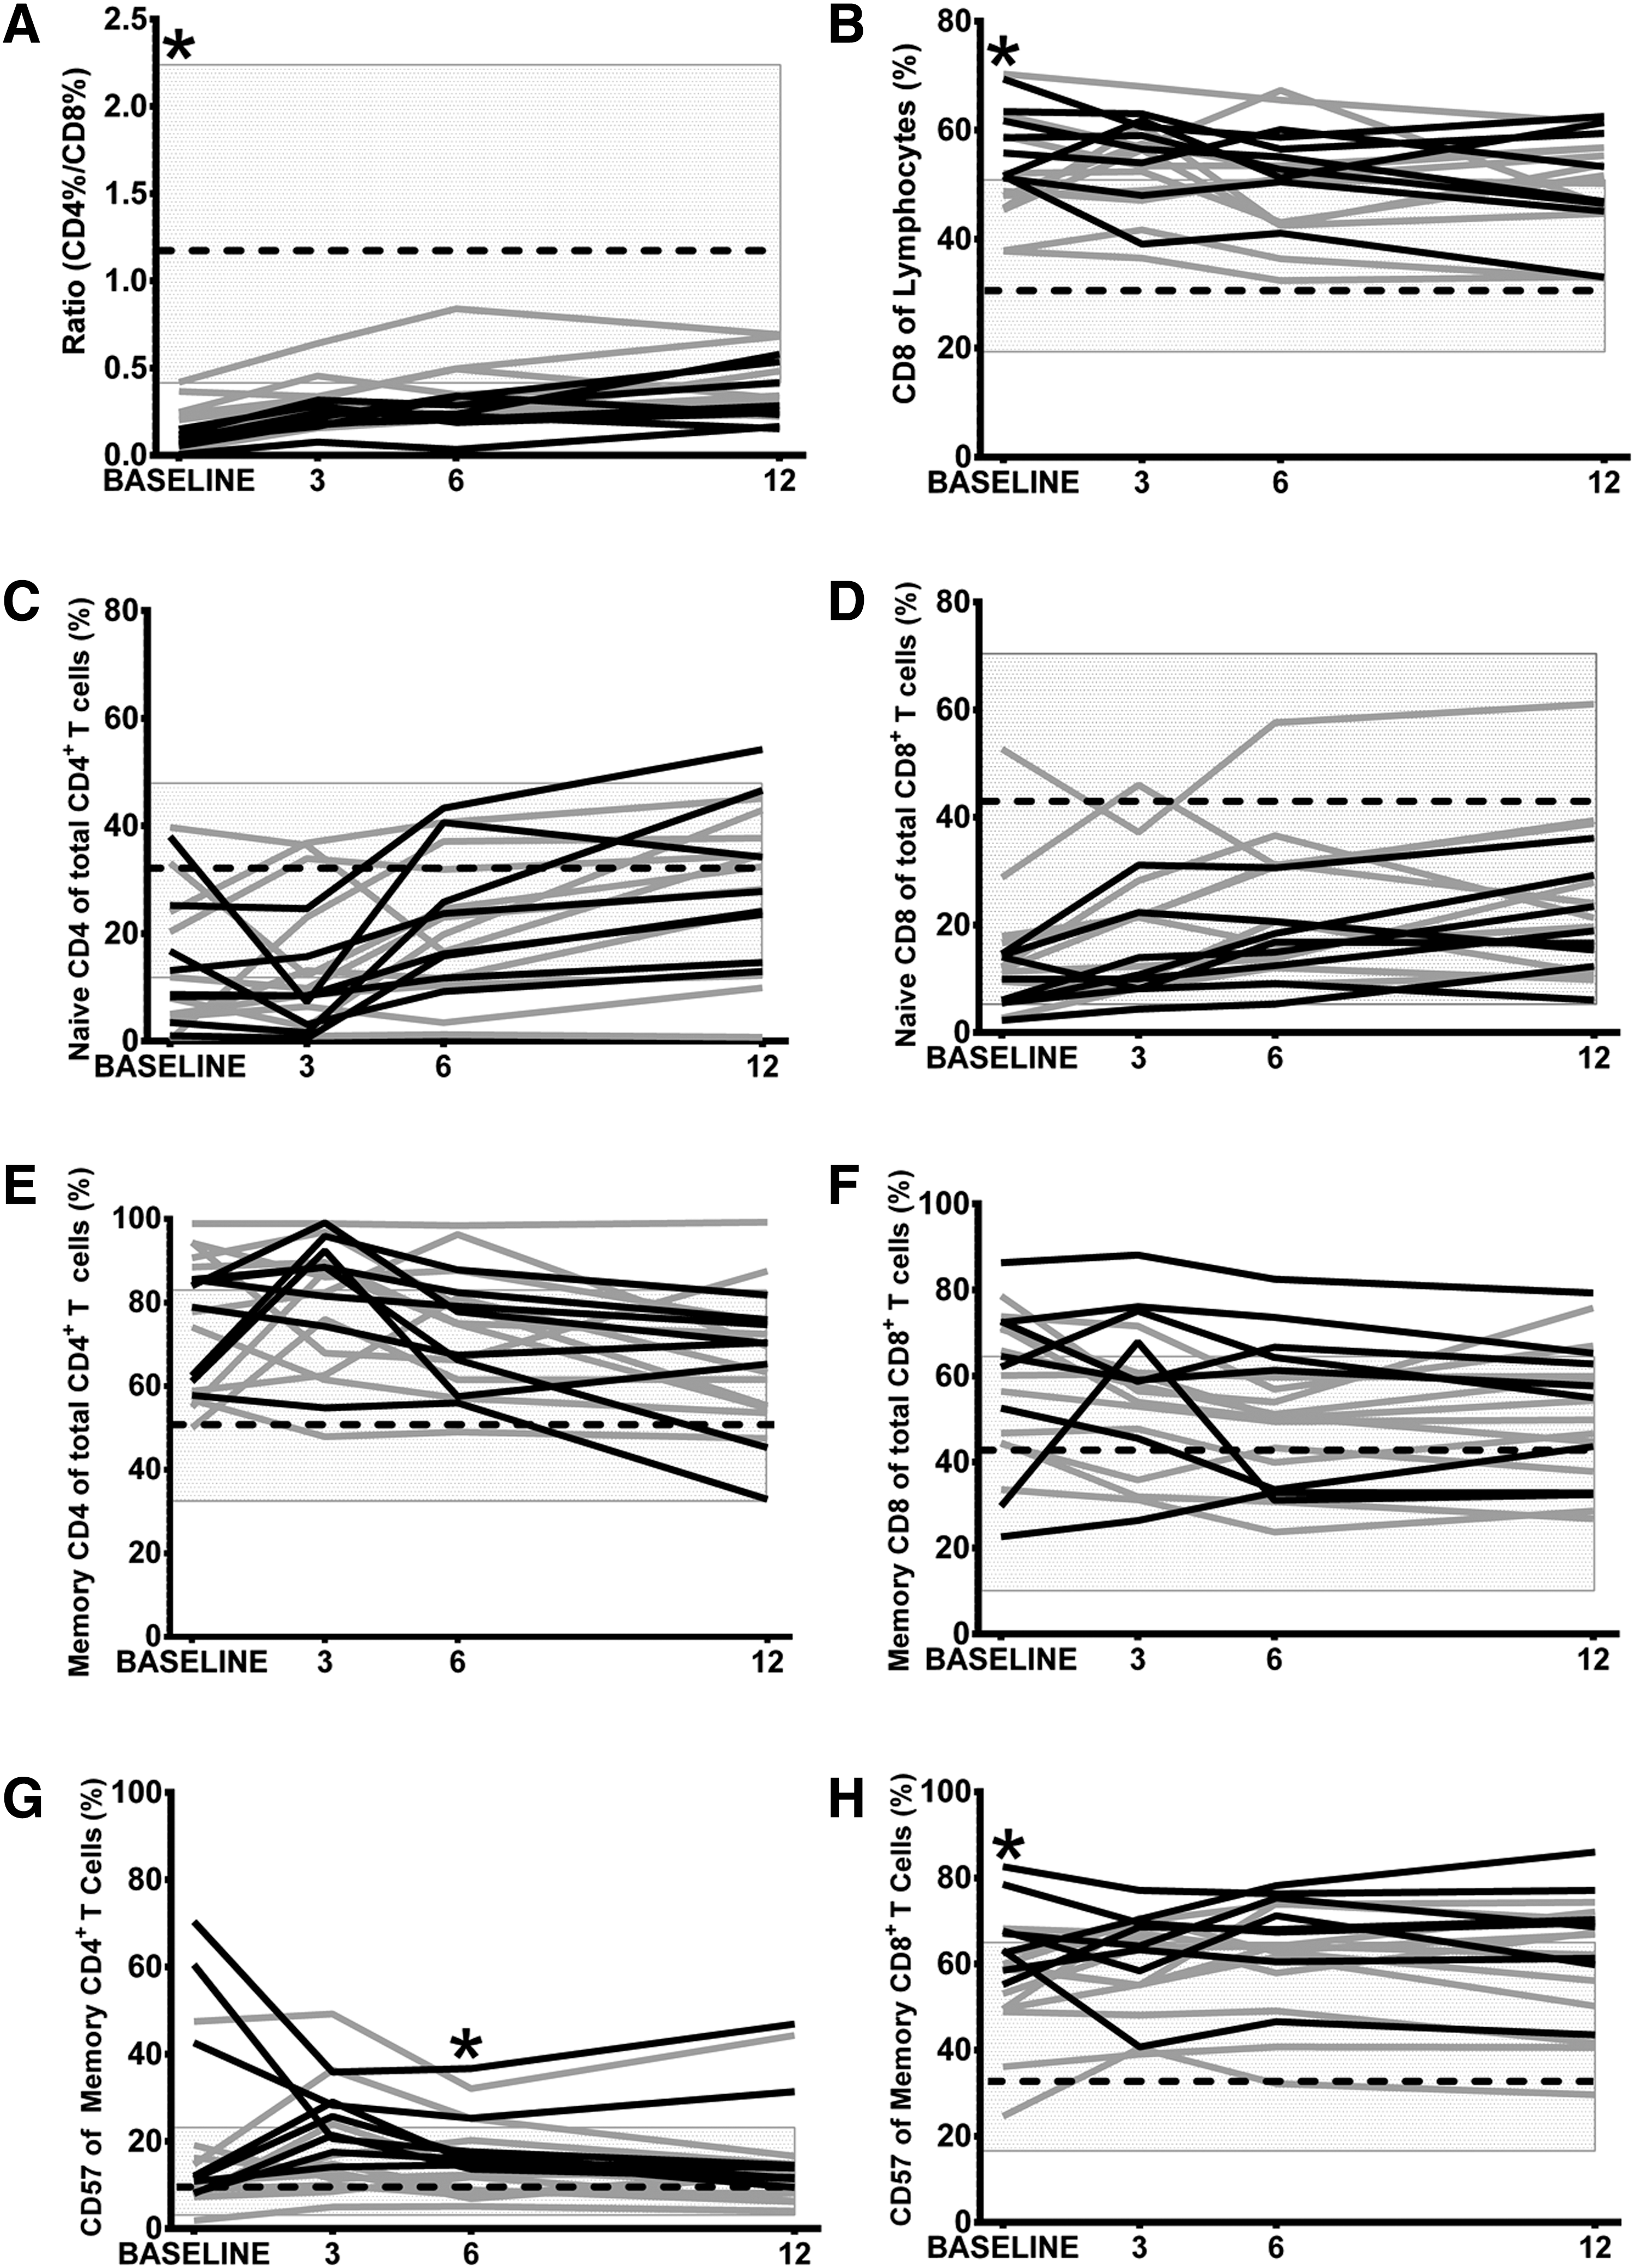
T cell profiles were then assessed in a subset of patients with and without detectable CMV DNA at V0. The patients tested (n = 19) were representative for the JakCCANDO cohort (Supplementary Table S1). The detection of CMV DNA was associated with lower CD4 T cell counts (AOV, p = 0.001) irrespective of the time of assay (interaction term, p = 0.95). CD8 T cell proportions were slightly higher in CMV DNA+ patients (AOV, p = 0.06) irrespective of the time of assay (interaction term, p = 0.78). CD4/CD8 ratios were low in patients with CMV DNA at V0 (Fig. 2A, p = 0.03), reflecting the higher numbers of CD8 T cells (Fig. 2B; p = 0.03). Accordingly, CMV DNA load quantitated at V0 correlated inversely with the percentage of CD4 T cells (r = −0.50, p = 0.03) and CD4/CD8 ratios (r = −0.62, p = 0.01) at V0. Associations with CD4/CD8 ratios remained at V1 and V3 (r = −0.55 to −0.52, p = 0.01–0.02), but not thereafter.
The effects of CMV DNA detected at V0 on T cell profiles.
Levels of CMV lysate antibody showed no significant correlations with CD4/CD8 ratios at V0–V3, but at V6 correlated inversely with CD4/CD8 ratios (r = −0.48, p = 0.03), directly with proportions of CD8 T cells (r = 0.41, p = 0.08) and inversely with proportions of CD4 T cells (r = −0.50, p = 0.02). This pattern was maintained at V12 (Table 2).
Spearman's rank correlation tests. As a visual aid, all correlations achieving p < 0.10 are marked. Positive correlations are in bold. Negative correlations are in italics.
CD45RA+ CD27+ CD4 or CD8 T cells.
CD45RA− CD4 or CD8 T cells.
CD38+ HLA-DR+ CD45RA− CD4 or CD8 T cells.
CD45RA+ CD27− CD4 or CD8 T cells.
Irrespective of CMV DNA, CD4 T cell recovery was evident through increased naive (CD45RA+ CD27+; AOV; CMV: p = 0.87; time: p = 0.001; interaction: p = 0.98, Fig. 2C) and decreased memory (CD45RA−) CD4 T cells (AOV; CMV: p = 0.95; time: p = 0.03; interaction: p = 0.76, Fig. 2E). CMV DNA+ patients had less naive CD8 T cells (AOV; CMV: p = 0.002; time: p = 0.07; interaction: p = 0.98, Fig. 2D), with marginally more memory CD8 T cells (AOV; CMV: p = 0.13; time: p = 0.46; interaction: p = 0.66, Fig. 2F) and increased expression of CD57 on CD8 memory T cells (AOV; CMV: p = 0.0006; time: p = 0.79; interaction: p = 0.77, Fig. 2H) and terminally differentiated CD8 TEMRA (CD45RA+ CD27; AOV; CMV: p = 0.02; time: p = 0.11; interaction: p = 0.87, data not shown). This was reflected in univariate analyses where the presence of CMV DNA associated with higher proportions of memory CD4 T cells expressing CD57 at V6 (Fig. 2G; Mann–Whitney, p = 0.04) and memory CD8 T cells expressing CD57 at V0 (Fig. 2H, p = 0.03).
Accordingly, as patients began ART, we observed negative correlations between levels of CMV lysate antibody and proportions of naive CD4 T cells (V0–V3; r = −0.43 to −0.63, p = 0.02–0.004) and naive CD8 T cells (V1–V12: r = −0.42 to −0.81, p = 0.08 to <0.001). These paralleled positive correlations between levels of CMV antibodies and proportions of memory T cells and CD57+ memory T cells, while proportions of TEMRA (with or without CD57) were not correlated with levels of antibody reactive with CMV (Table 2).
Univariate analyses found no significant differences between proportions of activated (CD38+ HLA-DR+) CD4 or CD8 T cells based on the presence of CMV DNA at V0 (data not shown). Moreover, levels of CMV lysate antibody were not correlated with proportions of activated memory T cells at V0, but direct correlations were evident on ART (Table 2). This was clearest and most consistently observed with CD4 T cells, where associations with CMV IE-1 antibody were also apparent at V0. Hence, CMV antibody may align weakly with the activation of memory T cells.
Discussion
CMV DNA was detected in buffy coats (granulocytes) from 52% of patients as they began ART. Patients with CMV DNA at V0 had only marginally lower CD4 T cell counts. In a Thai cohort, Durier et al. identified CMV DNA in 28% of patients at baseline and 4.5% of the subset retested after 6 months on ART (10). Spontaneous clearance of CMV DNA from whole blood on ART was also reported in an older British study (9). In this study, few buffy coats were available from later time points, but CMV DNA was detected in 13/23 patients tested at V3 and 1/3 patients tested at V12. However, direct comparisons between studies are confounded by differences in the sensitivity of the assays. Durier et al. used Abbott CMV PCR Kit assays, as used in clinical practice. Despite their greater sensitivity (44 copies/mL), they are based on plasma. We optimized our in-house assay through the use of buffy coats. CMV does not replicate in granulocytes, but they can take up debris from infected endothelial cells. This fits the greater efficiency of detection of CMV DNA in whole blood or buffy coats when compared with plasma in publications (4,12) and in our pilot study. However, a failure to find CMV DNA in blood does not preclude CMV replication somewhere else in the body (12,14).
Levels of antibody recorded at different timepoints were tightly correlated, so high or low responses are a stable feature of an individual. Levels of CMV lysate antibody at any visit correlated with age, while high levels of CMV IE-1 antibody associated with low CD4 T cell counts at V0. This supports CMV lysate antibody as a marker of the lifelong burden of CMV, while CMV IE-1 antibody may mark recurrent CMV reactivations in patients with a history of severe immunodeficiency (6,19).
To evaluate CMV as a marker of “inflammaging” (10), we assessed plasma CRP (a broad spectrum inflammatory marker) and sIFNα/βR as a putative marker of a type 1 interferon response. The sIFNα/βR levels declined over 12 months on ART but did not associate with CMV DNA or antibodies, so the decline cannot be attributed to lower production of IFNα/β following the cessation of CMV or HIV replication. Unfortunately, we were unable to measure IFNα/β in plasma with kits from the same supplier (PBL Assay Science). CRP levels rose between V0 and V1 and then stabilized. While detectable CMV DNA did not affect CRP levels, correlations between CMV IE-1 antibodies and levels of CRP were significant at V3 and V12. While this has not been shown previously, a study of Ugandan women starting ART linked elevated plasma CRP with levels of CMV-reactive antibodies assessed with a commercial kit that may detect CMV IE-1 antibody (21).
When T cell profiles were assessed in a representative subset of patients, CMV DNA load correlated inversely with the percentage of CD4 T cells and CD4/CD8 ratios before ART. Associations with CD4/CD8 ratios remained at V1 and V3, but not thereafter. This disconnect may reflect clearance of CMV DNA from some patients in our study, as CMV DNA detected in PBMC and the patient's age associated with CD4/CD8 ratios over 3 years when ART was initiated in early HIV disease (24). Here, levels of CMV lysate antibody at V6 and V12 correlated inversely with CD4/CD8 ratios, directly with proportions of CD8 T cells and inversely with proportions of CD4 T cells. This pattern suggests that the antibody measured on ART may be a stable measure of the burden of CMV affecting T cells. Accordingly, low CD4/CD8 ratios have been linked with CMV seropositivity in French patients stable on ART (8,22), but all patients in our cohort were CMV seropositive. The absence of correlations with CMV antibodies recorded before ART may arise because immunodeficiency limits humoral responses to the high burden of CMV at that time.
When we considered T cell phenotypes, patients with detectable CMV DNA had less naive CD8 T cells. We also observed negative correlations between levels of CMV lysate antibody and proportions of naive CD4 and CD8 T cells. Proportions of TEMRA and CD57+ TEMRA were stable on ART and not correlated with CMV DNA or antibodies, while proportions of memory (CD45RA−) T cells and their expression of CD57 were affected by CMV. It may be important that our patients are younger than patients in most previous studies, as proportions of “late-differentiated” T cells (CCR7+ CD45RA− CD27− CD28−) were increased by CMV seropositivity in healthy older adults (27). Another study linked high levels of CMV antibodies and increased antibody avidity with increased frequencies of “terminally differentiated” (CD57+ and CD27− CD28−) T cells in HIV patients older than 45 years of age, on ART for a median of 12 years (5). The choice of markers used to define memory and “terminally differentiated” T cells is also critical as the stages of T cell development affected by CMV and by age remain unclear. With the inclusion of CD45RA, frequencies of CD57+ TEMRA were similar in CMV seropositive healthy older adults and HIV patients stable on ART (2), suggesting HIV may accelerate a late aspect of the aging process without affecting the final outcome.
Elevated CMV antibody levels in HIV patients on long-term ART have been associated with increased expression of immune activation markers on T cells (13). In this study, bivariate analyses found no significant differences between proportions of activated (CD38+ HLA-DR+) CD4 or CD8 T cells based on the presence of CMV DNA or levels of CMV lysate antibody. However, proportions of activated memory T cells correlated with CMV antibodies assessed on ART (Table 2). This was clearest and most consistently observed with CD4 T cells. Hence, CMV antibody may align weakly with the activation of memory T cells. As proportions of activated T cells were not affected by the presence of CMV DNA at baseline, short-term events at ART initiation may be less important than the persistent burden of CMV measured by the level of antibody.
A limitation of this study is the small sample size used for immunophenotypic analyses. Although patients were recruited from a single clinic, they had different coinfections (including tuberculosis) and varied responses to ART. This variability hampered multivariable regression analyses, so our study is predominantly descriptive. Moreover, CMV DNA was only sought systematically at baseline. However, we confirm CMV-reactive antibody as a simple and stable metric of the CMV burden, and link elevated CMV antibodies with depletion of naive T cells and expanded pools of memory T cells expressing CD57. Associations between these measures of CMV burden and cardiovascular change in our cohort have been described (19).
Footnotes
Acknowledgments
The authors thank the patients who participated in this study, Ms. Faizah for coordination of patient visits and assembly of the database, and the Dharmais Hospital Clinical Pathology Laboratory for flow cytometry facilities. The project was supported by Universitas Indonesia, Curtin University and the Indonesian Ministry of Health (RISBIN IPTEKDOK 2015).
Author Disclosure Statement
No competing financial interests exist.
References
Supplementary Material
Please find the following supplemental material available below.
For Open Access articles published under a Creative Commons License, all supplemental material carries the same license as the article it is associated with.
For non-Open Access articles published, all supplemental material carries a non-exclusive license, and permission requests for re-use of supplemental material or any part of supplemental material shall be sent directly to the copyright owner as specified in the copyright notice associated with the article.