
Abstract
An immune cell's phenotype expresses through its high-dimensional marker signature. Cluster analyses of data from high-throughput mass and flow cytometry marker panels permit discovery of previously undescribed immune cell phenotypes. Impactful reporting of new phenotypes demands low-dimensional visualization tools that preserve with integrity phenotypes' original high-dimensional structure. For this purpose, we introduce penalized supervised star plots. As designed and as we demonstrate, penalized supervised star plots are two-dimensional projections that tend to preserve separation of clusters as well as information on the relative contributions of various markers in differentiating phenotypes. The new method is robust to markers that do not differentiate phenotypes at all, as shown in a challenge data set. Results include comparison with other popular procedures. Penalized supervised star plots incorporate cross-validation to permit portability of estimated optimal projections to new samples. Supervised star plots are further illustrated with a featured influenza-specific T cell data set as well as a peripheral blood mononuclear cell phenotyping data set.
Introduction
Mass and flow cytometry data are becoming increasingly high dimensional, with quantities of markers ranging from 10 to 40 or more. Because an immune cell's phenotype is quantifiable through its cytometry marker signature, cluster analyses [sensu (10)] of high-dimensional, high-throughput mass or flow cytometry marker panels permit discovery of previously undescribed immune cell phenotypes. When coupled with viral antigen stimulation experiments, discovery of new virus-specific immune cell phenotypes becomes possible.
While any such newly discovered phenotypes can be described in words or in row column tabular format, impactful reporting of new phenotypes demands visualization tools that immediately, clearly, and intuitively convey salient marker signatures. A particularly intuitive approach treats each distinct phenotype as a cohesive “cloud” of cells occupying a distinct local neighborhood within the original high-dimensional space, in which each constituent dimension is a separate marker that helps to define the phenotype. The challenge is to display this high-dimensional cloud in low-dimensional space (2D or 3D) and yet retain this intuitive visual summary of marker expression. Various information-preserving low-dimensional projections have been developed, including principal component analysis (PCA) (24), self-organizing maps (17), t stochastic neighbor embedding (tSNE) (20), radial visualization (Radviz) (12), discriminant analysis of principal components (DAPC) (14), and star coordinates (15). PCA, self-organizing maps, Van Long and Linsen's star plot method (33), and tSNE are all unsupervised techniques that attempt to portray high-dimensional clusters with fidelity into two or three dimensions. In stark contrast, the approach presented here is fully supervised. Penalized supervised star plots (PSSs) capitalize on existing estimates of high-dimensional cluster structure to optimize their display and marker information in two dimensions. Supervision has the important advantage that it allows the user complete freedom for estimating an optimal cluster solution (or multiple solutions by different clustering methods if comparison is of interest) in the original high-dimensional marker space. Then, having identified that solution, the user can portray (project) that solution with fidelity into two dimensions using PSSs. The PSS projection also retains information, via a penalty term, on how different markers contribute to separation of the high-dimensional clusters, scaled by within-group dispersion (23). This designed property of preservation of original high-dimensional information within two dimensions is crucial to accurate biological interpretation. The proposed method includes an additional penalty term to diminish markers that do not contribute to cluster structure, as demonstrated in this study.
Clustering is an unsupervised procedure that seeks to estimate the true quantity of clusters and their composition, as defined by the input markers. If clusters are provided as “known” (i.e., input), classification procedures (such as linear discriminant analysis [LDA]) can be applied to estimate those boundaries that optimally separate the clusters in the space of the input markers. As such, the goals of clustering and classification procedures extend far beyond two-dimensional (2D) visualization. For example, LDA is a general classification procedure designed to estimate boundaries that separate clusters (classes) in two (boundaries are lines) or more dimensions (boundaries are hyperplanes) (9). PSS is not a clustering procedure but rather a specialized 2D visual classifier of clustering results. PSS has two specialized objectives: (1) strictly 2D maximal visual separation of high-dimensional preexisting clusters (2) overlain with 2D marker-specific vectors of lengths and directions that facilitate biological interpretation of the preexisting high-dimensional cluster solution. One can constrain other general utility classifiers to “force” a 2D classification (as shown in the Results section and Supplementary Data); but PSS goes further and (via two penalty terms) preserves and displays biologically interpretable information in two dimensions for each of the preexisting clusters and their markers. In this study, we compare PSS to the popular method of DAPC (14).
Materials and Methods
Proposed star plot algorithm
Let
The rows in
Estimation proceeds via
for selected real scalars
CyTOF experiments
For the peripheral blood mononuclear cell (PBMC) phenotyping data set, a cryopreserved healthy donor PBMC sample was thawed and stained with a 38 antibody panel, as described previously (19). CyTOF® data were collected on a Helios™ instrument from Fluidigm (South San Francisco, CA). Manual gating was used to create five clusters: CD4+ T cells, CD8+ T cells, B cells, NK cells, and monocytes using FlowJo version 10.2 from TreeStar, Inc. (Ashland, OR).
For the influenza-specific T cell data set, PBMC from 24 healthy participants, who received an influenza vaccine 7 days prior, were stimulated for 8 h with overlapping peptides corresponding to influenza HA and M1 proteins (JPT, Berlin, Germany), along with 5 μg/mL each of brefeldin A and monensin (Sigma, St. Louis, MO). Cells were then prepared and stained for CyTOF mass cytometry as described (19). Approximately 106 total cells were collected per participant; and those CD4+ T cells at 7 days expressing any cytokine(s) under HA+M1 stimulation were isolated as influenza-specific cells for cluster analysis and subsequent PSS visualization. A phenotyping solution was obtained via a ragged pruning (5) of an agglomerative hierarchical clustering applied to the denoised data (25), with cluster quality assessed with the silhouette index (27).
PSS construction was performed in R Package via base function optim, using method = “BFGS,” with additional utilities from matrixcalc (22), plotrix (18), JPEN (21), and VCA (28). Example R script is available online at the Stanford Medicine ME/CFS Initiative web page (30).
PCA was performed in R. viSNE, a graphical user interface tool based on tSNE, available on Cytobank was used on both CyTOF data sets. Radviz and the popular, supervised method of DAPC were performed in R using the software packages publicly available on the Comprehensive R Archive Network (CRAN) (1,13).
Results
Application of PSSs to three independent data sets
We first applied PSSs to a “challenge” data set. Although not immunological, Fisher's iris phenotype data set was selected for its public availability in base R. These data consist of 50 observations each on four phenotypic traits (sepal and petal length and width) in three species. To examine the designed robustness of our method, we augmented this iris data set with 50 additional columns of variables correlated with each other but not with phenotype via pseudorandom draws from a multivariate standard normal distribution with correlation structure created using R package clusterGeneration (26). As detailed in Figure 1, the PSS method shrunk all noise “marker” projection coefficients (components of
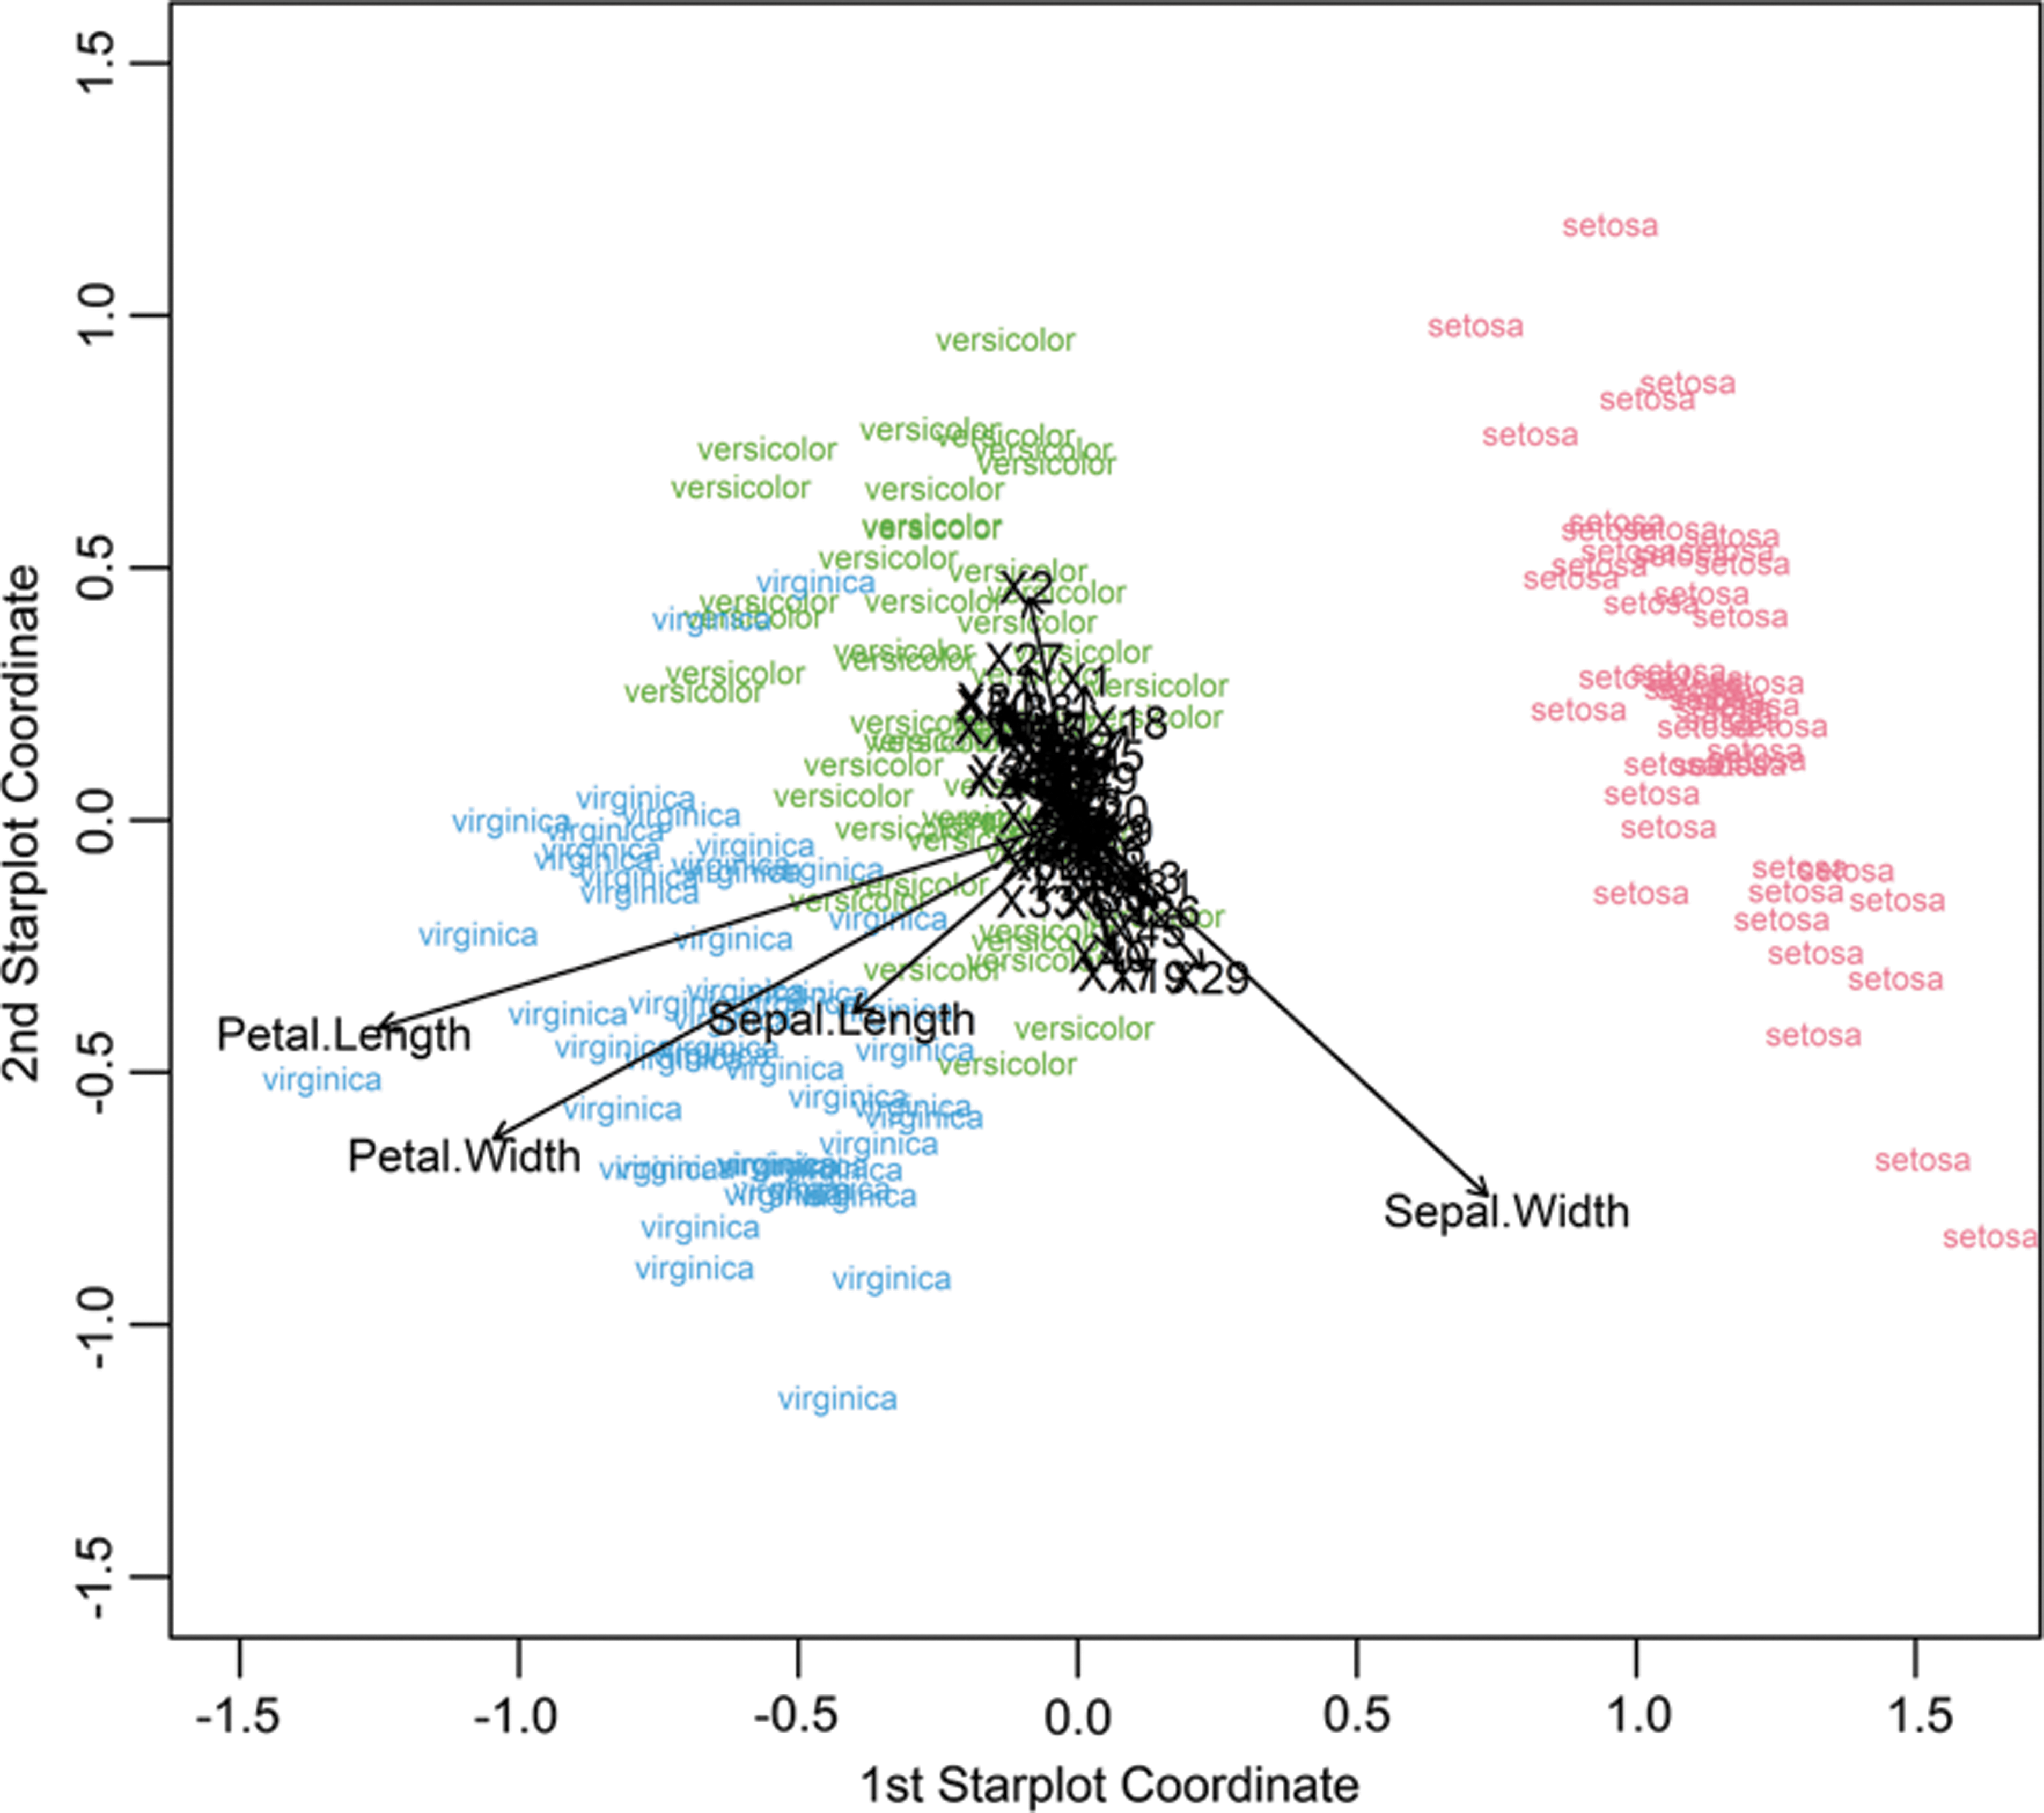
Application of PSS to Fisher's iris phenotype data set. Result shows separation of phenotypes in 2D space. Vectors are the projection coefficients (from
We then applied the PSS method to a simple immunological data set consisting of PBMC phenotyping data (Fig. 2). The complete staining panel used can be found in the Supplementary Data (Supplementary Table S1). To cluster this data set, we first manually gated PBMC CyTOF data on major lineage markers and identified five major clusters: CD4+ T cells (CD14− CD33− CD3+ CD4+ CD8−, Cluster 1), CD8+ T cells (CD14− CD33− CD3+ CD4− CD8+, Cluster 2), B cells (CD14− CD33− CD3− CD19+ CD20+, Cluster 3), NK cells (CD14− CD33− CD3− CD16+ CD56+, Cluster 4), and monocytes (CD14+ CD33+, Cluster 5). The PSS from this data set showed clear separation of the five clusters. Also, we saw that the vectors represented important lineage markers, which were, in fact, the markers used to define cluster identity.
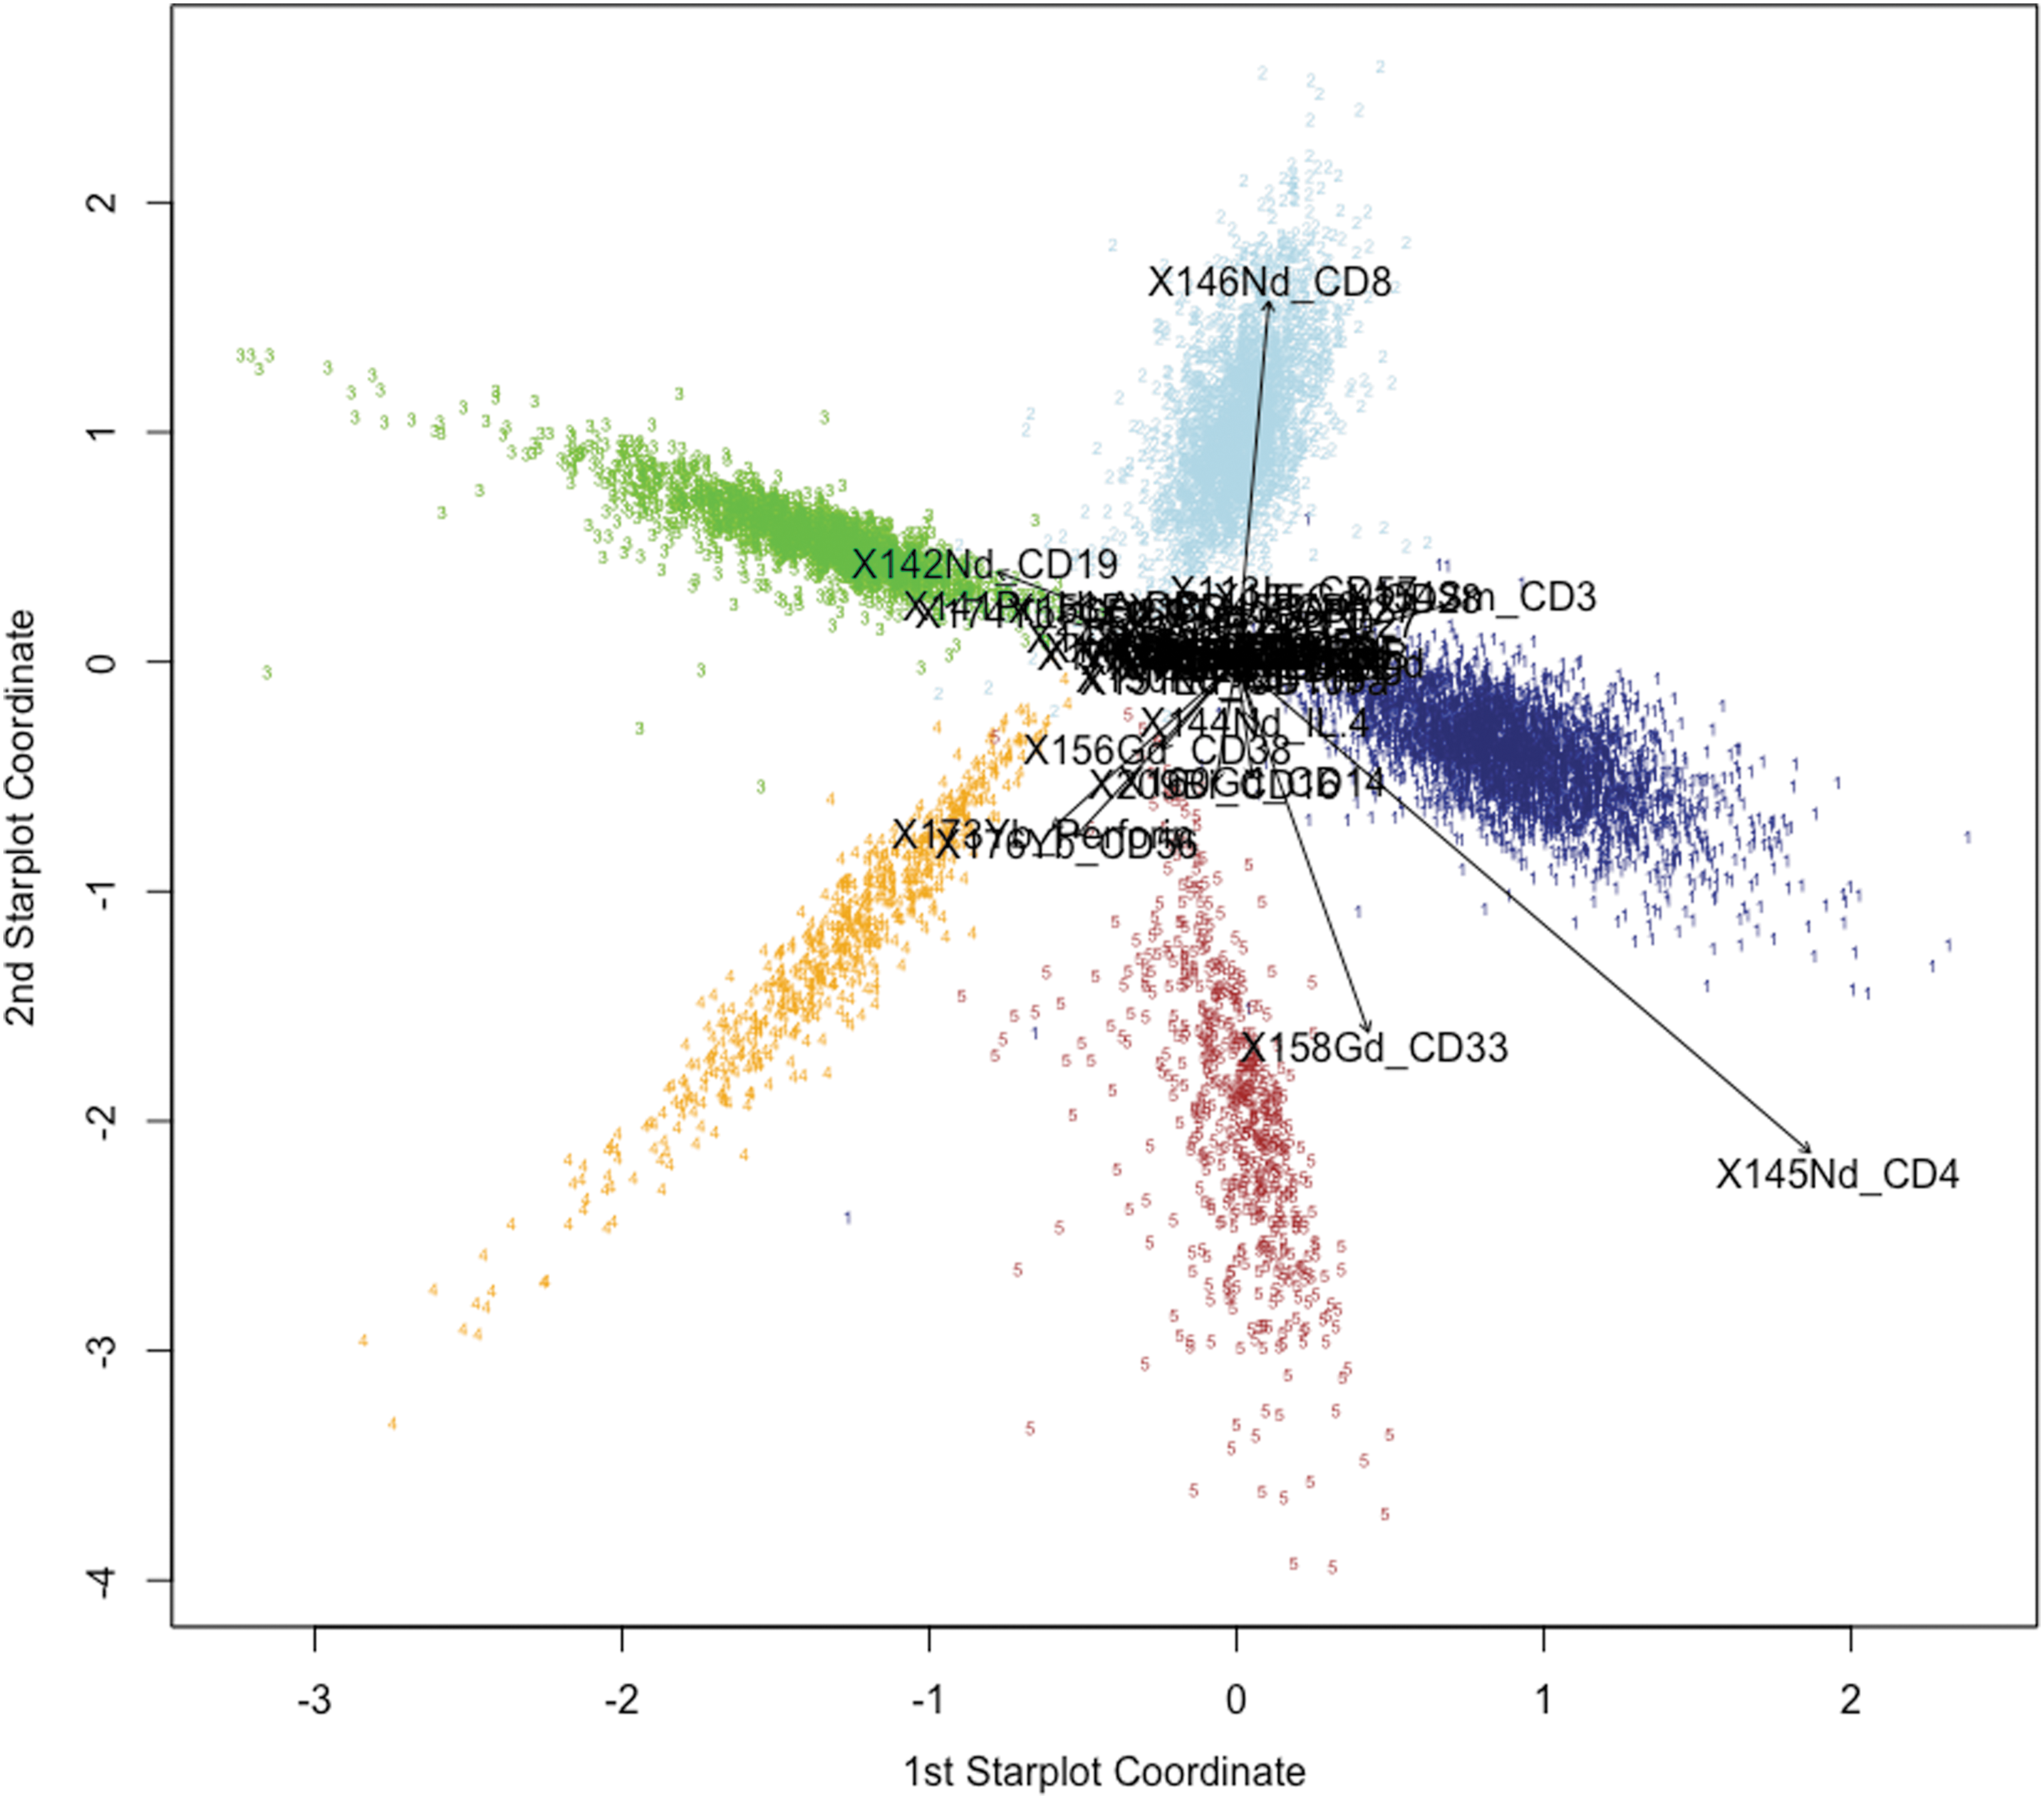
Application of PSS to peripheral blood mononuclear cell (PBMC) phenotyping data set. Using PSS, we visualized a PBMC data set gated on five basic cell lineages. Counterclockwise from right: CD4+ T cells (Cluster 1, navy blue), CD8+ T cells (Cluster 2, blue), B cells (Cluster 3, green), NK cells (Cluster 4, orange), and monocytes (Cluster 5, brown). The indicated vectors clearly show lineage markers such as CD4, CD8, CD3, CD19, CD56, and CD33, which are major drivers of cluster separation. R script for star plot construction from this data set of 8,234 observations, 38 markers, and repeated CV over a grid of 441 combinations of
Finally, we applied PSS to our most challenging immunological data set, consisting of a relatively small number of influenza-specific CD4+ T cells identified by CyTOF, where all cells shared major lineage markers (CD3, CD4, etc.), but with potentially subtle differences in a variety of other markers, some of them dimly expressed. Clustering was performed via ragged pruning of an agglomerative hierarchical clustering, as described in the Materials and Methods section. Of the nine total clusters obtained, three were found to be influenza specific based on a significantly higher abundance under influenza peptide stimulation compared with no stimulation. Figure 3 shows the PSS for these three clusters. From the PSS, it is immediately apparent that MIP1b is the most discriminatory marker, which agrees with its ranking as the most important variable, as quantified by the ratio r of the among-phenotype to within-phenotype variances, in the original 32-dimensional marker space (Table 1). As per the method's design, other variables of high importance values r also have larger coefficient vectors within the star plot (e.g., CD3, CD8, CD69, CD4, CD85j, and CD154). In contrast, tumor necrosis factor (TNF) has the second largest coefficient vector within the star plot and is ranked 10th in importance in separating clusters, indicating that the fused penalty term facilitates but does not strictly enforce importance ordering.
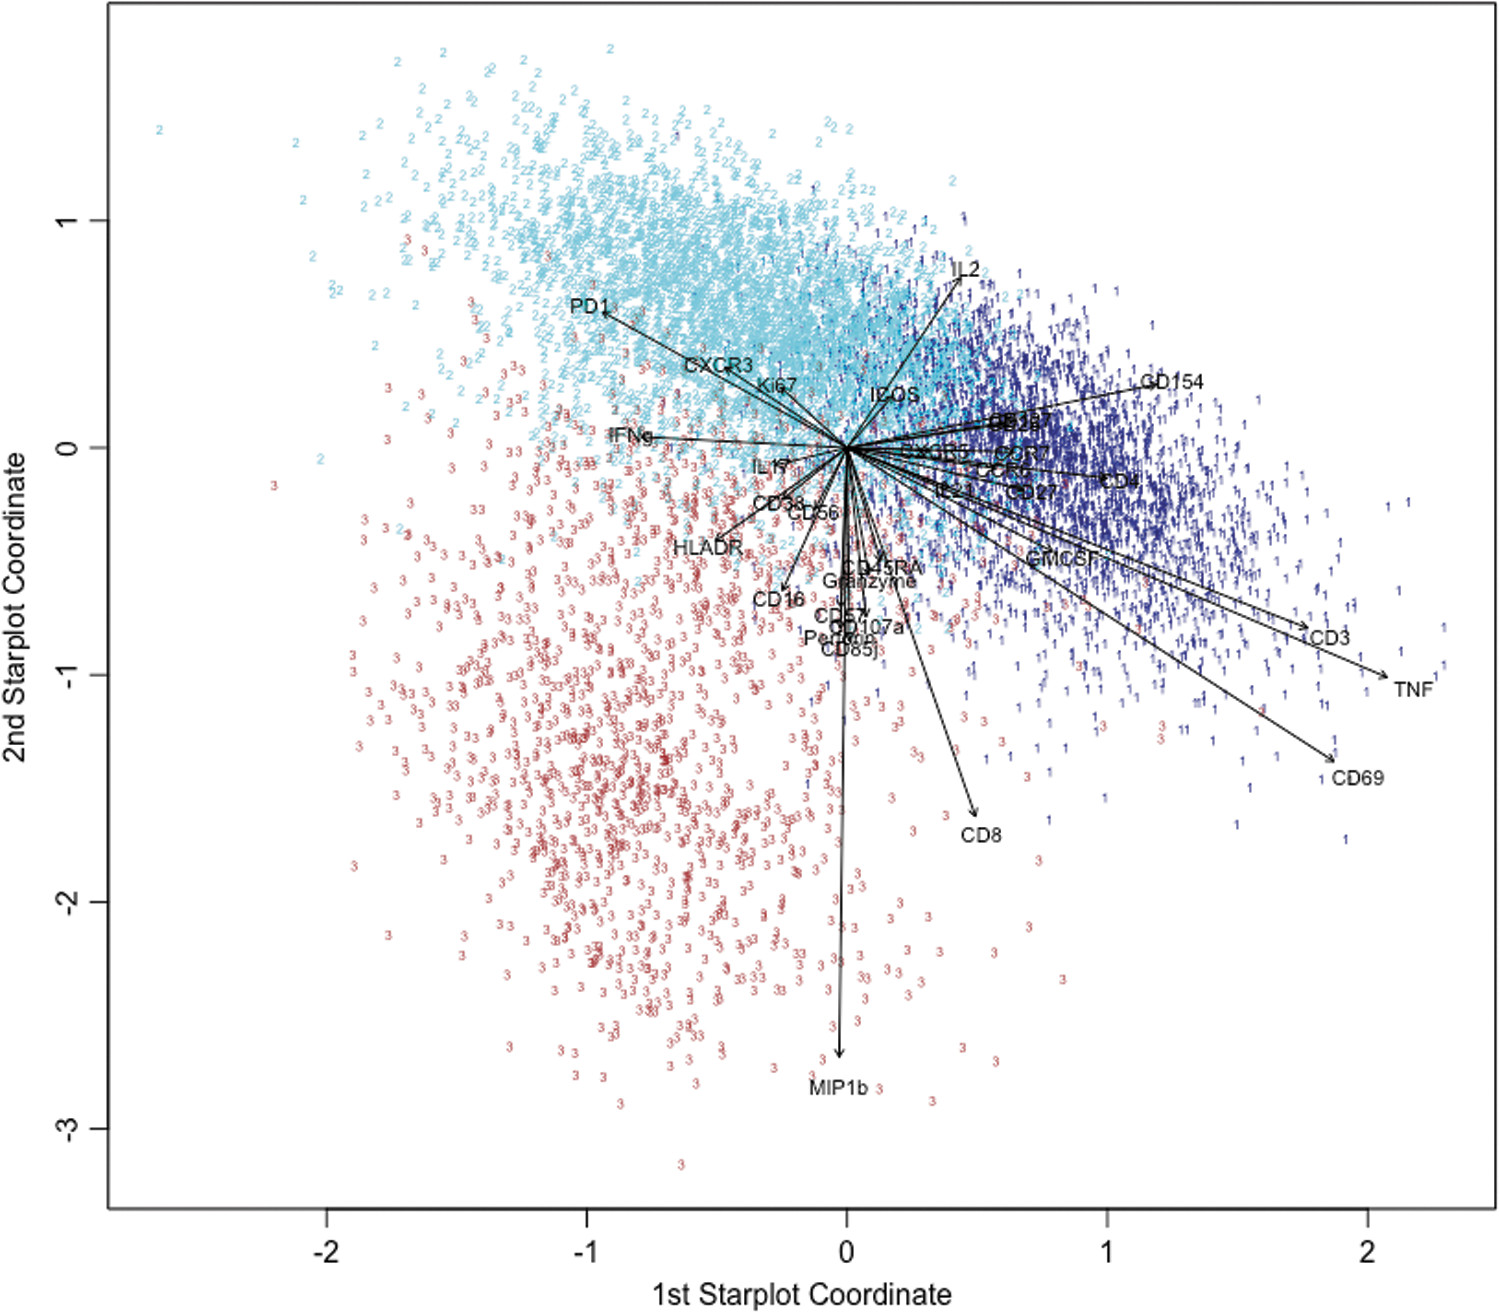
Application of PSS to influenza-specific T cell data set. The original clustering was performed in 32D marker space. The PSS preserves the separation of the three phenotypes in two dimensions (Cluster 1, navy blue; Cluster 2, cyan; Cluster 3, brown). Vectors are the projection coefficients (from
The 32 Markers Used to Identify Phenotypes Among Influenza-Specific CD4+ T Cells
Markers are ordered from highest to lowest importance value r, which is the ratio of the among-phenotype to within-phenotype variances in the original 32-dimensional marker space.
The directions of coefficient vectors are also meaningful. For example, in agreement with observed relative expression levels (Supplementary Table S2), the PSS (Fig. 3) shows that MIP1b is expressed least in cluster 2 and most strongly in cluster 3, CD69 is expressed least in cluster 2 and most strongly in cluster 1, and so on. Using PSS, we were able to visualize a number of key features that define each of the three influenza-specific T cell clusters. These prominent features are discerned by the length and direction of the star plot vectors and are confirmed by the mean expression levels in Supplementary Table S2. Cluster 1 showed some CCR7 expression and low CD45RA, akin to central memory T cells. It also expresses high levels of TNF-α, CD69, CD154, and IL-2. Cluster 2 displayed a more effector memory phenotype as seen by its low level of CCR7 and CD45RA, with high levels of IL-2, CD154, and PD-1. Finally, Cluster 3 had more of a CD4+ TEMRA phenotype (effector memory re-expressing CD45RA) and expressed high MIP1b and CD57, perforin, granzyme B, as well as coexpression of CD8.
Comparison of PSS with PCA, viSNE, Radviz, and DAPC
PCA of Fisher's iris phenotype data set showed that it was less successful at spatially separating phenotypes into compact clusters and distinguishing true phenotypic traits from noise (e.g., vector length for noise variable X21 vs. vector lengths for sepal length and petal width); and PCA appears to have some difficulty with ordering true traits properly given that petal width
We also ran viSNE (3) on the influenza-specific T cell and PMBC phenotyping data sets to compare results with PSS (Supplementary Fig. S3). With viSNE, we saw a clear separation of the five clusters in the PBMC phenotyping data set. In contrast, in the influenza-specific T cells, there was moderate separation with some overlap and fragmentation of phenotypes.
We ran Radviz, which is a tool that places anchor points along a circle (11,12). Using our PBMC phenotyping data set, we found that there was some separation of clusters, but it was difficult to visually determine which parameters are the main drivers of cluster separation (Supplementary Fig. S4A). The influenza-specific T cell data set showed almost no separation of clusters (Supplementary Fig. S4B).
Finally, we also ran DAPC (14), a popular supervised (discriminant function) method, currently being cited by more than 1,200 documents on Scopus. Despite being supervised, DAPC produced poor visual separation of clusters in the PBMC phenotyping as well as influenza-specific T cell data sets (Supplementary Fig. S5).
Overall, our comparative analyses showed that in these cluster data sets, PSS provides a more clear and intuitive visualization, even when the differences between clusters are subtle.
Discussion
Subpopulations of immune cells within a given lineage, such as CD4+ T cells, may express many combinations of markers, which are now readily tracked with high-dimensional flow or mass cytometry. Automated clustering algorithms can define the major subpopulations within these lineages, but visualizing the strength of that high-dimensional clustering solution and the major markers responsible for differentiating the clusters is still challenging. An example where this is relevant is CD4+ T cells responding to viral antigens, such as influenza, as shown in this study.
Interestingly, in the influenza-specific T cell data, we found that markers such as CD3 and CD4 were important in separating the three clusters. The cells used in this experiment were stimulated with influenza peptides to identify virus-specific clusters. Markers such as CD3 and CD4 are known to be downmodulated on activation, which is most likely why their expression levels vary among clusters. Furthermore, low levels of CD8 are known to be expressed on some subsets of CD4+ T cells responsive to viruses (31). This indicates a high degree of complexity in flu-responsive clusters, and PSS was able to visually highlight subtle differences in markers such as CD3, CD4, and CD8.
We also compared PSS to other conventional visualization methods (PCA, viSNE, Radviz, and DAPC). While viSNE was adequate at separating clusters for the simpler immunological data set (PBMC phenotyping), it was less effective than PSS on the more complex influenza-specific T cell data set. Furthermore, it did not provide clear identification of prominent separating features, whereas the vectors in PSS more accurately represented prominent separating features. PCA, a linear dimensionality reduction method, performed most poorly on all three data sets tested. Similarly, Radviz and DAPC also exhibited very limited utility in visualizing this form of cluster data (Supplementary Figs. S4 and S5), especially Radviz. Radviz can be extended to be supervised (29), which could improve separation of clusters; but we did not examine this extension because we did not find this option in R package Radviz (2). In the two sample data sets tested, we found that cluster separation was poor. Furthermore, the radial marker axes failed to provide useful insight into cluster differences. DAPC also did not clearly separate clusters in both data sets (Supplementary Fig. S5). DAPC is a more general classification tool and not purely for 2D visualization, which may partly explain its limited visualization performance even in well-separated clusters (e.g., PBMC phenotyping data set, Supplementary Fig. S5A). Taken together, these findings highlight the need for a new supervised method such as PSS.
The strong performance of PSSs across contrasting data sets suggests that they may have wide utility for visualization of high-dimensional cell phenotyping data, especially mass cytometry data. For influenza-specific T cells, this could aid in understanding the basis of vaccine-induced protection (or lack thereof), as well as understanding T cell differentiation in response to different viral antigens.
PSSs are designed to be information-preserving. Specifically, the purpose of PSSs is to preserve with integrity as much information as possible in the projection from p-dimensional to 2D space. The two squared loss (L 2) penalty terms of our objective function E1 are attractive for this purpose because, unlike L 1 penalties, they shrink but do not completely remove (shrink exactly to zero) any of the coefficient vectors. This may be especially important given some recent concerns raised about L 1 penalties (8).
The PSS algorithm does entail a grid search over possible combinations of
PSSs are straightforward to apply. After proper row construction of supervisor
Footnotes
Acknowledgments
This work was funded by NIH/NIAID grant 5U19AI057229 to Dr. Mark Davis, Director of the Institute of Immunity, Transplantation and Infection, Stanford University School of Medicine. We are grateful to Dr. Davis for his encouragement and general support. We also thank Dr. Dongxia Lin for CyTOF analysis, and Dr. Cornelia Dekker, Rohit Gupta, and Janine Sung for sample collection, processing, and banking. We also thank the three anonymous reviewers, whose considered and constructive comments greatly improved the method and article.
Authors' Contributions
T.H.H. and H.T.M. conceived the study. T.H.H. designed the method, wrote R code, conducted analyses, and wrote the article. H.T.M. critically reviewed the article. P.B.S. processed samples, generated CyTOF data, gated, and analyzed them, performed viSNE analysis, and helped write the article. W.W. performed PSS, PCA, RadViz, and DAPC analyses. W.W. also contributed extensions to the original R script for PSS. All authors have read and approved the final version of the article.
Ethical Approval
Samples were collected from human participants under informed consent, through the Institutional Review Board (IRB)-approved protocol at Stanford University (IRB-16390).
Author Disclosure Statement
No competing financial interests exist.
Supplementary Material
Supplementary Figure S1
Supplementary Figure S2
Supplementary Figure S3
Supplementary Figure S4
Supplementary Figure S5
Supplementary Table S1
Supplementary Table S2
References
Supplementary Material
Please find the following supplemental material available below.
For Open Access articles published under a Creative Commons License, all supplemental material carries the same license as the article it is associated with.
For non-Open Access articles published, all supplemental material carries a non-exclusive license, and permission requests for re-use of supplemental material or any part of supplemental material shall be sent directly to the copyright owner as specified in the copyright notice associated with the article.