
Abstract
Some patients with chronic hepatitis C also demonstrate liver steatosis, but the mechanism remains elusive. To analyze the hepatic expression of phosphorylated kinase Akt at Thr 308 and phosphorylated GSK-3 (Glycogen synthase kinase-3) isoforms, GSK3α at Ser 21 and GSK3β at Ser 9, in chronic hepatitis C patients with normal body weight, glucose, and lipid profiles depending on homeostasis model assessment of insulin resistance (HOMA-IR) levels and histological parameters. The study group consisted of 31 patients with chronic hepatitis C. The hepatic expression of kinase Akt (Thr308), GSK3β (Ser9), and GSK3α (Ser21) was measured using Western blot assay. Liver steatosis was observed in 41.93% of patients with HCV infection, in those with increased HOMA-IR index (p = 0.02). However, the hepatic expression of Akt (Thr308), GSK3β (Ser9), and GSK3α (Ser21) was not related to progression of liver steatosis, inflammation, and fibrosis. There was no significant difference in the hepatic expression of kinase Akt (Thr308), GSK3β (Ser9), and GSK3α (Ser21) in relation to HOMA-IR. Liver steatosis was found to be positively associated with HOMA-IR levels in patients with chronic hepatitis C without metabolic disorders. However, the hepatic expression of Akt (Thr308), GSK3β (Ser9), and GSK3α (Ser21) did not correspond to progression of liver disease.
Introduction
Despite the availability of therapy based on direct-acting antiviral agents that are effective in 90% to 95% of patients, HCV infection remains a worldwide health problem, with an estimated 1.75 million new cases reported in 2015 (29). Approximately 75–85% of hepatitis C virus (HCV)-infected patients develop a chronic infection, 20% of whom progress to cirrhosis (15,21,27). Studies have found that 40% to 86% of patients with chronic hepatitis C also demonstrate liver steatosis and its frequency varies with the genotype (3,6). Steatosis is more common in genotype 3 infection, where the prevalence of hepatic steatosis is 73% of patients. In comparison, it occurs in about 50% of patients infected with other genotypes (5).
The pathogenesis of liver steatosis in HCV infection is complex. Both viral- and host-mediated factors (or a combination of these factors) likely contribute to development of hepatic steatosis. Liver steatosis is commonly associated with obesity, diabetes, and dyslipidemia (4,24). However, HCV interferes with the host lipid metabolism, resulting in enhanced lipogenesis and impaired mitochondrial beta-oxidation (2,14,18,22).
HCV infection may also lead to insulin resistance. The prevalence of insulin resistance in chronic HCV infection depends on the HCV genotype and is estimated to affect between 61% and 84% of patients (23).
The main function of insulin is regulation of glucose transport into insulin-sensitive cells through glucose transport proteins (GLUT-4). It is well established that binding of insulin to IRS-1 (insulin receptor substrate-1) leads to tyrosine phosphorylation of IRS-1 and consequent stimulation of kinase PI3-K (phosphoinositide-3-kinase) and the kinase Akt. Activation of Akt stimulates glucose uptake by GLUT-4 and contributes to phosphorylation of serine 21 in isoform GSK-3α and serine 9 in isoform GSK-3β, resulting in inhibition of GSK-3 kinase activity (25).
Inhibition of GSK-3 leads to proteasomal degradation of the sterol regulatory element-binding protein (SREBP), which increases hepatic de novo lipogenesis by insulin (11).
Some animal studies have demonstrated that HCV can itself induce insulin resistance by impairing insulin-induced IRS-1, PI3K, and Akt phosphorylation. However, other studies present a fat-independent mechanism of insulin resistance in HCV-infected patients (12,20).
Aim
The aim of the present study is to determine the hepatic expression of Akt phosphorylated at Thr 308 (Akt Thr308) and two phosphorylated GSK-3 (glycogen synthase kinase-3) isoforms, GSK3α at Ser 21 (GSK3α Ser21) and GSK3β at Ser 9 (GSK3β Ser9), in chronic hepatitis C patients with normal body weight, glucose, and lipid profiles with regard to the homeostasis model assessment of insulin resistance (HOMA-IR) level and histological parameters.
Patients and Methods
Participation in this study was proposed to all patients with chronic hepatitis C who met the inclusion criteria attending a Clinic of Infectious Diseases and Hepatology, Lodz, Poland, between 2013 and 2014.
Inclusion criteria were as follows: Detectable HCV viremia Viral genotype 1
Exclusion criteria were as follows: Diagnosis of other chronic diseases such as diabetes mellitus and glucose intolerance, metabolic syndrome, overweight (BMI >25 kg/m2), or lipid disorders Diagnosis of other causes of liver disease Consumption of more than 20 g of alcohol per day Prior treatment with antiviral therapy Treatment with other medications, including lipid-lowering drugs Pregnancy
Consecutive patients who had provided written informed consent and who met inclusion criteria and none of the exclusion criteria were included in the study.
This study was approved by the ethics committee of the Faculty of Medicine, Medical University of Lodz, Poland. The procedures followed were in accordance with the Helsinki Declaration of 1975.
Liver histology
The grade of inflammation and necrotic changes, as well as stage of fibrosis, were assessed according to the 1995 Batts and Ludwig scale. Steatosis was determined by Brunt and Kleiner histological scoring.
Western blot analyses
The liver biopsy specimens ware stored at −80°C. Total homogenates of biopsy samples were resolved on sodium dodecyl sulfate (SDS) electrophoresis gels by standard procedures. Protein samples were homogenized on ice in the M-PER™ mammalian protein extraction reagent and Health™ protease and phosphatase inhibitor cocktail (Thermo Scientific™). Lysates were fractionated by centrifugation for 5 min at 5,000g and then again for 15 min at 14,000g. The obtained supernatants were used for Western blotting experiments. The protein content of lysates was determined by the bicinchoninic acid method. Cell lysate aliquots containing appropriate amounts of total protein were boiled with 5 × concentrated sample buffer with phosphatase inhibitor cocktail, separated by SDS-polyacrylamide gel electrophoresis, and then electrophoretically transferred to polyvinylidene difluoride membranes (BioRad). The membranes were blocked in 5% nonfat milk (BioRad) for 2 h at RT, washed with Tris-buffered saline/0.1% Tween 20, and incubated overnight at 4°C with the following primary antibodies: antiphospho-Akt (Thr 308), antiactin (Santa Cruz Biotechnology), or antiphospho-GSK-3α/β (Ser21/9) (Cell Signaling Technology). After washing and incubation with the appropriate horseradish peroxidase secondary antibody (Santa Cruz Biotechnology), immunodetection was performed using an enhanced chemiluminescence kit (BioRad). Membranes were scanned on a Chemidoc (BioRad) imaging and gel documentation system. An antiactin mouse monoclonal antibody was used as the loading control for total lysates. Image Lab, version 4.0 (BioRad), was used to measure the level of phosphorylated kinase Akt and glycogen synthase kinase-3 isoforms. To normalize target protein expression, the band intensity of each sample was determined by densitometry. Next, the intensity of the target protein was divided by the intensity of the loading control protein.
Virology assays
Plasma HCV viremia was measured at the moment of liver biopsy by reverse transcription–polymerase chain reaction (Cobas AmpliPrep/Cobas TaqMan/HCV Test, Roche Diagnostic). The HCV genotype was assessed by a second-generation test (VERSANT HCV Genotype 2.0 Assay (LiPA)).
Routine laboratory investigations
Insulin resistance was estimated using the HOMA-IR index, which was calculated according to the following formula: (fasting insulinemia [μU/mL] × fasting glucose [mmol/L])/22.5. HOMA-IR values higher than 2.5 were considered significant for insulin resistance. Serum glucose concentrations were estimated by glucose hexokinase enzymatic assay (Olympus Beckman Coulter, Switzerland). Insulin was measured using an ELISA kit (Bio Vendor, NC) in venous blood samples collected after fasting. Alanine aminotransferase activity was measured enzymatically one to three days before liver biopsy without addition of pyridoxal-5'-phosphate; the reference ranges were 0–41 U/L and 0–31 U/L for men and women, respectively.
The method for determining gamma-glutamyl transferase (GGT) was based on the use of glutamyl derivatives of aromatic amines as substrate material; the reference range for GGT was 38–61 U/L.
Statistical analysis
Quantitative variables between different groups were compared using the Mann–Whitney test. Correlations between hepatic expression of Akt (Thr308), GSK3β (Ser9), and GSK3α (Ser21) and HOMA-IR and HCV viral load were measured with the Spearman rank correlation coefficient. Values of p < 0.05 were considered to be statistically significant.
Results
Characteristics of study group
Thirty-one patients diagnosed with chronic hepatitis C (14 men and 17 women) with a median age of 38 (LQ 27.5-UQ 54.4) and a median BMI of 23.64 kg/m2 (LQ 24.53-UQ 24.64) were included in the study. The median plasma HCV viremia was 526 000 IU/mL (LQ 238 000–UQ 1 280 000).
The median HOMA-IR was 2.09 (LQ 1.25- UQ
Characteristics of the Study Group
Akt Thr308—Akt phosphorylated at Thr 308. GSK3α Ser21—isoform GSK-3α (glycogen synthase kinase-3) phosphorylated at Ser 21. GSK3β Ser9—isoform GSK-3β (glycogen synthase kinase-3) phosphorylated at Ser 9.
ALT, alanine aminotransferase; GGT, gamma-glutamyl transferase; HOMA-IR, homeostasis model assessment of insulin resistance; BMI, body mass index; HCV, hepatitis C virus.
Association of hepatic expression of Akt (Thr308), GSK3β (Ser9), and GSK3α (Ser21) and HCV viremia
The study group was dived into two subgroups: one group with HCV-RNA >600,000 IU/mL and the other one with HCV-RNA <600,000 IU/mL. There was no significant difference in hepatic expression of Akt (Thr308), GSK3β (Ser9), and GSK3α (Ser21) between patients with HCV-RNA >600,000 IU/mL and subjects with HCV-RNA <600,000 IU/mL (Table 2). Hepatic expression of Akt (Thr308), GSK3β (Ser9), and GSK3α (Ser21) was not found to correlate with HCV viral load (Table 3).
Hepatic Expression of Akt (Thr308), GSK3β (Ser9), and GSK3α (Ser21) According to HCV Viral Load
Akt Thr308—Akt phosphorylated at Thr 308. GSK3α Ser21—isoform GSK-3α (glycogen synthase kinase-3) phosphorylated at Ser 21. GSK3β Ser9—isoform GSK-3β (glycogen synthase kinase-3) phosphorylated at Ser 9.
NS, not significant.
Correlations Between the Hepatic Expression of Akt (Thr308), GSK3β (Ser9), and GSK3α (Ser21) and HCV Viral Load
Akt Thr308—Akt phosphorylated at Thr 308. GSK3α Ser21—isoform GSK-3α (glycogen synthase kinase-3) phosphorylated at Ser 21. GSK3β Ser9—isoform GSK-3β (glycogen synthase kinase-3) phosphorylated at Ser 9.
Association of hepatic expression of Akt (Thr308), GSK3β (Ser9), and GSK3α (Ser21) and HOMA-IR
HOMA-IR >2.5 was reported in 14 patients (45.16% of patients).We found no statistically significant difference in hepatic expression of Akt (Thr308), GSK3β (Ser9), and GSK3α (Ser21) between patients with HOMA-IR >2.5 and HOMA-IR <2.5 (Table 4). The hepatic expression of Akt (Thr308), GSK3β (Ser9), and GSK3α (Ser21) was not correlated with HOMA-IR (Table 5).
Hepatic Expression of Akt (Thr308), GSK3β (Ser9), and GSK3α (Ser21) Depending on HOMA-IR
Akt Thr308—Akt phosphorylated at Thr 308. GSK3α Ser21—isoform GSK-3α (glycogen synthase kinase-3) phosphorylated at Ser 21. GSK3β Ser9—isoform GSK-3β (glycogen synthase kinase-3) phosphorylated at Ser 9.
Correlations Between the Hepatic Expression of Akt (Thr308), GSK3β (Ser9), and GSK3α (Ser21) and HOMA-IR
Akt Thr308—Akt phosphorylated at Thr 308. GSK3α Ser21—isoform GSK-3α (glycogen synthase kinase-3) phosphorylated at Ser 21. GSK3β Ser9—isoform GSK-3β (glycogen synthase kinase-3) phosphorylated at Ser 9.
Association of hepatic expression of Akt (Thr308), GSK3β (Ser9), and GSK3α (Ser21) and HOMA-IR with liver steatosis
Liver steatosis was reported in 13 patients (41.93%) with chronic hepatitis C. Fatty changes included microvesicular steatosis of 5–70% liver cells. HOMA-IR was associated with liver steatosis (p = 0.02). There was no significant difference in the hepatic expression of Akt (Thr308), GSK3α (Ser21), and GSK3β (Ser9) in patients with chronic hepatitis C in relation to the presence of liver steatosis (Table 6). Results of the Western blot are also presented in Figure 1.
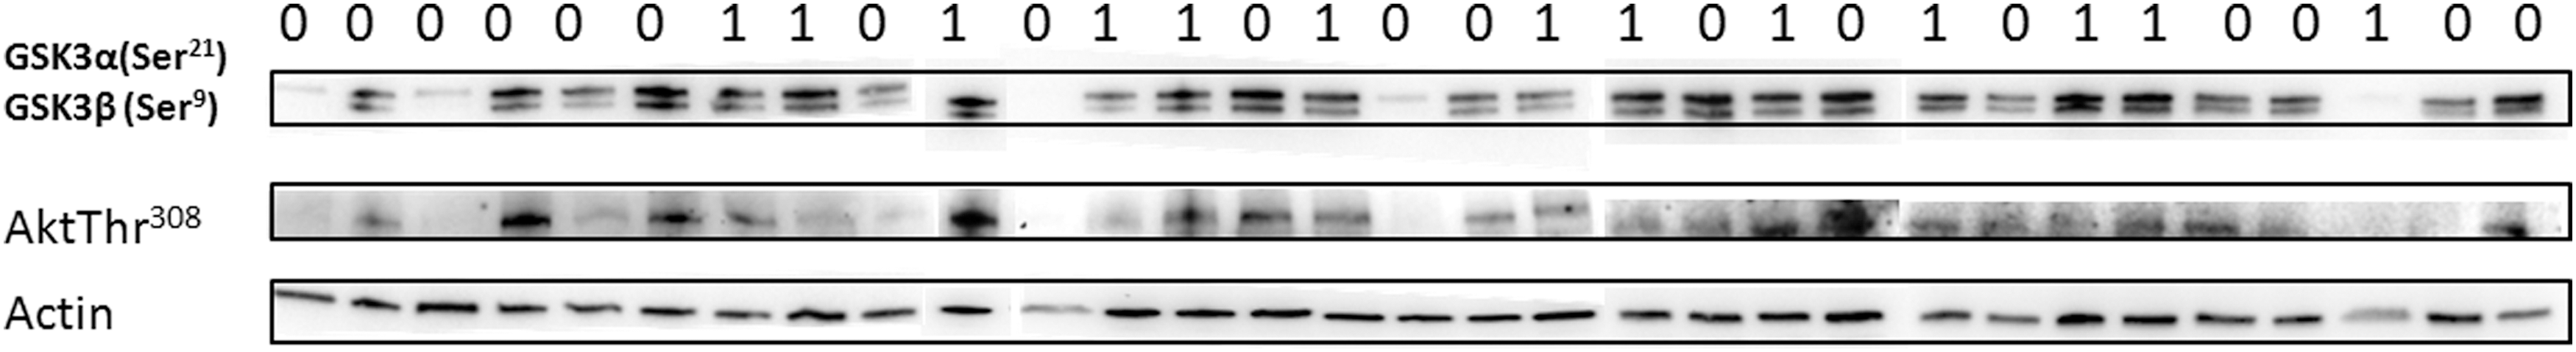
Hepatic expression of Akt (Thr308), GSK3β (Ser9), and GSK3α (Ser21) in chronic hepatitis C with liver steatosis (1) or without liver steatosis (0). There was no significant difference in the hepatic expression of Akt (Thr308), GSK3α (Ser21), and GSK3β (Ser9) in patients with chronic hepatitis C in relation to the presence of liver steatosis.
Hepatic Expression of Akt (Thr308), GSK3β (Ser9), and GSK3α (Ser21) Depending on the Presence of Liver Steatosis
Akt Thr308—Akt phosphorylated at Thr 308. GSK3α Ser21—isoform GSK-3α (glycogen synthase kinase-3) phosphorylated at Ser 21. GSK3β Ser9—isoform GSK-3β (glycogen synthase kinase-3) phosphorylated at Ser 9.
Association of hepatic expression of Akt (Thr308), GSK3β (Ser9), and GSK3α (Ser21) with hepatic inflammation
All patients received an assessment of liver inflammation and fibrosis based on liver biopsy. Subjects were divided into two subgroups for the sake of statistical analysis: one group of 17 patients in whom necroinflammatory activity (grade ≥1) was reported in liver biopsy specimens and another group of 14 patients with no such inflammation (grade 0). No relationships were found between hepatic concentrations of Akt (Thr308), GSK3β (Ser9), and GSK3α (Ser21) and inflammatory activity (Table 7).
Hepatic Expression of Akt (Thr308), GSK3β (Ser9), and GSK3α (Ser21) According to the Grade of Inflammatory Activity
Akt Thr308—Akt phosphorylated at Thr 308. GSK3α Ser21—isoform GSK-3α (glycogen synthase kinase-3) phosphorylated at Ser 21. GSK3β Ser9—isoform GSK-3β (glycogen synthase kinase-3) phosphorylated at Ser 9.
Association of hepatic expression of Akt (Thr308), GSK3β (Ser9), and GSK3α (Ser21) with hepatic fibrosis
Advanced fibrosis (S ≥ 2) was detected in 17 patients. Again, the hepatic expression of Akt (Thr308), GSK3β (Ser9), and GSK3α (Ser21) was not related to progression of liver fibrosis (Table 8).
Hepatic Expression of Akt (Thr308), GSK3β (Ser9), and GSK3α (Ser21) According to the Grade of Liver Fibrosis
Akt Thr308—Akt phosphorylated at Thr 308. GSK3α Ser21—isoform GSK-3α (glycogen synthase kinase-3) phosphorylated at Ser 21. GSK3β Ser9—isoform GSK-3β (glycogen synthase kinase-3) phosphorylated at Ser 9.
Discussion
Steatosis in chronic hepatitis C is the consequence of viral infection and metabolic factors depending on the host, such as obesity, hyperlipidemia, insulin resistance, diabetes type 2, and alcohol consumption.
Interestingly, HCV alters both lipid and glucose metabolism leading to hepatic steatosis and insulin resistance; however, the molecular mechanisms are not completely understood.
In our study, insulin resistance was found in 45.16% of our patients with chronic hepatitis C with normal body weight, glucose, and lipid profiles. This observation supports the hypothesis that not only metabolic factors but also viral factors lead to development of insulin resistance. Moreover, HOMA-IR was not associated with the hepatic expression of kinase Akt (Thr308), GSK3β (Ser9), and GSK3α (Ser21). It is well established that HCV directly affects insulin signaling pathways, promoting insulin resistance at a cellular level. HCV core protein could cause IRS-1 and IRS-2 degradation through proteasome ubiquitination by inducing SOCS 3 expression (11,13). HCV E2 protein is known to impair Ser9 phosphorylation of GSK3β in Huh7 cells (10). On the other hand, HCV core protein directly activates SREBP-1c in transgenic mice, resulting in increased hepatic fat accumulation (19).
Insulin resistance is often accompanied by increased hepatic steatosis (9,27). The results of the present study confirm that hepatic steatosis was positively related to the presence of HOMA-IR. Similarly, other authors have reported a significant relationship between the presence of HOMA-IR and liver steatosis and fibrosis (7,8,24). Mouse models of NAFLD show the significance of an impairment of PI3K/AKT signaling in the development of liver steatosis (16,22,28). However, our findings do not confirm the influence of the hepatic expression of kinase Akt (Thr308), GSK3β (Ser9), and GSK3α (Ser21) on the presence of liver steatosis in HCV infection in vivo. The pathogenesis of liver steatosis in HCV infection is complex. Not only host but also viral mechanisms likely contribute to development of hepatic steatosis in HCV infection (18,23,28). In our study, the lack of a relationship between the insulin signaling pathway and development of liver steatosis in HCV infection in vivo may indicate that there is no role for PI3K/AKT/GSK3 signaling as a potentially therapeutic option in liver steatosis in HCV infection.
In the present study, we do not show any association between the hepatic expression of insulin signaling proteins and liver inflammation and fibrosis. However, the literature presents several contradicting opinions on the role of the insulin signaling pathway in liver fibrosis. Zhuang et al. observed that decreased GSK3β expression corresponds to progression of cholestatic fibrosis in patients with cholestatic liver disease and in a bile duct ligation mouse model (30). Contradictory results were obtained by Liu et al. who reported that activation of GSK3β promotes liver fibrosis in a liver fibrosis mouse model (17).
In the present study, neither the HOMA-IR index nor hepatic expression of Akt (Thr308), GSK3β (Ser9), and GSK3α (Ser21) was found to be related to HCV viremia. It is well known that hyperinsulinemia stimulates viral replication in vitro, but it is still not clear whether insulin resistance directly affects HCV replication in vivo (1). The role of glycogen synthase kinase-3 in HCV replication remains unknown. It has been reported that GSK3β has no effect on HCV replication in Huh7.5 cells infected with a JFH-1 clone of HCV, but it is a key molecule in HCV virion maturation (26).
The limitation of this study is the lack of comparison with patients with simple hepatic steatosis. However, results obtained from this analysis do not indicate the role of hepatic insulin signaling proteins in the pathogenesis of steatosis in patients with chronic hepatitis C.
Conclusions
Liver steatosis was found to be positively associated with HOMA-IR levels in patients with chronic hepatitis C without metabolic disorders. However, the hepatic expression of Akt (Thr308), GSK3β (Ser9), and GSK3α (Ser21) did not correspond to progression of liver disease.
Footnotes
Author Disclosure Statement
No competing financial interests exist.