
Abstract
Antibody induction test (AIT) is a promising candidate as a refinement of the troublesome National institutes of Health (NIH) test in the sense of animal welfare 3R approach for determination of potency of inactivated rabies vaccines for veterinary and human use. In this study, we initially try to develop AIT as a suitable alternative to NIH test, to achieve a reduction of test duration and diminish animal suffering by omitting intracerebral CVS infection and measuring humoral immunity upon vaccination. Designs of both multi-dose and single-dose AIT were examined. Biological reference preparation, batch 5 with assigned titer of 10 IU/vial, was taken as both standard and test vaccine. Six consecutive AITs were performed and eight pools of sera in each AIT were tested in triplicate by rapid fluorescent focus inhibition test. We estimated the upper detection limit and calculated test variability for individual dilutions. For multi-dose AIT, we estimated the dose–response function and performed calculations of final test results and statistical validity parameters for both linear and sigmoidal model using CombiStats program. Sigmoidal 4-parameter dose–response model was found optimal. Presented design of multi-dose AIT showed a satisfactory detection limit for testing of inactivated rabies vaccines for both veterinary and human use. However, due to nonconformity of obtained results with statistical validity criteria, we concluded that the presented model of multi-dose AIT was unsuitable for introduction in routine practice. However, we concluded that there was a realistic option for introduction of two versions of single-dose AIT. The first version would be with two standard vaccine controls and could be introduced immediately, while the second version would include testing of the sample only and rely on comparison of the induced rabies antibody level with absolute cut-off limits set in advance.
Introduction
Reference tests used for potency testing of inactivated rabies vaccines are established on principles and technology from the middle of the past century and heavily rely on animal models. Today, in the ethical, economic, and scientific perspectives, many disadvantages are observed, referring in the first place to the NIH test that is crucial for vaccine regulatory testing.
Potency testing of inactivated rabies vaccines for veterinary and human use that are prepared from cell culture has been of great concern to the WHO and national control laboratories in countries that produce or use these vaccines. In 1966, Habel put forward four requirements for an ideal potency test as follows: (a) the ability to measure vaccine efficacy in postexposure rabies prophylaxis, (b) discrimination between vaccines of low and high potency, (c) being practical and economically feasible, and (d) possibility of standardization within and between laboratories using a reference vaccine (15). None of the tests used so far has satisfied all of these criteria.
Since 1970s, NIH test (27) has been used as the reference quantitative potency test. However, its multiple disadvantages were soon recognized and the researchers were forced to look for alternative solutions (4,5,31). Along with the encouragement of the 3Rs concept implementation (Replacement, Reduction, and Refinement), propositions regarding replacement of in vivo potency testing of inactivated rabies vaccine are emerging (1,6,9,14,26). Also, addressing the increasing problem of animal suffering throughout NIH test, Cussler et al. suggested introduction of humane endpoints (8).
Efforts obtained to improve rabies vaccine immunogenicity testing led to the development of potential alternatives to NIH test in the form of in vitro potency tests, such as antibody-binding test (1,2), single radial immunodiffusion technique (9) or enzyme immunoassay (6,14,22,32).
Fitzgerald et al. developed the first rabies vaccine potency test (11,12) that used either mouse neutralization test (3) or rapid fluorescent focus inhibition test (RFFIT) (28) for quantification of rabies antibodies produced in immunized mice. For potency evaluation, mice were immunized with equal dilutions of test and reference rabies vaccine. Subsequently, mouse rabies-virus neutralizing antibodies were compared for rough assessment of vaccine potency.
Approximately 1 year later, Rosanoff repeated such a test with different vaccine samples, giving the name “antibody induction” for the test and using the ratio of the overall geometric means of international units per milliliter for rabies antibody across all dilutions of the test and reference vaccine as the final result for potency of the test vaccine (25). Later, several authors named this test “serological potency test” or “serological potency assay.” However, a “serological test” is usually a name for an in vitro assay, and in this case, it is just a final analytical component of an in vivo test. Therefore, the name antibody induction test (AIT) more appropriately reflects its essence.
No attempts were made for replacement of the troublesome NIH test with AIT for a long time before a team from the Paul Ehrlich Institute further modified the test design, so that a single-dose AIT was introduced for the first time and represented a huge step forward in realization of 3R principles. This time, it was done for the specific purpose of batch release of inactivated rabies vaccines for veterinary use (7,20). The serological test used in their study was a “modified RFFIT,” and the test appeared suitable for its purpose and was recommended as a standard test. However, since this AIT was only a semiquantitative test, it could not generally replace NIH test for exact determination of vaccine potency.
Further effort for the development of a standardized quantitative mouse serological assay for vaccine potency yielded encouraging results, but the design was still rather complicated and prone to occasional invalidation of results, assessed by complex statistical criteria (19). Recently, Moreira et al. (21) published a novel design of AIT with reduced number of mice required, but with greater variability of results in relationship to NIH test.
In this study, we chose to combine the original serological testing concept of mouse sera pools that represent different vaccine dilutions (12,13,25), which was recently proposed by a WHO working group (35), with test scheme used by Krämer et al. (19) regarding mouse group size, dilutions number, vaccine dilutions preparation, inoculation route, dose, and immunization. In the next step, we first calculated intra-assay and inter-assay variability, as well as the detection limit of AIT. Then we evaluated models of the dose–response function and finally evaluated different calculation methods of results, considering statistical validation criteria for regression, parallelism, and linearity. In addition, we performed necessary calculations for a novel design of a possible single-dose AIT, trying to overcome potentially high false negative result incidence of current batch potency test that requires the test vaccine to show significantly higher antibody response than the standard vaccine set at the cut-off potency level (17,36).
The aim of this study was to initially develop AIT as a possible refinement of the NIH test to achieve reduction of test duration and diminish animal suffering by omitting intracerebral Challenge Virus Standard (CVS) infection and measuring humoral immunity upon immunization. Also, AIT would enable considerable reduction in the number of animals required when compared to the NIH test for potency of human rabies vaccines (37). The focus of the study was investigation of perspectives for eventual introduction of AIT for potency determination of veterinary rabies vaccines in the first place, having in mind the extent of their use and the frequency of control testing. This study is also relevant for testing vaccines for human use, which could in principle be tested with AIT design unique for both veterinary and human rabies vaccines, but with the appropriate dilution corresponding to the specified minimal potency.
Animals, Materials and Methods
A total of six consecutive AITs were performed as follows:
Animals
For this research, we used 80 NMRI outbred mice of both sexes, 5–8 weeks old. These were received from Zentralinstitut für Versuchstierzucht (Hannover, Germany) and then further bred in the Vivarium of Pasteur Institute Novi Sad. To achieve adequate adaptation of experimental animals, eight test groups were formed by a randomization method 2 weeks before the beginning of the experiment. One group containing 10 animals was assigned for each dilution of reference standard or test standard vaccine. Animals were kept in a vivarium with controlled temperature (25°C ± 2°C), with 12-h dark and 12-h light periods and free access to food and water. This research was approved by Institutional Animal Care and Use Committee of Pasteur Institute Novi Sad.
Cell culture
Mouse neuroblastoma cell line (MNA) was obtained from Centro substrati cellulari, Istituto zooprofilattico sperimentale, Brescia, Italy, in 1997 and adapted to Glasgow minimum essential medium +10% fetal calf serum.
Vaccine samples and vaccine dilutions
Biological reference preparation, batch 5, with assigned activity of 10 IU/vial provided by the European Directorate for the Quality of Medicines (EDQM, Strasbourg, France) was taken as both the standard (i.e., reference standard) and the test (i.e., test standard) vaccine. Both vaccines were kept at −20°C before testing and immediately before dilutions, the preparation was reconstituted (one vial for each vaccine) with 1 mL of phosphate-buffered saline (PBS; pH 7.4), as instructed by the manufacturer. For each vaccine, a 3.3-fold dilution series was prepared using PBS (pH 7.4). Vaccine doses of 1/3.3, 1/11, 1/36, and 1/118 dilution were administered to experimental groups of mice intraperitoneally in a volume of 0.2 mL.
Serological assay for vaccine immunogenicity
Preparation of serum samples
Individual blood samples from immunized mice were taken 14 days upon immunization by heart puncture under isoflurane anesthesia (23). Blood sera were collected upon incubation for 2 h at 37°C and centrifugation at 2,000 g for 10 min. Equal volumes (50 μL) of sera from each mouse of a single experimental group were pooled, inactivated at 56°C for 30 min, and kept at −20°C until examination by RFFIT.
Modified RFFIT for quantification of rabies virus neutralizing antibodies
Modified RFFIT was done as described in a previous article (30). General features of the test are (a) performance on microplates and mouse neuroblastoma cell line, (b) requirement of 50 μL of the sample, and (c) completion in 25–27 h.
Briefly, four serial fivefold dilutions were performed in Glasgow minimal essential medium supplemented with 10% fetal bovine serum (25 μL of sample or previous dilution +100 μL of medium), in duplicate columns per sample. Next, 100 μL of each serum dilution was incubated with 50 μL of the challenge virus (strain CVS-11) suspension containing ∼2.60 logCCID50/50 μL (cell culture infective dose [CCID]). After an incubation period of 1 h at 37°C, 100 μL of MNA cell suspension (5 × 10⁵ cells/mL) was added to each well. The plates were incubated at 37°C for 21–23 h and then washed with PBS, fixed with acetone (85%) at −20°C for 30 min, and incubated with the fluorescein-conjugated anti-rabies antibody at 37°C for 30 min. After washing and drying, the wells on the microplate were analyzed under ultraviolet microscope, at magnification 100 × by examination of 10 nonoverlapping fields per well (20 fields per sample dilution) to determine the number of fields showing absence of fluorescent cells or presence of at least one fluorescent cell per field for wells with CVS-11 dilutions for control titration. Immediately before examination, field diameters were adjusted by a diaphragm to equal one-fourth of the well diameter. Ratios of positive fields per well were then used for calculation of −logED50 (effective dose [ED]) values by Spearman-Kärber method, and the final results for quantities of rabies antibodies in IU/mL were calculated by taking the antilogarithm of the difference in −logED50 of the test serum and the working standard serum of known potency used in test. The working standard serum had been prepared from human rabies immunoglobulin produced by Blood transfusion institute of Serbia, Belgrade (raised against Pitman-Moore vaccinal strain), diluted to assigned potency of 0.5 IU/mL, divided into aliquots of 330 μL, and kept at −80°C. Upon freezing, its potency had been estimated in three consecutive RFFITs against second International WHO Standard for human anti-rabies immunoglobulin, obtained from the National Institute for Biological Standards and Control (NIBSC), Potters Bar, United Kingdom, and the obtained geometric mean potency was 0.49 IU/mL. Validation criteria for RFFIT results were (a) the value of −logED50 for the working standard serum between 0.95 and 1.15 and (b) for individual samples, the difference of scores of positive fields by columns not greater than 5. CVS dose was adjusted to obtain valid working standard −logED50 value, and the usual dose was from 2.56 to 2.70 logCCID50/50 μL. In case of invalid results, sera were retested until three valid results were obtained.
Technical acceptance criteria for AIT
Acceptance criteria for AIT were (a) apparent good health of all mice from immunization until blood sampling, (b) possibility of preparation of pools of sera for each dilution as described in Preparation of serum samples section, and (c) obtaining three valid RFFIT results for each pool of mouse sera.
Calculation and statistical analysis of AIT results
All calculations, except calculations of final multi-dose AIT results, were done with GraphPad Prism version 8.3.0, available at
Assessment of the AIT detection limit
The detection limit of the AIT was obtained as the amount of antigen injected per mouse in the last dilution that induces detectable amount of rabies virus neutralizing antibodies (RVNA), namely showing at least one positive field at reading of the corresponding RFFIT result in the lowest dilution (1/5) tested, when −logED50 of the test serum equals 0.95, the lower end of the (0.95–1.15) interval taken above as a validation criterion.
Intra-test and inter-test variation of AIT results
For reference standard and test standard vaccine, arithmetic means and standard deviations for cumulative results in six consecutive AITs were calculated and compared. In previous calculations, for comparison of cumulative results for both vaccine preparations, Kolmogorov-Smirnoff test for normality and, subsequently two-tailed unpaired Student's t-test was used, where no significant statistical differences were found (p > 0.05, data not shown). Afterwards, each reference standard and test standard vaccine dilution were taken into account as a single data group.
Intra-test variation of AIT results was calculated for individual dilutions (calibration points) by the procedure described in appendix I of Rodbard (24), which is independent of any supposed or estimated dose–response model. Briefly, intra-test variance was calculated by the following equation:

where sw denotes within-assay standard deviation, si represents standard deviation for replicate results of individual serum samples, ri is number of replicates per sample (here ri = 3 for all samples), and df is the number of degrees of freedom.
Inter-test coefficient of variation Inter-CV(ī) was calculated by calculating mean  and inter-test standard deviation Sb(i) of 12 means of triplicates for each dilution, and then calculating the ratio Sb(i)/|
 |, where i denotes log dilution (0.52–2.07), and |
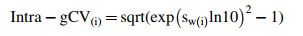
 | is the absolute value for mean of sample means for the corresponding dilution. Finally, intra-test and inter-test geometric coefficients of variation [Intra-gCV(ī) and Inter-gCV(ī)] were calculated as
Estimation of model for dose–response function
Principles of estimation for model of dose–response function were exposed by Rodbard (24), and more recently by Findley and Dillard (10). For definitive estimation of dose–response function, we used GraphPad Prism version 8.3.0 with previous check for eventual outliers by ROUT method (option Q = 10%). Also, the corresponding linear model was included for comparison of the correlation coefficient.
Calculation of final multi-dose AIT results
Calculation of final multi-dose AIT results was done by two alternative methods:
Parallel line model with logarithmic transformation of responses—antigenic potency was calculated using CombiStats 5.0 (EDQM). Observed responses were log-transformed and three RFFIT results for each vaccine dilution were taken as three replicates, followed by parallel line model of calculation. Sigmoidal curves model with logit transformation of responses—antigenic potency was calculated analogous to procedure B, except that the model was sigmoidal curves with logit transformation.
Design of single-dose AIT
In design of a suitable single-dose AIT, we followed general recommendations of United States Pharmacopoeia for design and development of biological assays (33) and biological assay validation (34). Specifically, we took into account that the single-dose AIT design should enable high percent of valid runs as well as keeping rates of both false positive and false negative results to a minimum. While the principle interest of clients and the public is that false positives are prevented, the interest of vaccine producers is also keeping false negatives to a minimum.
First, we made a design of single-dose AIT with two standard vaccine preparations named potent control (POT) and subpotent control (SUB), and named such design SDAIT-PSVC test. It would thus include two control groups of 10 mice each, along with the test group of 10 mice, using 30 mice in total. By finding the optimal sigmoidal dose–response curve, we found that the response optimization step in the development of AIT has been successfully realized. We were then able to set potency values for two standard vaccine preparations as follows: the starting point for determination of standard vaccine potencies was the sigmoidal curve inflection point (X = 1.208, Y = −0.015), around which are statistical considerations most reliable. X value of 1.208 corresponds to a vaccine potency equal to 0.62 IU/mL, and we could name this potency “working cut-off vaccine potency.” Then we found, by extrapolation of Y variable (in log IU/mL RVNA), two corresponding Y values, Y POT for POT and Y SUB for SUB, such that (Y POT − 2SDPOT) = (Y SUB + 2SDSUB) = −0.015, where SDPOT and SDSUB were standard deviations for POT and SUB, respectively, which were approximated from a plot of obtained standard deviations Sb(i) against respective log dilution (X) values, assuming that Sb varies linearly between adjacent points. Statistical validity criteria for SDAIT-PSVC test would include (a) Y POT > Y SUB and (b) Y SUB + 4(SDPOT + SDSUB) > Y POT. These criteria would enable that the test results are valid in >90% of runs. The test vaccine should in principle be diluted in accordance to the working cut-off potency of 0.62 IU/mL depending on its purpose (veterinary or human), so that the dilution for a test veterinary vaccine is 1/1.62 and the dilution for a test human vaccine is 1/4.04.
Since vaccine potencies generally correlate with induced RVNA levels, one could further design a single-dose AIT without standard vaccine controls (designated here as SDAIT-RVNA test), but only after RVNA cut-off limits are firmly established. It would include only one test group of 10 mice. Although it has to rely on well-established cut-offs obtained during SDAIT-PSVC implementation, current induced antibody levels (log IU/mL RVNA) for Y POT (0.275) and Y SUB (−0.441) may be accepted for initial design of SDAIT-RVNA test. The interpretation of possible results for both SDAIT-PSVC and SDAIT-RVNA test is presented under Obtaining and interpretation of single-dose AIT results section below.
Since in a single-dose AIT one would have three (in SDAIT-PSVC test) or only one (in SDAIT-RVNA test) sample for RVNA determination by RFFIT, and furthermore with sufficient sample volumes, appropriate RFFIT design could and should be identical or very similar to the current RFFIT design for HRIG potency testing prescribed by European Pharmacopoeia (16). Such design enables that the result is calculated by probit analysis and could be associated with respective statistical validity criteria for parameters of regression, linearity, and parallelism.
Results
Individual RFFIT results for six independent AITs with respective geometric mean values are presented in Table 1.
Rapid Fluorescent Focus Inhibition Test Results for Different Dilutions of Standard and Sample Vaccines in Six Consecutive Antibody Induction Tests with Respective Geometric Means
GM, geometric mean; RFFIT, rapid fluorescent focus inhibition test.
AIT detection limit
One positive field out of 20 fields in total (1/20) for 1/5 serum dilution, while −log ED50 value of standard serum was 0.95, corresponded to the upper RFFIT detection limit of 0.12 IU/mL RVNA.
The last dilution that consistently yielded results above the RFFIT detection limit was 1/118, meaning that the AIT detection limit was equal or lower than 0.014 IU/mouse, or 0.072 IU/mL of rabies vaccine potency.
Intra-test and inter-test variation of AIT results for individual dilutions
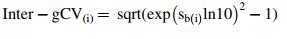
Log-transformed RFFIT results, intra-test and inter-test variability for individual dilutions, are presented in Table 2. Intra-CV for log-transformed RFFIT results ranged from 17% for 1/118 dilution to 47% for 1/11 dilution, while the range for respective gCVs were from 13% to 17%. Inter-test CV was from 27% for 1/3.3 dilution to 136% for 1/11 dilution. Between-assay standard deviations are graphically presented in Figure 1.
Plot of vaccine dilution versus RVNA titer induced by vaccination. Independent variable X is represented by log vaccine dilution, while dependent variable Y is log IU/mL RVNA in mouse sera determined by RFFIT upon immunization with various dilutions of biological reference preparation for rabies vaccine, batch 5. Error bars represent between-assay standard deviations. RFFIT, rapid fluorescent focus inhibition test; RVNA, rabies virus neutralizing antibodies.
Log-Transformed Rapid Fluorescent Focus Inhibition Test Results for Different Dilutions of Standard and Sample Vaccines in Six Consecutive Antibody Induction Tests and Intra-Test and Inter-Test Variation for Individual Dilutions

sw = within-assay standard deviation.
sb = between-assay standard deviation, that is, standard deviation of sample means.
Intra-CV = sw/| |.
|.
Inter-CV = sb/| |.
|.
Intra-gCV = sqrt (exp (sw ln10)2 − 1).
Inter-gCV = sqrt (exp (sb ln10)2 − 1).
gCV, geometric coefficients of variation.
Model for dose–response function
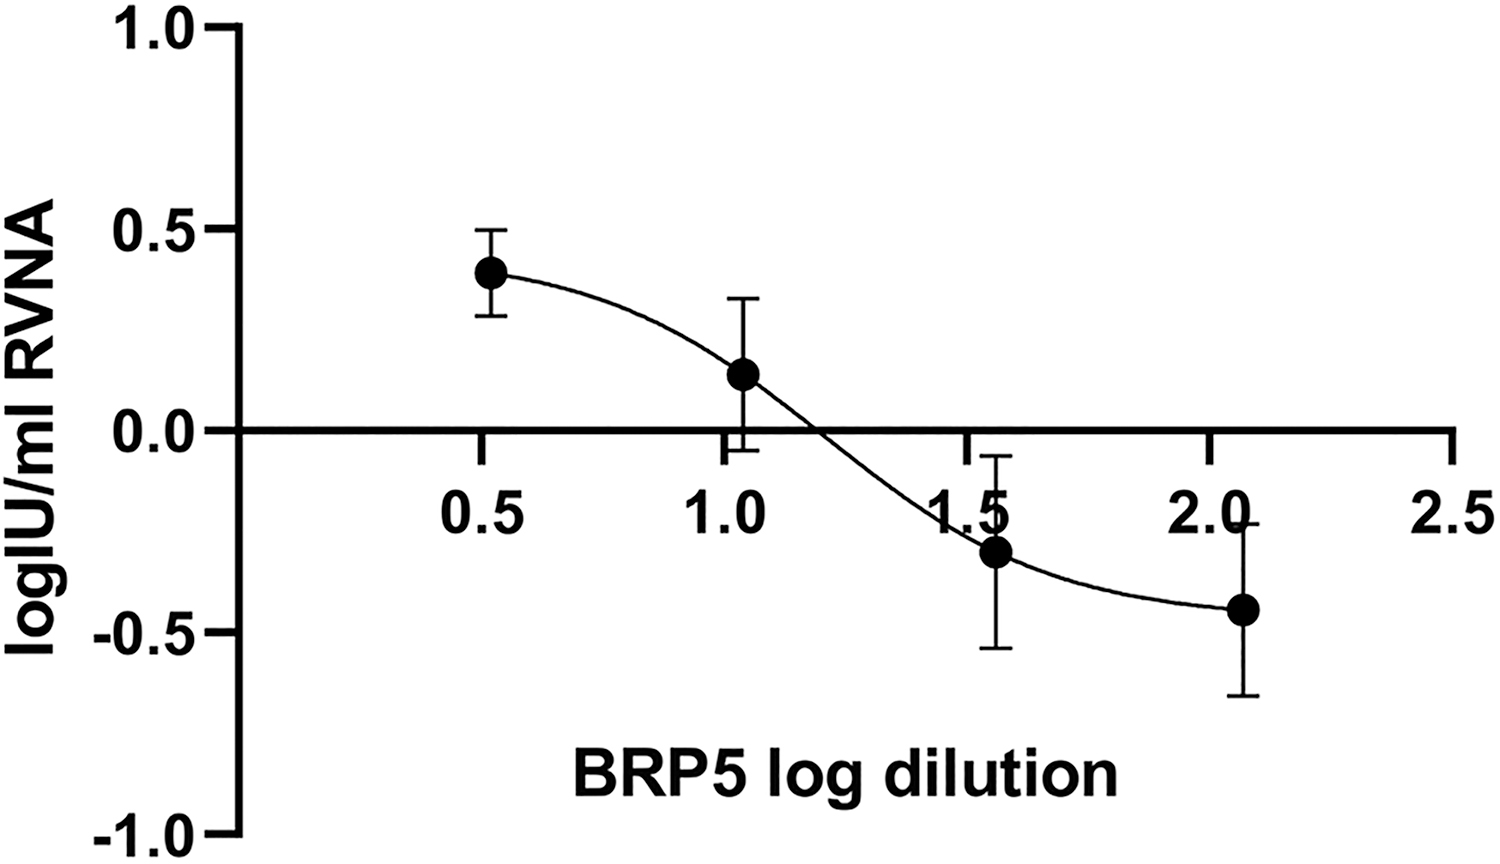
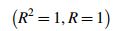
Upon a previous check by ROUT, whereby no outliers were detected, a perfect fit for a symmetrical sigmoidal curve (Fig. 2) was obtained. The estimated values X and Y were then fitted to a 4-parameter sigmoidal function, and the following symmetrical sigmoidal 4-parameter function was estimated as optimal:
Graph of the sigmoidal function Y = −0.4677 + (0.4379 − 0.4677)/(1 + (X/1.208)(−1.831)). Independent variable X is represented by log vaccine dilution, while dependent variable Y is log IU/mL RVNA in mouse sera determined by RFFIT upon immunization with various dilutions of biological reference preparation for rabies vaccine, batch 5.

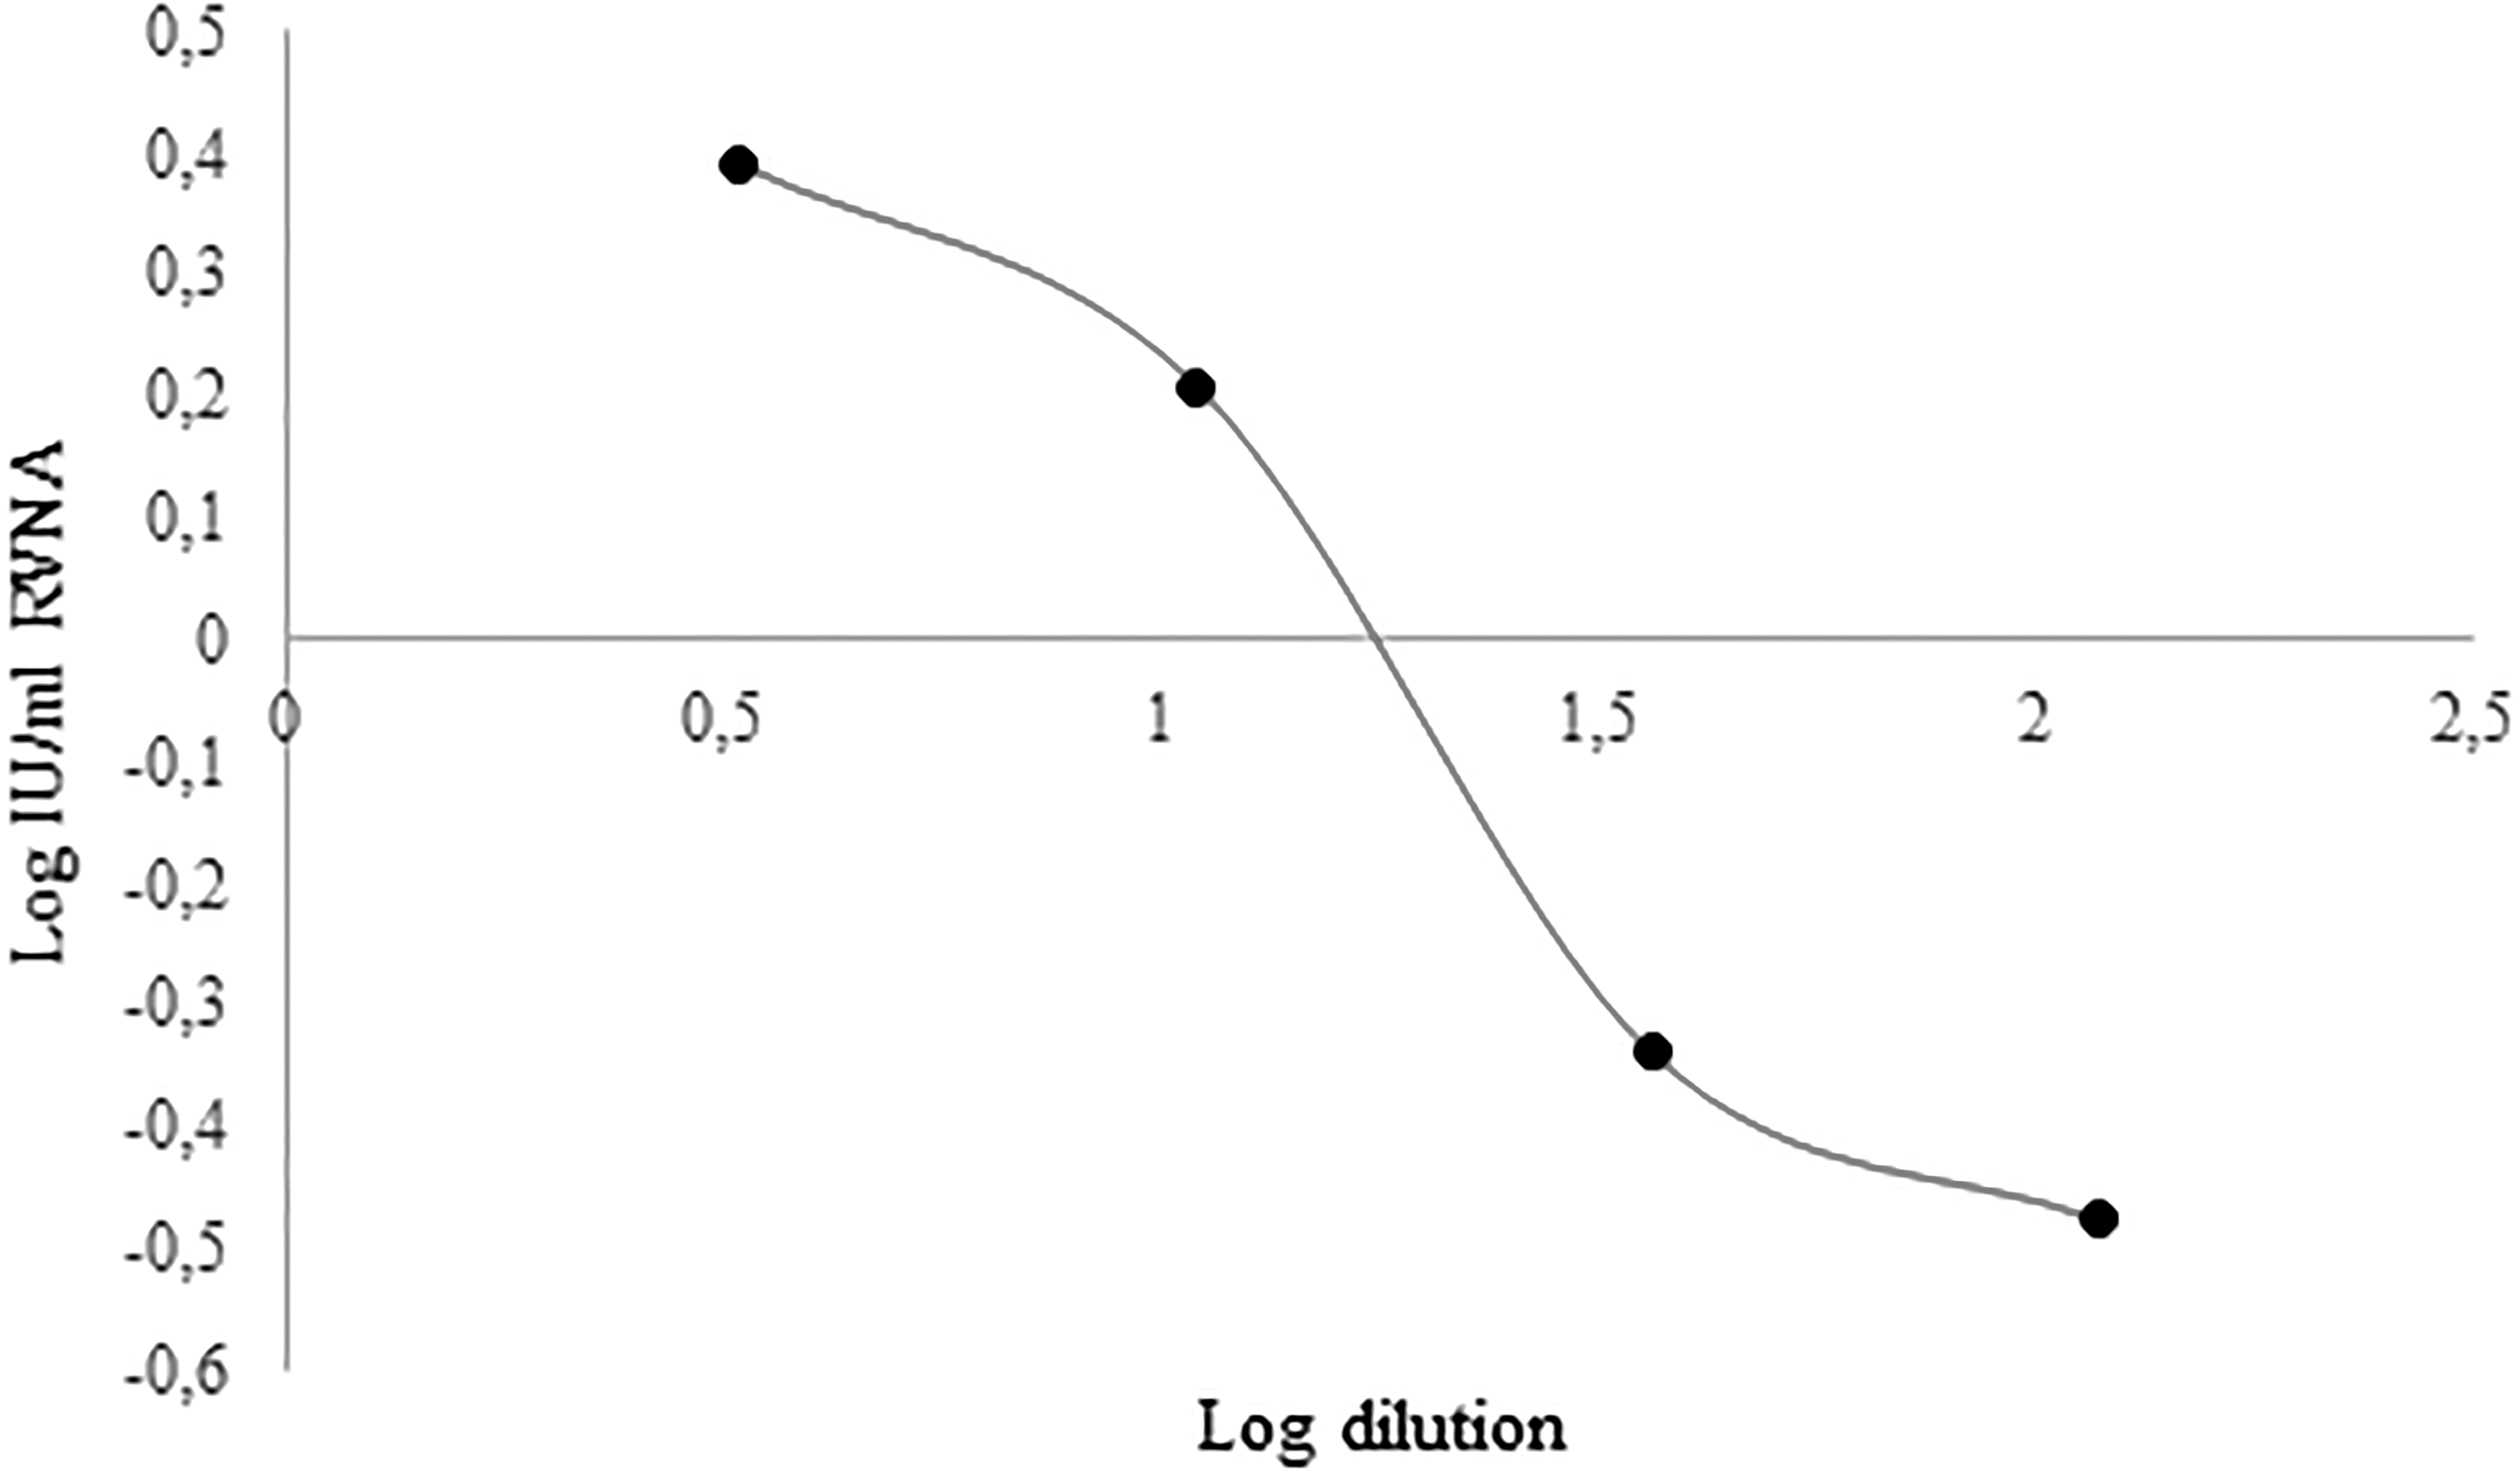
whereas the corresponding linear model (Fig. 3) was
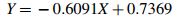
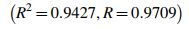
where R = coefficient of correlation

Graph of the linear function Y = −0.6091 X + 0.7369. Independent variable X is represented by log vaccine dilution, while dependent variable Y is log IU/mL RVNA in mouse sera determined by RFFIT upon immunization with various dilutions of biological reference preparation for rabies vaccine, batch 5.
Calculation of final AIT results
Parallel line model with logarithmic transformation of RFFIT results
AIT results were calculated by parallel line model with logarithmic transformation of each three RFFIT results for respective vaccine dilutions as presented in Table 3 using CombiStats v 5.0. As evident from Table 3, average vaccine potency value was 10.8 IU/mL with the range from 5.3 to 17.7 IU/mL. No statistically valid results were obtained in any of the tests performed. Respective CombiStats files 1–6 are presented in Supplementary Data.
Antibody Induction Test Results Along with Statistical Criteria of Test Validity Estimated by Parallel Line Model with Logarithmic Transformation of Rapid Fluorescent Focus Inhibition Test Results in Triplicate
Each RFFIT result from Table 1 was taken as one replicate.
−, probability more than 0.05 (i.e., not significant).
, probability less than 0.05 (i.e., significant).
, probability less than 0.01 (i.e., highly significant).
, probability less than 0.001 (i.e., even more significant).
AIT, antibody induction test; ED, effective dose.
Symmetrical sigmoidal curve model with logit transformation of RFFIT results
AIT results were calculated by symmetrical (4 parameter) sigmoidal curve model with logit transformation with each three RFFIT results for respective vaccine dilutions as presented in Table 4 using CombiStats v 5.0. Average vaccine potency value was 9.8 IU/mL with the range from 3.0 to 27.9 IU/mL. Statistically valid results were obtained only for two out of six AITs. Respective CombiStats files 7–11 are presented in Supplementary Data.
Antibody Induction Test Results Along with Statistical Criteria of Test Validity Estimated by Symmetrical Sigmoidal Curve Model with Logit Transformation of Rapid Fluorescent Focus Inhibition Test Results in Triplicate
Each RFFIT result from Table 1 was taken as one replicate.
−, probability more than 0.05 (i.e., not significant).
, probability less than 0.05 (i.e., significant).
, probability less than 0.01 (i.e., highly significant).
, probability less than 0.001 (i.e., even more significant).
N/A, not applicable; ND, results could not be calculated.
Obtaining and interpretation of single-dose AIT results
Estimated values for POT, SUB, SDPOT, and SDSUB are presented in Table 5. Interpretation of SDAIT-PSVC result (R T) would be the following: (A) if R T > POT −0.290 and R T > SUB +0.426, the test vaccine would pass the test, (B) if R T < POT −0.290 and R T < SUB +0.426, the test vaccine would fail the test, and (C) if R T lies between (POT −0.290) and (SUB +0.426), the result would be inconclusive.
Parameters Relevant for Design of Single-Dose Antibody Induction Test
Estimated from the fitted symmetrical sigmoidal dose–response curve with inflection point (1.208, −0.015) to satisfy equation (Y POT − 2SDPOT) = (Y SUB + 2SDSUB) = −0.015, whereby SDPOT and SDSUB are standard deviations for potent and subpotent vaccine control, respectively, estimated from plot (X vs. between-assay standard deviation) on assumption of linear change of standard deviation between adjacent points (SDPOT = 0.145 and SDSUB = 0.213).
BRP, biological reference preparation; RVNA, rabies virus neutralizing antibodies.
Interpretation of SDAIT-RVNA result would be similar, but the cut-off RVNA levels would be known in advance. Thus, (A) if R T > 0.275, the test vaccine would pass the test, (B) if R T < −0.441, the test vaccine would fail the test, and (C) if R T lies between these two values, the result would be inconclusive. A further option in order that the incidence of inconclusive results is minimized is to obtain replicate RFFIT results (only in case of the first inconclusive result), and then take the mean value along with the respective 2SDT value for the following decision: (A) if (R T + 2SDT) > 0.275, the test vaccine would pass the test, and (B) if (R T − 2SDT) < −0.441, the test vaccine would fail the test.
Discussion
Results of our study have given answers to some important issues for further development of strategy of rabies vaccines potency testing.
First, the estimated detection limit of AIT in principle allows calculation of vaccine potency below cut-off values for both human and veterinary rabies vaccines.
We could clearly determine the intra-test and inter-test variability for AIT values at all four dilutions. Intra-test coefficient of variation, that is CV for log-transformed RFFIT results, ranges from 17% for 1/118 dilution to 47% for 1/11 dilution. Interestingly, respective gCVs appeared more uniform, within the range 0.121–0.164. These values represent, at the same time, the inter-test gCVs for the modified RFFIT, and are in accordance for criterion gCV = <30% of Kostense et al. (18). Between-test CV ranged from 27% for 1/3.3 dilution to 79% for 1/36 dilution.
The symmetrical sigmoidal 4-parameter model was found as optimal (R = 1), while the corresponding linear model was associated with R = 0.97 (Figs. 2 and 3).
As for statistical validity parameters of the multi-dose AIT, neither test was statistically valid for linear model, while for the sigmoidal model, only two out of six tests were valid (Tables 3 and 4 and Supplementary Data). Having in mind a relatively high variability of the AIT, adjustment of the test design that would substantially lower variability and thus enable consistent statistically valid testing procedure would be necessary. A straightforward way for that would be significant enhancement of number of mice per dilution and/or more dilutions used. An improvement in uniformity of immunological response of mice may in principle be achieved by using inbred mouse strains, such as C57BL/6N mice (29), but eventually using more mice per test will probably be inevitable to achieve statistical validity criteria. However, this is in sharp contrast to 3R animal welfare principle of animal number reduction.
In last decades, there was a paradigm shift from the classical approach, based on the uniqueness of biological batches. Such strategy demands extensive tests to demonstrate safety and efficacy on lot to lot bases, to confirm the consistency of production process. These tests are preferably in vitro tests that demonstrate biological batches produced under good manufacturing practice conditions present the same key characteristics that had been extensively tested in the registration process. This approach enables that, for the laboratory control of established vaccines with standardized composition and production, only in vitro tests could be sufficient. However, a reliable in vivo test will still remain necessary on the following, relatively rare occasions: first, for new vaccine formulations for which a reliable in vitro immunogenicity testing procedure has not yet been established, and second, in cases where there is a sudden high demand and/or offer shortage on one hand and insufficient confidence in the documentation of the product offered on the other.
Thus, efforts for development of a reliable quantitative rabies vaccine potency test will stay in conflict with animal welfare principles. However, there is a fortunate possibility that such battle is discontinued immediately. Rabies vaccines are administered at the same dose regardless of the exact vaccine potency as long as they satisfy the minimum prescribed potency. So, there is actually no practical need for an exact quantitative potency test, especially not for an exact in vivo potency test.
A new strategy of potency testing of both veterinary and human rabies vaccines could be the introduction of a single-dose AIT, namely SDAIT-PSVC test at first, and then eventually SDAIT-RVNA test. In relative potency testing of biologicals, it is a well-established practice of taking a standard preparation of the same kind as the test preparation in each run, so that all known and unknown factors that may influence the results are kept under control. However, SDAIT-RVNA test may be an exception on condition that its reliability is previously explored during implementation of SDAIT-PSVC test. Specifically, one should monitor matching (POT −0.290) and (SUB +0.426) values for defined mouse strain and weight across different housing conditions in different laboratories in SDAIT-PSVC test and then make corrections for POT and SUB values if necessary. When POT and SUB values are firmly established, obtaining a good result, that is, good immune response in log IU/mL RVNA with SDAIT-RVNA test, would surely mean satisfactory vaccine potency, because nothing else than the vaccine would make such a result. In other words, false positive results would not be possible, even without a standard vaccine sample taken for within-run comparison. On the other hand, false negative results might happen because of poor housing conditions for mice, unnoticed illness, or immunosuppression, for example. However, such causes are less probable in accredited and experienced laboratories. Anyway, in all cases of failed potency test results, the customer should have a possibility to check the result once again in another, preferably reference laboratory. Consequently, lack of vaccine standard preparations in SDAIT-RVNA test is not likely to impose any drawback of practical significance. On the other hand, reduction of the number of mice to 10 mice in total per test would mean an important achievement for the ease of performance as well as for advance of animal welfare in potency testing of rabies vaccines. Finally, one should develop strategy for handling inconclusive results that would occasionally and inevitably happen with test vaccine potencies near the prescribed cut-offs. Since the interest of patients and public should be regarded as a little bit more important than the interest of vaccine producers in this matter, all technically inconclusive results should finally be reported as a failed final result.
Conclusion
In our study AIT showed satisfactory detection limit for testing potency of both veterinary and human rabies vaccines. However, due to relatively high test variability, the presented test design of a multi-dose AIT is unsuitable for obtaining results conforming to common statistical validity criteria. Since further test development would require enhancement of the number of mice in the test, which is contrary to 3R animal welfare principles on one hand, and having in mind no practical need for knowing precise rabies vaccine potency on the other, we propose an immediate ban of both the NIH test and further development of multi-dose AIT as well as any other quantitative in vivo test for rabies vaccine potency. As a routine procedure that could immediately replace the practice of quantitative in vivo rabies vaccine potency testing, we propose introduction of the semiquantitative, single-dose AIT. This test could be used for final potency control of both veterinary and human rabies vaccines, and could be introduced immediately.
Footnotes
Acknowledgments
The authors are thankful to Mrs. Ljiljana Lazarević-Ivanc for routine maintenance of MNA cell line and to Mr. Đorđe Vukomanović for excellent technical assistance. Also, authors are grateful for the invaluable contribution of the anonymous reviewers whose efforts were essential for final formulation of this article.
Author Disclosure Statement
No competing financial interests exist.
Funding Information
No external funding had been agreed or received for this investigation.
Supplementary Material
Supplementary Data
Editor's Note
A concern was raised in review. A summary of the main points is listed below along with the authors' response.
References
Supplementary Material
Please find the following supplemental material available below.
For Open Access articles published under a Creative Commons License, all supplemental material carries the same license as the article it is associated with.
For non-Open Access articles published, all supplemental material carries a non-exclusive license, and permission requests for re-use of supplemental material or any part of supplemental material shall be sent directly to the copyright owner as specified in the copyright notice associated with the article.