
Abstract
Granulocyte/macrophage colony-stimulating factor (GM-CSF) and macrophage CSF (M-CSF) modulate differentiation and immune functions of macrophages (MΦ). Our aim was to evaluate how different MΦ differentiation conditions influence the MΦ response to virus infection. To address this, we differentiated bone marrow-derived MΦ in either GM-CSF or M-CSF and measured the cytokine responses to two different strains of lymphocytic choriomeningitis virus (LCMV) (clone 13; Cl13 or Armstrong; ARM). GM-CSF MΦ infected with either LCMV-ARM or -Cl13 produced more IL-6 than M-CSF MΦ, whereas M-CSF MΦ generated more IL-10 than GM-CSF MΦ. Interestingly, in M-CSF MΦ, LCMV-ARM induced more IL-10 production than Cl13. However, we could not detect any IL-12p70 or IL-23 after infection from either cell types. We also observed that GM-CSF MΦ was more efficient than M-CSF MΦ in supporting antigen-specific CD8+ T cell proliferation. Taken together, our data demonstrate that GM-CSF and M-CSF MΦ differ in how they respond to viral infection by their production of different cytokines, and their support for CD8+ T cell proliferation.
Introduction
Lymphocytic choriomeningitis virus (LCMV) is an Arenavirus, which can cause acute or chronic infections in the mouse (42,60). LCMV has been used as a robust mouse model to study the immunosuppression of various immune parameters during virus/host interaction such as inhibition of dendritic cell (DC) differentiation and maturation (66), impairment of antigen presentation (5), and T cell exhaustion (79). Several reports have shown that LCMV-Cl13 infects DCs and cause immunosuppression, due to downregulation of MHCI, MHCII, and costimulatory molecule expression in DC (13,64 –66). Additionally, LCMV has impacted DC differentiation and maturation, by enhancing the production of type I IFN. As a result, deficiency of DC development affected the efficiency of the adaptive immune responses (13,64 –66). As described above, DCs/LCMV interactions have been investigated by many researches to understand the immunosuppressive mechanisms that can occur during virus infection, but there has been no reports on how granulocyte/macrophage colony-stimulating factor (GM-CSF)-derived MΦ function under similar condition.
The macrophage CSF (M-CSF) and GM-CSF are cytokines that have the capability of aiding myeloid cell differentiation into MΦ (7,29). In the mouse, addition of GM-CSF to bone marrow cells can allow for the differentiation of M1-like MΦ (16). This classification relates to the classical activation by IFN-γ plus lipopolysaccharide (LPS) stimulation to generate M1 cells or the alternative activation into M2 cells after IL-13 or IL-4 stimulation (7,16,49,54). Previous work demonstrated that GM-CSF-cultured MΦ secrete proinflammatory cytokines, such as IL-23, IL-12p70, TNF-α, and IL-6 in response to LPS, whereas M-CSF-cultured cells produced IFN-β, TGF-β, and IL-10 in response to LPS stimulation (7,26,29,39). Few reports have examined LCMV interactions with spleen-derived MΦ (4,52,53), whereas others have shown that marginal zone MΦ are important for LCMV clearance (59). LCMV infection of human monocyte-derived macrophages (hMDMs) also resulted in enhanced mRNA expression of IL-6, TNF-α, IL-1β, and IL-8 (78). However, how virus infection affects the activation of proinflammatory GM-CSF MΦ has not been reported.
Many studies have examined the cytokine production by DCs or MΦ in response to bacterial infection or LPS stimulation, reporting that the cytokines IL-23 and IL-12 can be induced by MΦ and DCs (9,48) resulting in NK and T cell activation leading to IFN-γ production (50). Moreover, IL-12 production is needed for Th1-driven immune responses (9,28,36,41), whereas IL-23 enhances the proliferation of Th17 cells (1,37,69). On the other hand, IL-10 is secreted by MΦ and monocytes to control inflammation after the infection is resolved (55) as it reduces the production of proinflammatory cytokine, MHCII expressions, and secretion of chemokine (22). In this study, we defined how GM-CSF MΦ differ from the classical M-CSF-derived MΦ with regard to their ability to support the proliferation of antigen-specific CD8+T cells, as well as phenotypic and functional characteristics when responding to a virus infection.
Materials and Methods
Mice and media
Six- to 8-week-old C57BL/6 (H-2b) mice were purchased from JAX Laboratories (Bar Harbor, Maine) and used as a source for bone marrow-derived macrophages. All procedures were carried out in accordance with guidelines of the Canadian council of animal use. All media (RPMI or DMEM) needed to culture the cells used in this study were purchased from Invitrogen (Ontario, Canada).
Virus preparation
The Baby Hamster Kidney fibroblast cell line (BHK) was used to propagate LCMV-Cl13 or LCMV-ARM strains, originally obtained from F. Lehmann-Grube (Hamburg, Germany), as previously described (63). Virus titration was carried out as described by Johnson and Homann (38). The LCMV-GFP strains were originally prepared in the laboratory of Dr. de La Torre at the Scripps Research Institute, La Jolla (23), and kindly provided by Dr. Watts' group at the University of Toronto, Canada.
Primary cell preparations
Bone marrow was flushed from the femurs and tibia with PBS using a 26g 3/8 sterile needle (Becton-Dickinson, Rutherford, NJ). Cell suspension was prepared in lysis buffer made with 1.66% ammonium chloride (Fisher, NJ) for 5 min to lyse red blood cells. Thereafter, cells were cultured in a six-well tissue culture plate in RPMI supplemented with 10% FCS with either 10 ng/mL GM-CSF (Cedarlane, Ontario, Canada) or 5 ng/mL M-CSF (Shenandoah Biotechnology) and 50 μg/mL Gentamicin (BioShop, Canada). GM-CSF MΦ or M-CSF MΦ were generated and the adherent cells were harvested on day 7 postculture as described before (2,3).
The phenotypic characteristics of GM-CSF MΦ or M-CSF MΦ were evaluated by flow cytometry as described below. Mouse bone marrow-derived DCs (BMDCs) were generated in the presence of GM-CSF (10 ng/mL) after culturing for 7 days. Nonadherent cells were transferred, on day 3, to a new six-well plate and incubated in a fresh GM-CSF media until day 7 at 37°C. The phenotypic characteristics of BMDCs were evaluated by flow cytometry (14) as described below.
BMDMs (GM-CSF MΦ or M-CSF MΦ) were infected with LCMV-Cl13, or - LCMV-ARM (MOI = 3), or stimulated with LPS from Pseudomonas aeruginosa (1 μg/mL), and the supernatants were collected at different times and stored at −80°C to perform ELISA as described below.
Flow cytometry analysis of surface antigens
Flow cytometry analyses of BMDCs, GM-CSF MΦ, and M-CSF MΦ were performed after cells were grown (cultured) for 7 days. The cells were stained for 20 min at 4°C with fluorochrome-labeled anti-mouse Abs (BioLegend) specific for the surface markers; CD11b (clone M1/70-PE), F4/80 (clone BM8-PE/Cy5), MHCII (clone M5/114.15.2-FITC), and CD11c (clone N418-PE/Cy7) in multistaining combinations, or for the intracellular marker CD68 (clone FA-11-PE). The marker expression was detected using the CytoFLEX flow cytometer (Beckman Coulter) and analyzed using FlowJo software.
Cytokine ELISA
The mouse ELISA kits were purchased from e-Biosciences, and measured the production of proinflammatory and anti-inflammatory cytokine profiles secreted from the stimulated cells. The supernatant samples were collected at 6 and 24 h from GM-CSF MΦ or M-CSF MΦ stimulated with LPS, LCMV-Cl13, or LCMV-ARM. The mouse IL-12p70, IL-23, IL-6, and IL-10 ELISA assays were performed according to the manufacturer's instructions. Absorbance was measured with the BioTek ELx800 Microplate Reader (Winooski, VT). Data are representative of the average of quadruplicate wells ± SD. The IL-23 and IL-12p70 Kits detect both the heterodimer subunits for each cytokine.
Arginase and nitrite detection assays
To assess bone marrow-derived dendritic macrophages' (BMDMs) polarization to a M2 state, arginase activity was determined as described previously (34). Briefly, MΦ (1 × 10⁶) were incubated overnight with IL-4 (Bioscience), or LPS from P. aeruginosa (Sigma-Aldrich) for stimulation, or only medium to serve as a background control. After stimulation, the cells were resuspended in lysis buffer for 30 min at 4°C in addition to the following protease inhibitors; leupeptin (8 μg/mL) and PMSF (100 μM) purchased from Sigma (Oakville, ON, Canada). Next, the lysate was incubated with 0.5 M L-arginine at 37°C for 2 h before measuring at 550 nm using the Varioskan spectrophotometric microplate reader (Thermo Electron Corp., Finland) to determine urea concentration in the samples.
To evaluate M1 polarization of BMDM, we measured nitrites detected in the supernatant of GM-CSF MΦ or M-CSF MΦ through the Griess reaction as we described previously (68). The concentration of nitrite was determined by measuring OD at 540 nm using the Varioskan microplate reader. After treating GM-CSF MΦ or M-CSF MΦ with IL-4 or LPS for 24 h, cell culture supernatant was transferred to a 96-well flat-bottom plate, and sulfanilamide solution (1% w/v sulfanilamide in 5% w/v phosphoric acid; Sigma-Aldrich) was added to each well for 10 min. The photometric NED solution (0.1% w/v N-1-napthylethylenediamine dihydrochloride in water; Sigma-Aldrich) was then added to each well and incubated at room temperature in the dark for 10 min. Absorbance were measured at 540 nm using the Varioskan spectrophotometric microplate reader. Sodium nitrite (0–100 μM) was purchased from Fisher Scientific Canada to obtain the standard curve.
Phagocytosis assay
GM-CSF MΦ, M-CSF MΦ, or BMDCs (1 × 10⁵ cells/well), were cocultured in round-bottom 96-well plates with antigen donor cells (ADCs) at a ratio of 1:3 for 1 h at 37°C in a total volume of 100 μL. As ADCs, we employed HEK cells labeled with the fluorescent marker carboxyfluorescein diacetate succinimidyl ester (CFSE) according to the manufacturer's instruction (Invitrogen). Briefly, HEK cells were incubated with the CFSE dye (0.2 μg/mL) for 15 min at 37°C. The CFSE-labeled HEK cells (ADCs) were treated to undergo death as we published previously (2). To achieve this, the cells were snap frozen (lysed) in liquid nitrogen and UV irradiated using a CL-1000M UV crosslinker (Ultraviolet Products, Upland, CA) at a radiation intensity of 200,000 μJ/cm2 (maximum intensity) for 10 min. After coincubation with APCs, we stained with CD11b antibody for 20 min at 4°C, and performed FCM analysis to distinguish the two populations, where double-positive cells were APCs that phagocytosed the CFSE-labeled ADCs similar to our previously published protocol (2).
CD8+ T cell proliferation assay
Splenocytes were harvested from LCMV-WE immune mice (30 days postinfection) and further purified with the lymphocyte separation medium (Fisher, Canada), as previously described (20). The cells were labeled for 15 min at 37°C with 0.4 μM CFSE purchased from Invitrogen. The cells were cultured with the GP33–41 peptide-pulsed BMDCs or BMDMs for 5 days, in the presence of recombinant IL-2 (10 U/mL), before staining for CD3 (clone 17A2-PE; Biolegend) and CD8α (clone 53–6.7-PE/Cy5; BioLegend) and CFSE staining by flow cytometry. Percent proliferation was determined by calculating the % of CD8+ CD3+ CFSElow T cells compared with unstimulated CFSEHi-labeled control T cells (53).
Immunofluorescence microscopy to detect LCMV-GFP after infection
Virus-infected GM-CSF MΦ or M-CSF MΦ were visualized by immunofluorescence microscopy of the virus GFP expression after infection. In general, the cells were incubated for 60 min with recombinant LCMV green fluorescent protein/chloramphenicol acetyltransferase (r3LCMV GFP/CAT) (23) with the LCMV strains LCMV-Cl13 or LCMV-ARM, to allow for infection to occur, and were then cultured at a density of 2 × 10⁵/well onto 12 mm circular sterile glass cover slips already placed in a 24-well plate (Fisher Scientific) and were left for 48 h to allow for GFP expression to accumulate in the infected cells because the expression was weak and hard to detect before 12 h postinfection.
For fluorescence microscopy to detect green fluorescence we employed the Leica DM IRE2 (Germany) to examine the infection in GM-CSF MΦ or M-CSF MΦ. To acquire the fluorescent images at a 20 × magnification, we made use of the filter system N2.1S and the Leica DFC340-cooled monochrome digital camera.
Statistical analysis
Statistical significances were carried out using unpaired, two-tailed Student's t-test. p < 0.05 values were considered statistically significant. All values are reported as mean ± SD from three replicates.
Results
Immunostaining of myeloid cells derived with either GM-CSF or M-CSF
We cultured BMDCs and BMDMs in GM-CSF or M-CSF for 7 days in vitro, similar to previously published reports (2,7,26,39). After 7 days of culture, the adherent cells (GM-CSF MΦ or M-CSF MΦ) were tested for the expression of the following surface markers (CD11b, CD11c, F4/80) as well as MHCII by flow cytometry. Using double staining for CD11b and F4/80, we observed that M-CSF MΦ highly expressed both markers compared with GM-CSF MΦ or BMDCs (Fig. 1A–C). To further characterize these cells, we gated on the CD11b populations because it is expressed by all the myeloid cell populations and evaluated the expression of MHC-II or CD11c in the same sample. CD11c was expressed on all cell populations (≥94% + ve) with GM-CSF MΦ and BMDCs displaying the highest expression as evaluated by the MFI (data not shown). As expected, MHC-II expression (Fig. 1A, B) was bright on GM-CSF MΦ or BMDCs (≥64% + ve) and profile was bimodal distribution, whereas only 9% of the M-CSF MΦ showed dim expression of the MHC-II molecules (Fig. 1C).
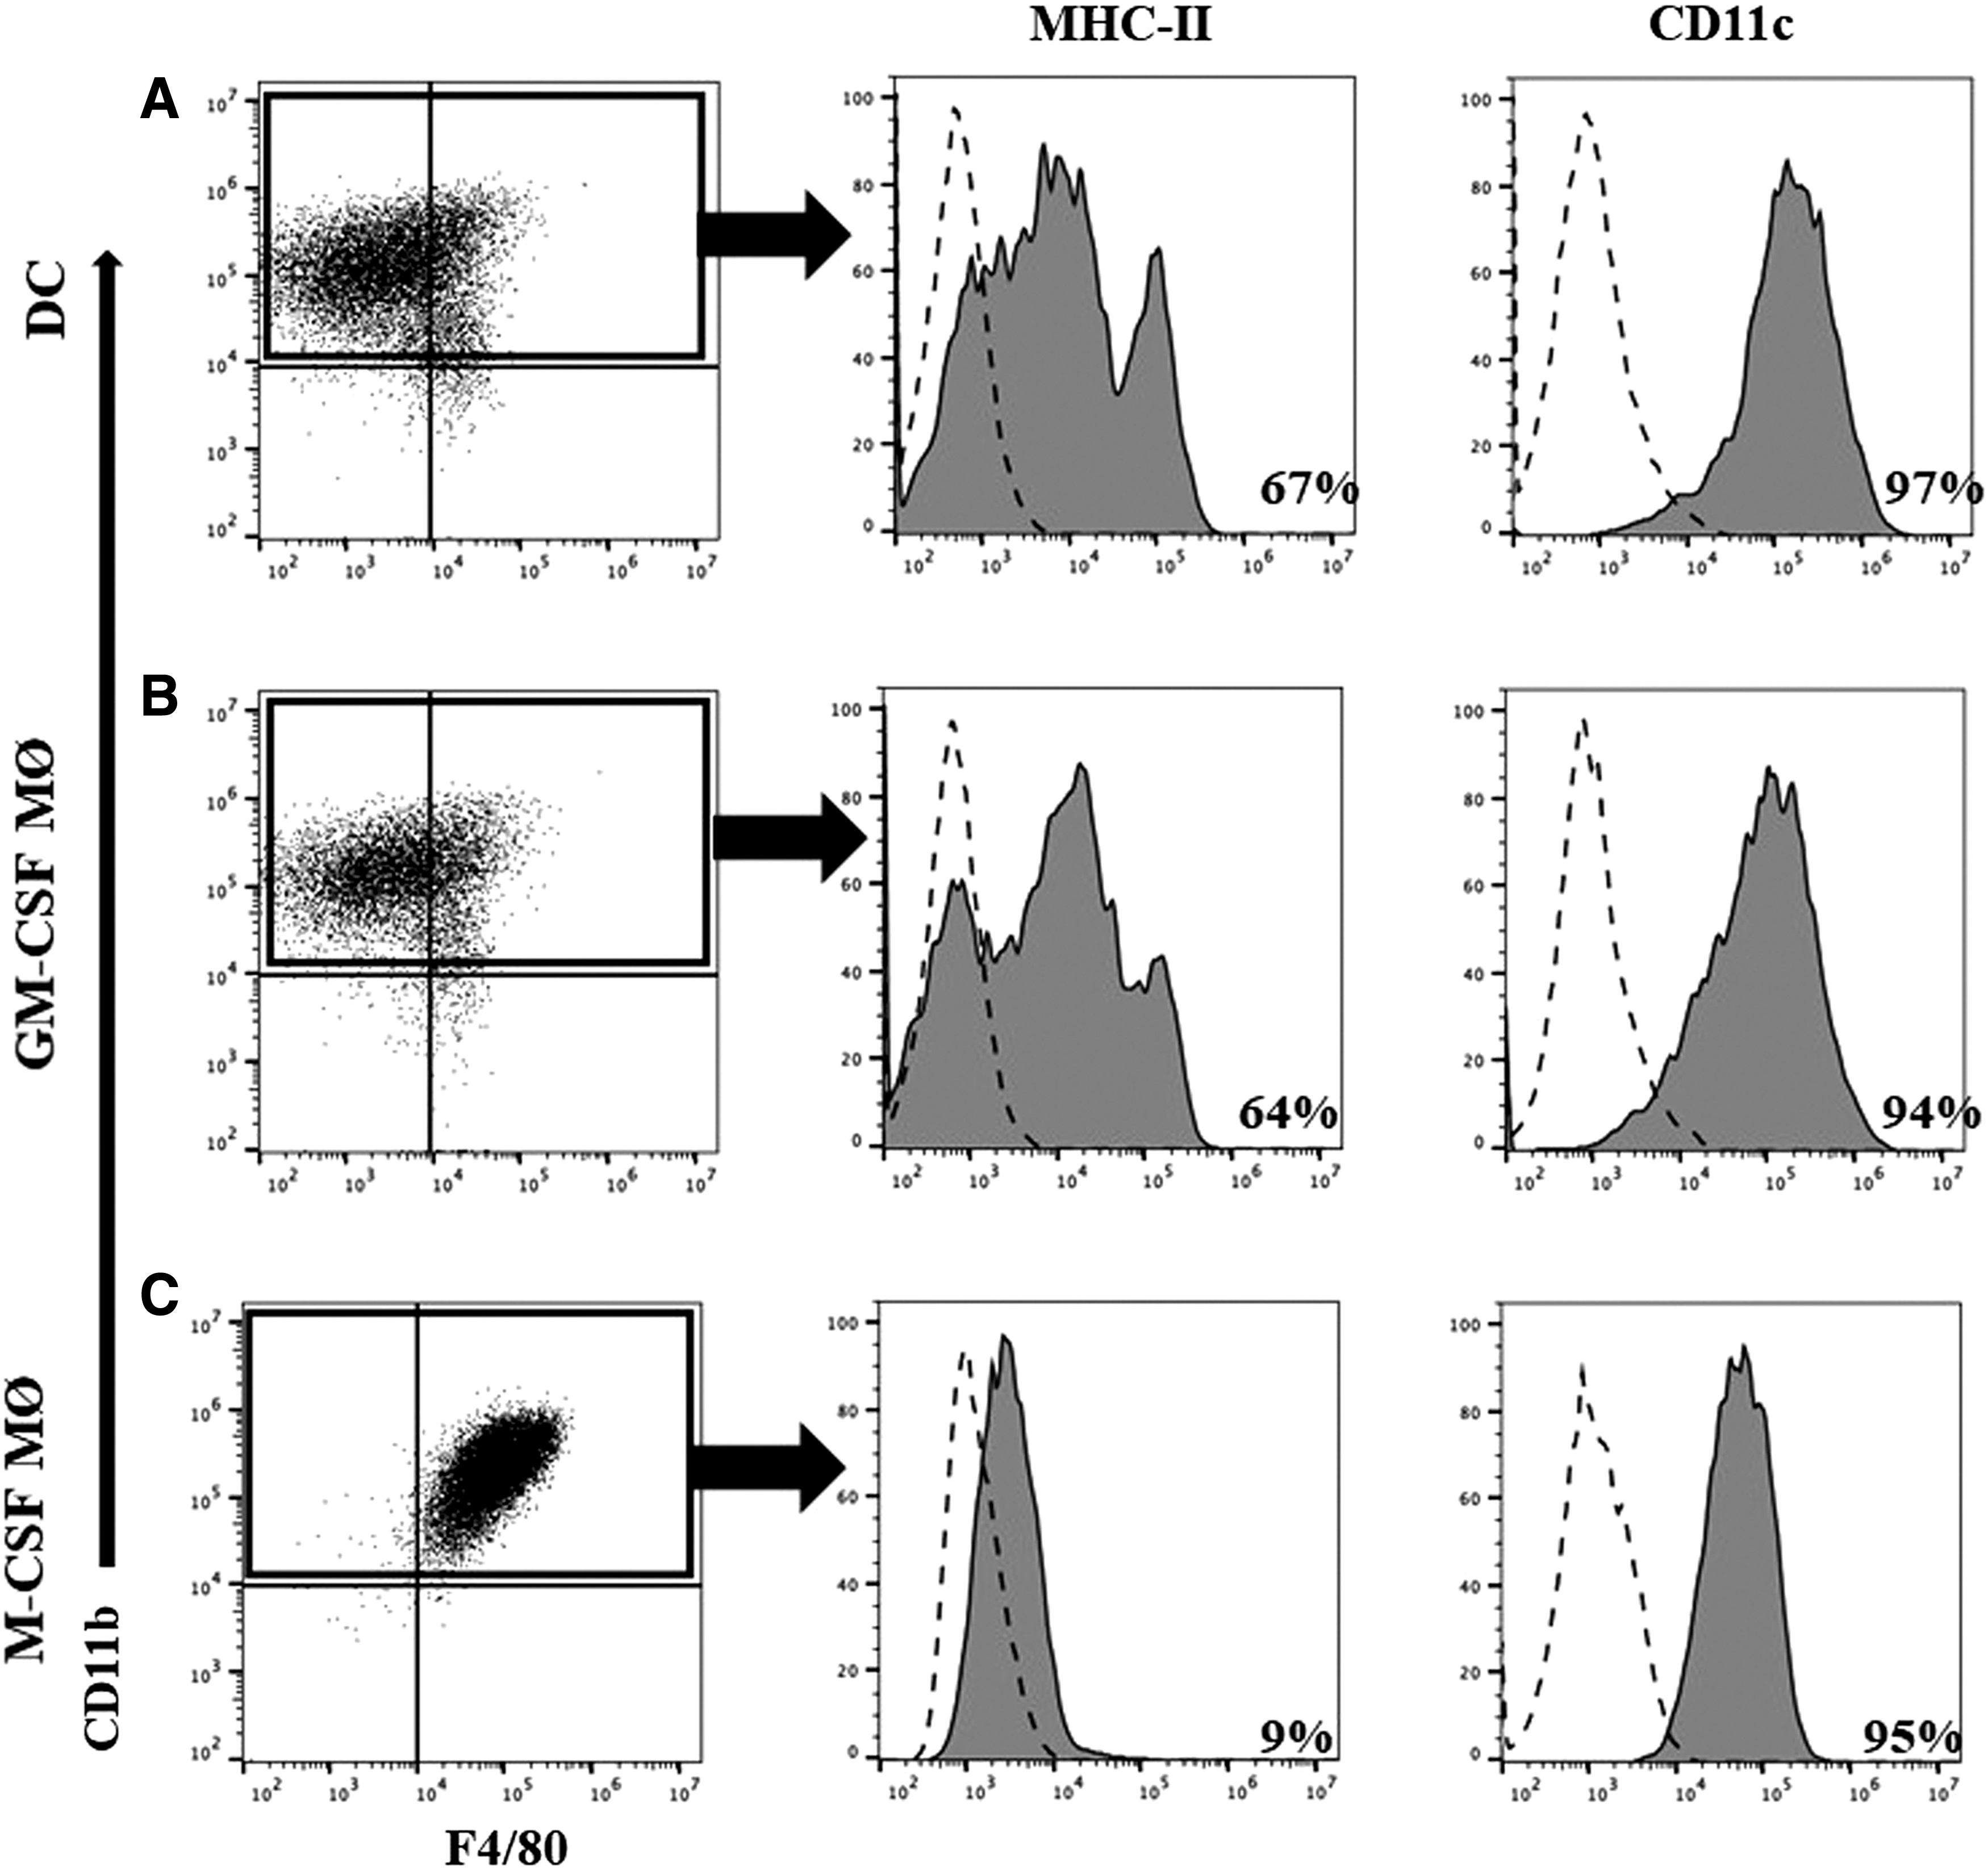
Flow cytometry analyses of cell-associated marker expression. BMDCs (DC) and BMDMs (GM-CSF MΦ and M-CSF MΦ) were cultured for 7 days and tested for the expression of CD11b, F4/80, and CD11c, as well as MHC II. Double labeling for the CD11b and F4/80 markers
Moreover, by employing single staining, we confirmed that M-CSF MΦ highly expressed the intracellular MΦ marker CD68 compared with GM-CSF MΦ or DCs (data not shown). These observations highlight the difference between GM-CSF MΦ and M-CSF MΦ regarding cell marker expression and indicate that GM-CSF MΦ share several common phenotypic markers with BMDCs.
Nitric oxide or arginase induction in GM-CSF MΦ or M-CSF MΦ
To test how MΦ differentiated with GM-CSF versus M-CSF relate functionally to either M1 or M2-like cells in the murine model, and we examined nitric oxide production and arginase activity after stimulation. GM-CSF and M-CSF MΦ were harvested on day 7 and cultured in phenol red-free RPMI media containing 5% FCS in the presence of either LPS (1 μg/mL) or IL-4 (20 ng/mL) for an additional 24 h to test for nitric oxide (NO) production employing the Griess assay (53,68) or assayed for urea production to assess arginase activities (8,52).
GM-CSF MΦ produced NO in response to LPS treatment for 24 h (Fig. 2A), indicating that these cells expressed significant levels of inducible nitric oxide synthase (iNOS), a functional marker for M1-like status. On the other hand, M-CSF MΦ did not produce NO following LPS stimulation. Conversely, M-CSF MΦ expressed arginase and produced urea after IL-4 exposure for 24 h compared with GM-CSF MΦ that failed to activate the arginase enzyme, typical of cells committed to the M1-like status (Fig. 2B). Our data confirm and expand on previous publications showing that unlike the M-CSF MΦ cells, GM-CSF MΦ exhibit a proinflammatory M1-like status (25,26,39,49,54,56).

Functional analyses of GM-CSF MΦ versus M-CSF MΦ. In
M-CSF MΦ are more efficient in their phagocytic capacity compared with GM-CSF MΦ
Having examined marker expression on BMDCs, GM-CSF MΦ, and M-CSF MΦ, we next addressed their capacity to phagocytose cellular antigens and debris from the dead cells. To achieve this, we cocultured BMDCs, GM-CSF MΦ, and M-CSF MΦ for 1 h with dead CSFE-labeled HEK cells used as ADCs. The ADC's preparation which we published previously (2), is described in the methods section.
After processing the data with flow cytometry to examine the double-positive cells, one could see from Figure 2C (where we gated on CD11b + ve cells) and Figure 2D (showing M-CSF MΦ as an example) that a significant portion of the CD11b-positive cells, expressed on our three cell populations, were also positive for the CSFE signal (68.6%). This would imply that most of these cells were able to phagocytose the dead HEK cells labeled with CSFE. The negative control showed 2.83% background (data not shown). By gating on the CD11b+ M-CSF MΦ without HEK-CFSE coculture (Fig. 2E), we were able to set the gate to capture the double-positive cells calculated in Figure 2F. The percentage of phagocytic cells was blotted for all three types of cells in Figure 2F. From Figure 2F, one can conclude that M-CSF MΦ exhibited better ability at phagocytosing cellular debris and antigens compared with DCs and GM-CSF MΦ.
GM-CSF MΦ support superior antigen-specific CD8± T cell proliferation than M-CSF MΦ cells
To assess the antigen presentation capacity of GM-CSF MΦ and M-CSF MΦ and their ability to support T cell proliferation, we used LCMV antigen-specific CD3+ CD8+ T cells from LCMV-immunized mice as responder cells and cocultured them with antigen-pulsed MΦ (53). To evaluate the ability of the MΦ to support antigen-specific CD8+ T cell proliferation, we cultured GM-CSF MΦ and M-CSF MΦ for 7 days and pulsed them with the immunodominant peptide GP33–41 (53,68). The MΦ were then cocultured with splenocytes from LCMV-immune WT mice (H-2b) labeled with carboxyfluorescein succinimidyl ester (CFSE) in the presence of IL-2 (10 U/mL). We also used peptide-pulsed BMDCs (3) in the same setting to compare how the diverse antigen-presenting cells can influence CD8+ T cell activation and proliferation.
Our results show that DCs, GM-CSF MΦ, and M-CSF MΦ induced CD8+ T cell proliferation after 5 days of culture (Fig. 2G) to variable degrees. DCs supported the highest levels of proliferation of antigen-specific CD8+ T cells. In contrast, M-CSF MΦ only modestly induced CD8+ T cell proliferation compared with GM-CSF MΦ. This demonstrates that GM-CSF MΦ are more efficient at supporting proliferation of antigen-specific CD8+ T cells than the classical M-CSF MΦ but are still less efficient than DCs.
LCMV infects both GM-CSF MΦ and M-CSF MΦ cells
LCMV is known to infect MΦ such as alveolar and peritoneal MΦ, however LCMV infection of GM-CSF MΦ has not been reported before. Thus, to confirm if both MΦ subtypes are permissive to LCMV infection, we used the recombinant LCMV green fluorescent protein/chloramphenicol acetyltransferase (r3LCMV GFP/CAT) (23) to monitor the infection in M-CSF MΦ (Fig. 3 top panel) and GM-CSF MΦ (Fig. 3 bottom, panel). The cells were infected with either r3LCMV-Cl13-GFP or r3LCMV-ARM-GFP and were analyzed by fluorescence microscopy 48 h postinfection (Fig. 3). We found that both virus strains were able to infect both GM-CSF MΦ and M-CSF MΦ as we detected green fluorescence signals 48 h that were totally absent immediately after infection indicating that replication was needed to detect the GFP signal. We also confirmed these observations with the regular LCMV-Cl13 and ARM strains, after staining for the virus nucleoprotein (data not shown).

Expression of LCMV-GFP in GM-CSF MΦ or M-CSF MΦ detected by immunofluorescence microscopy. Cells were infected with recombinant LCMV (Cl13 or ARM) green fluorescent protein/chloramphenicol acetyltransferase (r3LCMV GFP/CAT) and cultured for 48 h at 37°C at a density of 2 × 10⁵/well onto 12 mm circular sterile glass cover slips already placed in a 24-well plate. GFP expression was accumulated in the infected cells during 48 h and analyzed by fluorescence microscopy.
Evaluating the cytokine production in response to virus infection
To assess how GM-CSF MΦ and M-CSF MΦ respond to virus infection, we examined key proinflammatory and anti-inflammatory cytokines critical to modulating downstream immune responses. GM-CSF and M-CSF MΦ were either treated with LPS (1 μg/mL) as a positive control or infected with LCMV-Cl13 or LCMV-ARM. Cells were collected 6 and 24 h posttreatment and cytokine expression was analyzed by ELISA in cell-free supernatants. Initially, we measured IL-12p70 and IL-23 production from the MΦ as these cytokines are important in the regulation of T helper cell differentiation. In response to LPS, GM-CSF MΦ produced both IL-12p70 and IL-23 with IL-12p70 increasing at 24 h (Fig. 4A); and IL-23 peaking at 6 h and decreasing at 24 h (Fig. 4B), indicating the proinflammatory nature of the GM-CSF MΦ in agreement with a previous study (26). However, in GM-CSF MΦ, both strains of LCMV failed to induce IL-12p70 or IL-23. Interestingly, M-CSF MΦ did not produce IL-12p70 or IL-23 under any condition. These results led us to further characterize other cytokine responses of the MΦ in response to virus infection.
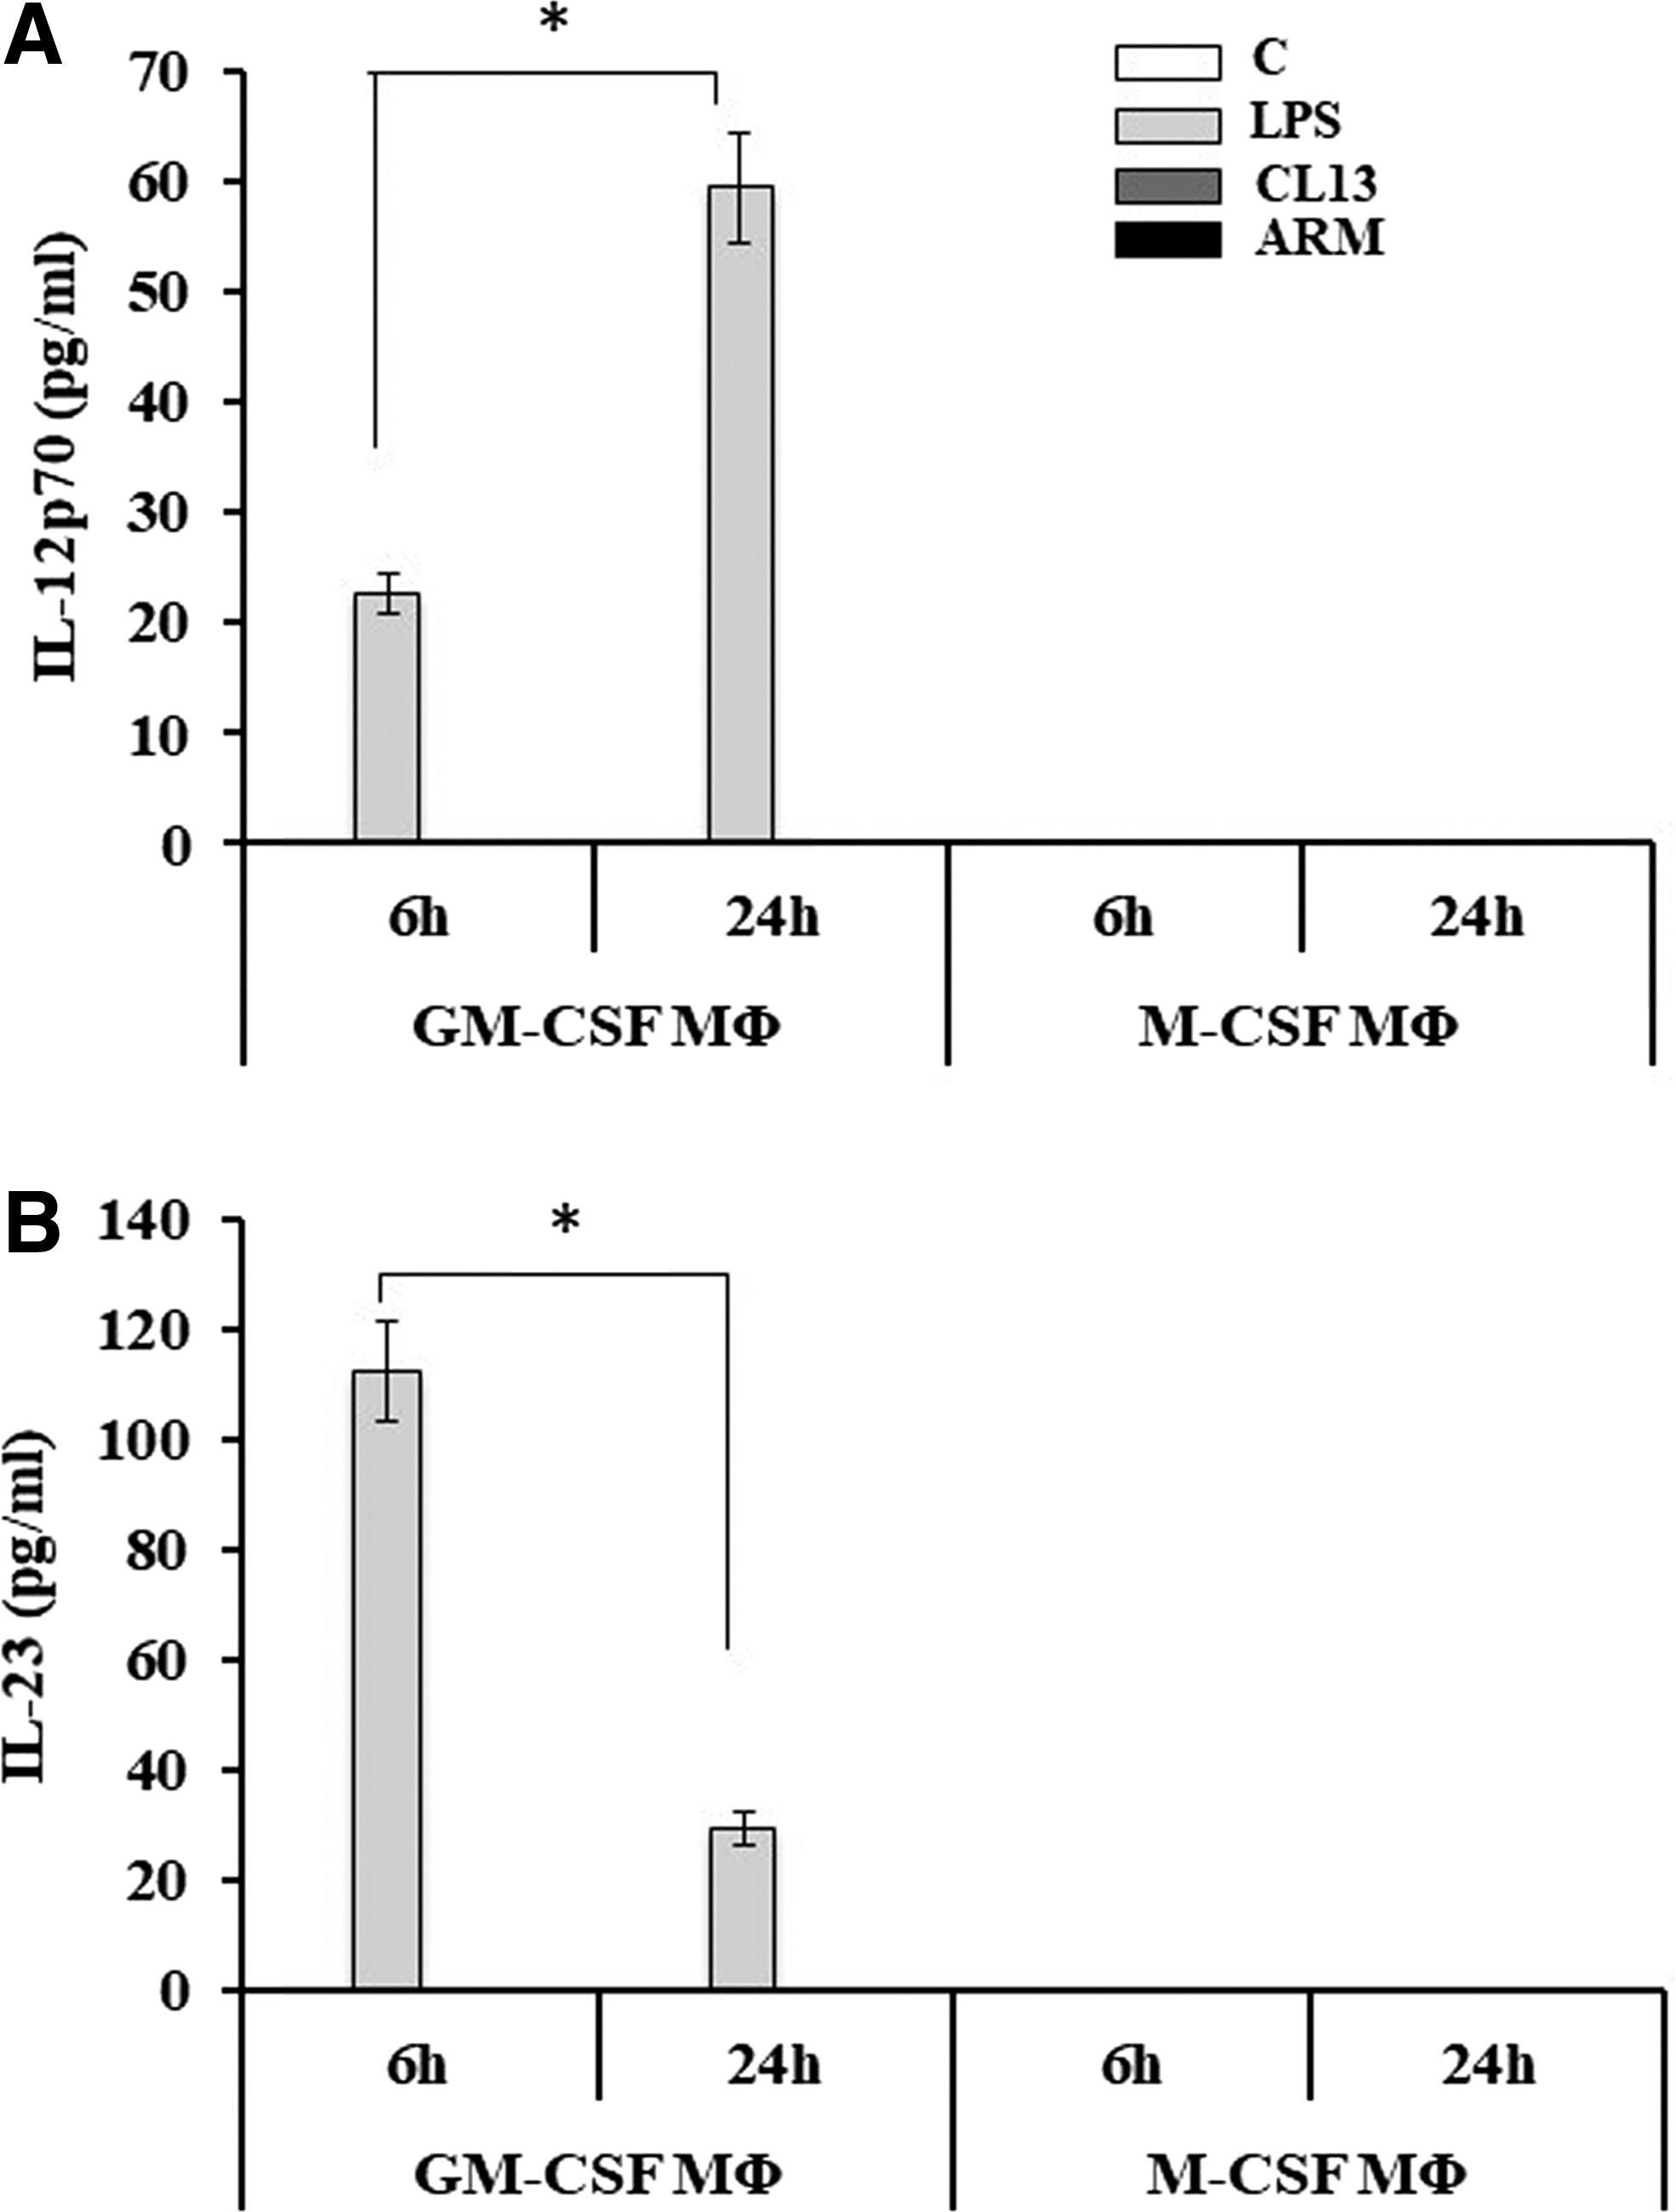
LCMV infection fails to induce IL-12p70 and IL-23 in GM-CSF MΦ or M-CSF MΦ. GM-CSF MΦ and M-CSF MΦ were either left unstimulated/uninfected, stimulated with LPS (1 μg/mL) or infected with LCMV-Cl13 or -ARM with MOI = 3 for 6 and 24 h. GM-CSF and M-CSF cell-free supernatants were collected for the measurement of IL-12p70 and IL-23 by ELISA. The results are shown as mean IL-12p70 or IL-23 in pg/mL. Data shown in
We next evaluated the production and secretion of three other key cytokines: IL-6 (Fig. 5A, B), TNF-α (Fig. 5C, D.), and IL-10 (Fig. 5E, F) in GM-CSF and M-CSF MΦ after LPS stimulation or LCMV infection. In response to LPS, GM-CSF MΦ produced slightly higher levels of IL-6 than M-CSF MΦ at 6 h post LPS stimulation (Fig. 5A) similar to that reported by other groups (26). However, by 24 h, both cell types exhibited comparable IL-6 levels. We also observed a two-fold change increase with time from (6 to 24 h) in the accumulation of IL-6 in both GM-CSF and M-CSF MΦ (Fig. 5A). Additionally, LPS-treated GM-CSF MΦ induced significantly more TNF-α than M-CSF MΦ at both time points with both cell types exhibiting a decline in TNF-α production at 24 h (Fig. 5C), in agreement with previously published work (26). In contrast, M-CSF MΦ produced higher levels of IL-10 than GM-CSF MΦ after 6 h of LPS stimulation (Fig. 5E) (26). At 24 h, while GM-CSF continued to increase production of IL-10, M-CSF MΦ exhibited a decline in IL-10 production.
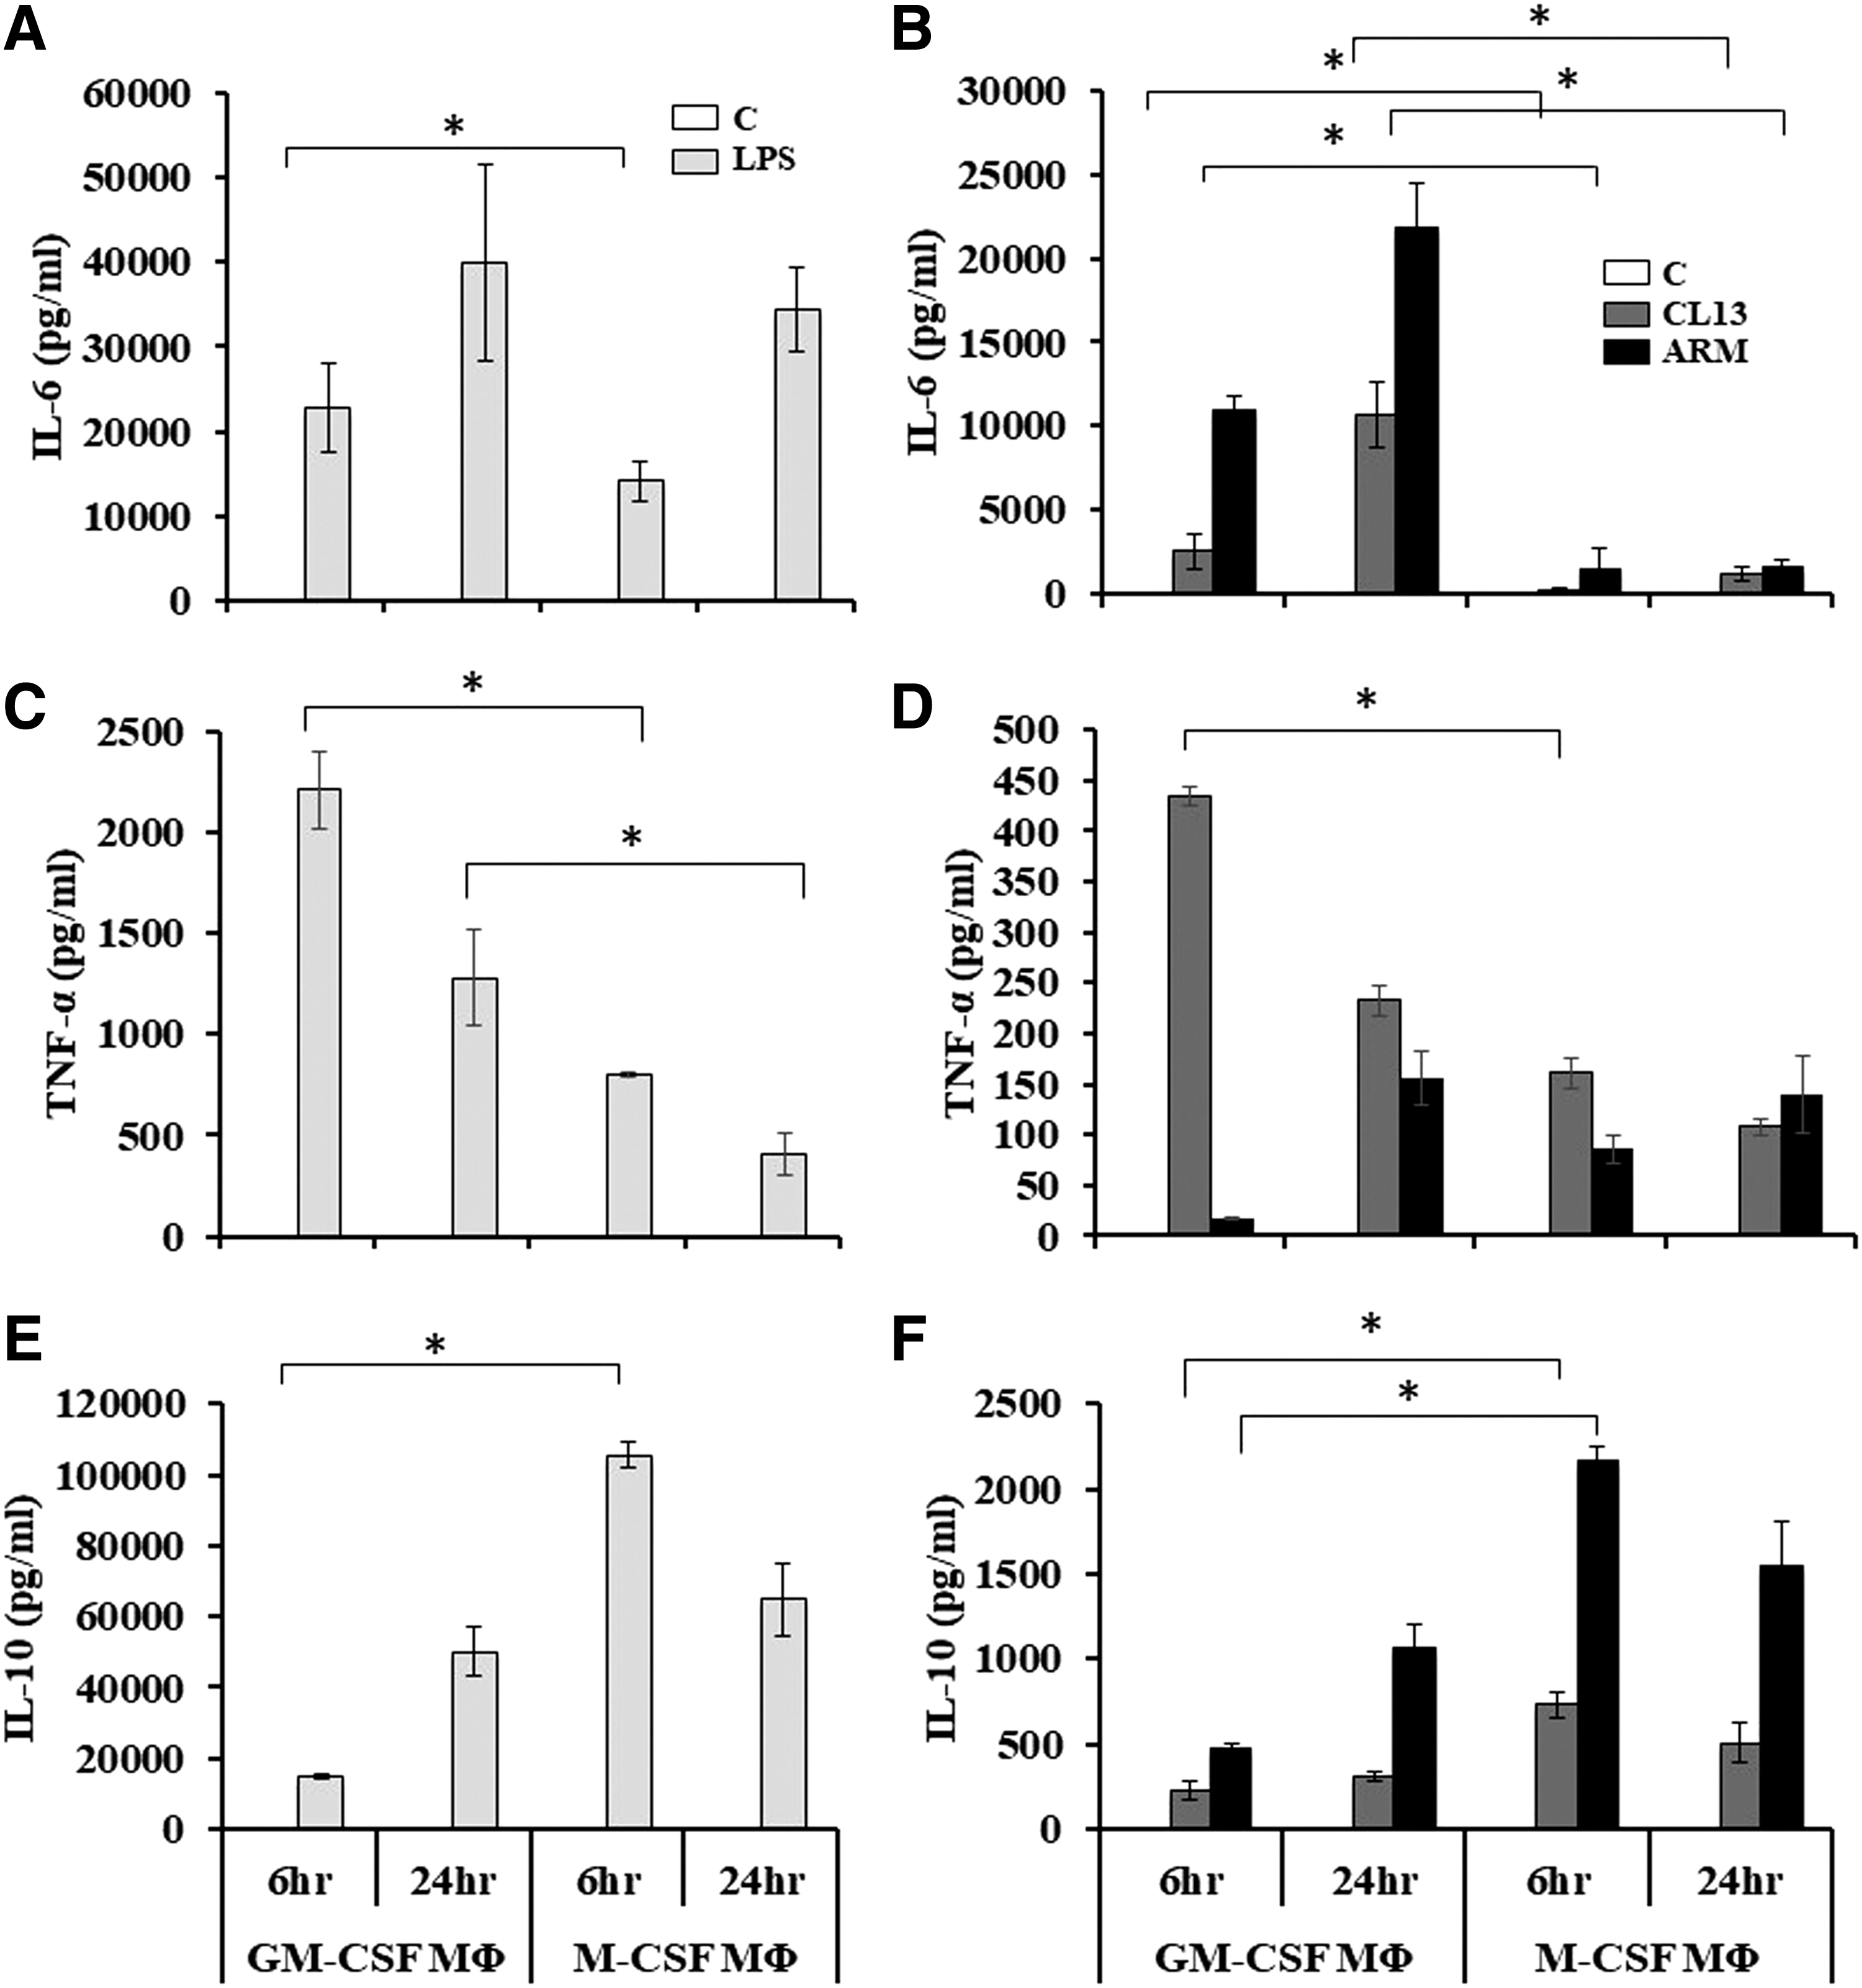
LCMV infection induced more proinflammatory cytokine expression in GM-CSF MΦ compared with M-CSF MΦ. BMDM cells generated in GM-CSF or M-CSF and treated or infected and then the cell supernatants were collected as described. The supernatants were used to measure the production of IL-6, TNF-α, and IL-10 by ELISA. Data in
In response to infection with LCMV-ARM (Fig. 5B), we observed that GM-CSF MΦ produced higher levels of IL-6 at each time point than when they were infected with LCMV-Cl13. Following LCMV-Cl13 infection, GM-CSF MΦ produced significantly more TNF-α after 6 h compared with M-CSF MΦ (Fig. 5D). The TNF-α production was decreased at 24 h postinfection. In contrast, LCMV-ARM infection caused more TNF-α production over time with GM-CSF MΦ only.
It is important to note that in comparison to uninfected control cells, TNF-α production was detected in M-CSF MΦ at both time points postinfection. Interestingly, LCMV infection of MΦ induced modest levels of IL-10 in GM-CSF MΦ (Fig. 5F). On the other hand, in M-CSF MΦ, LCMV-ARM induced a robust IL-10 response that was significantly greater than in GM-CSF cells (Fig. 5F). Taken together, these results demonstrate that GM-CSF and M-CSF MΦ produce differential levels of proinflammatory cytokines IL-6 and TNF-α in response to LCMV infection and that these levels exhibit a reciprocal relationship with IL-10 production.
Discussion
MΦ are known to play a crucial role in infections especially in mice lacking DCs (ΔDC), where they are able to regulate the immune response against LCMV infection (33), and stimulate CD8+ T cells (11). They also have the ability to polarize into a spectrum of phenotypes depending on their cytokine environment (19,25,26,52,53).
MΦ generated from bone marrow in the presence of GM-CSF or M-CSF secrete proinflammatory or anti-inflammatory cytokines following LPS stimulation, respectively (7,26,29,39). Unlike the well-characterized M-CSF-cultured MΦ, the GM-CSF MΦ appear to assume a phenotype that is geared toward M1 MΦ (7,26,29,49,54). However, some reports have shown that such cells are not always exhibiting this M1 characteristics, but do exhibit certain features similar to those associated with M2 cells (17,76), which demands for greater characterization of these GM-CSF MΦ to better define their roles and functions in host immunity (30). Along those lines of evidence, a recent study examining lipid mediator's synthesis by these two cell types reported that GM-CSF and M-CSF MΦ displayed similar profiles in resting conditions but differed significantly after bacterial stimuli (46).
Moreover, a number of reviews have highlighted the potential that GM-CSF can play in inflammatory diseases (10,29,30) since it may act in a positive feedback loop pathway through its actions on myeloid cells in vivo. Thus, this important inflammatory role makes it an ideal cytokine to target to reduce inflammation in those diseases (75). In this report, we characterized GM-CSF MΦ alongside M-CSF- MΦ with regard to cell-associated marker expression, functional assays, and cytokine production in response to two different LCMV strains in vitro.
In this study, we expanded on previous work in this field and defined the phenotypic and functional features of GM-CSF MΦ and M-CSF MΦ, as well as the cytokine profiles in response to LCMV infection. Moreover, we demonstrated that GM-CSF MΦ are quite efficient in their ability to support the proliferation of antigen-specific CD8+ T cells compared with the classical M-CSF MΦ.
When we compared the MΦ types, we found that LCMV infection caused the production a diverse pattern of cytokines but failed to induce IL-12p70 and IL-23. There were also differences in how the cells responded to the two related viral strains, with LCMV-ARM, preferentially inducing high IL-6 and IL-10 in GM-CSF MΦ and M-CSF MΦ respectively. Whereas, LCMV-Cl13 caused GM-CSF MΦ to produce more TNF-α compared with M-CSF MΦ.
By examining markers that are commonly associated with myeloid cells, we found that the CD11b surface marker was highly expressed on DC and GM-CSF MΦ, which agrees with a recent study that compared CD11b expression on bone marrow cells cultured in GM-CSF (56). In contrast, F4/80 was expressed at low levels in both GM-CSF MΦ and DCs, but was highly expressed on M-CSF MΦ, which agrees with other reports (26,32,56) and thus M-CSF MΦ were double positive for the above markers.
In addition to DCs expressing high levels of CD11c, diverse MΦ populations, in particular GM-CSF-derived MΦ have been reported to also express the CD11c molecule (2,32,43,56), which is similar to what we found. Moreover, we showed that expression levels of CD11c were clearly higher on GM-CSF MΦ compared with M-CSF MΦ. It is important to note that the expression of CD11c by certain MΦ populations, monocytes, and activated T cells has been established by various groups (27,44,51,62,71), and is therefore no longer considered as a single unique marker to define DCs (32). With regard to GM-CSF MΦ, a recent report classified them into two populations; CD11c+CD11bhiMHCIIlo and CD11c+CD11bintMHCIIint, with both populations showing active inflammasomes upon stimulation with LPS (24), which attest to their role as proinflammatory MΦ that closely resemble M1 MΦ.
Similar to early reports, we observed that M-CSF MΦ exhibited very low MHCII constitutive expression, whereas GM-CSF MΦ expressed it at a higher level (2,21,45,72). Although MHCII are expressed at very low levels by M-CSF MΦ (2,52), they can be upregulated in response to IFN-γ and LPS treatment such as when the cells become polarized into an M1 phenotype (8,52).
Considering the intracellular CD68 marker, which plays a role in key endosomal functions such as antigen processing (35), we found it expressed by both types of cells, with GM-CSF MΦ exhibiting lower CD68 expression, which is not surprising seeing that CD68 expression can vary in different MΦ populations (57,80). Therefore, from our analyses we demonstrate that the two CSF cytokines cause the MΦ to express distinct marker profiles, with GM-CSF MΦ exhibiting a unique phenotypic profile that is distinguishable from DCs as well as M-CSF MΦ.
Our study also demonstrated that MΦ cultured in GM-CSF for 7 days can produce NO upon LPS stimulation, which is an important functional parameter indicating an M1-biased phenotype. This finding extends on those reporting on how GM-CSF can prime BMDM previously differentiated in M-CSF to induce NO production after 24 h stimulation in LPS (57,70). We have reported previously that in response to LCMV infection, the M1 marker iNOS is detected in spleen-derived MΦ (52). It is also interesting that in contrast to GM-CSF MΦ, we found that in response to IL-4 stimulation, M-CSF MΦ increased Arg-1 activity, which is easily induced in alternatively activated MΦ (21).
In response to LPS, the pro-inflammatory cytokines IL-6, IL-12, IL-23 and TNF-α are produced by M1 MΦ including GM-CSF MΦ (7,26,67,74). Since our data, along with others, point to GM-CSF MΦ being biased toward an M1 activation state, we evaluated how they respond to virus infection. We initially confirmed that LCMV was able to infect both GM-CSF MΦ and M-CSF MΦ before analyzing the cytokines induced in both cell types as a result of the infection.
In our hands, LPS stimulation induced IL-12p70 and IL-23 in GM-CSF MΦ but not in M-CSF MΦ as expected (26), but we found that LCMV did not induce these cytokines in either cell types. It has been reported that splenic leukocytes failed to produce IL-12 after infection with LCMV-ARM (61), so we anticipated this result, but unpredictably, this was what we also found with the GM-CSF MΦ in response to the infection. It is interesting that IL-12p70 and IL-23 are not produced in vitro in response to LCMV infection even though GM-CSF MΦ can express these two proinflammatory cytokines in response to LPS stimulation. IL-12p70 and IL-23 are important in terms of downstream T cell responses because IL-12p70 promotes Th1 differentiation from naive CD4 T cells, and IL-23 enhances Th17 activation (12,40,73).
After LPS stimulation, IL-10 production was more robust by M-CSF MΦ than GM-CSF MΦ, whereas IL-6 was the opposite scenario, confirming previous data (26). We also confirmed that TNF-α is induced more in response to LPS stimulation by GM-CSF MΦ compared with M-CSF MΦ (26). When we examined the above cytokines after infection with LCMV, we found that IL-6 and IL-10 were induced at higher levels in response to LCMV-ARM by GM-CSF MΦ and M-CSF MΦ, respectively. Interestingly, LCMV-Cl13 and -ARM infection promoted GM-CSF MΦ to induce high levels of IL-6 than M-CSF MΦ did. While in vitro data focus on MΦ, it has been shown in vivo that serum from LCMV-ARM-infected mice contained higher levels of IL-6 than LCMV-Cl13 early after infection (31). This may explain why we found significantly elevated IL-6 produced by GM-CSF MΦ in response to LCMV-ARM if LCMV infection can induce M1 activation in mice early after infection (52).
Following LCMV-ARM infection, M-CSF MΦ were the better producers of IL-10, and while LCMV-Cl13 also induced IL-10 in both GM-CSF MΦ and M-CSF MΦ, the amount was lower compared with LCMV-ARM infection. In vivo, it has been demonstrated (77) that IL-10 was detectable in the plasma at higher levels following LCMV-Cl13 infection compared with LCMV-ARM, but this could be due to the contributions of other cell types such as DCs (6,58).
Since LCMV is known to induce TNF-α production in vivo (18), we investigated how the two cell types respond to the infection. We demonstrated for the first time that LCMV-Cl13 induced more TNF-α by GM-CSF MΦ than M-CSF MΦ. Recent studies have shown that both LCMV-Cl13 and -ARM infections in vivo were associated with inflammation characterized by production of proinflammatory cytokines, such as IL-6 and TNF-α detected within 24 h p.i. (18,31). Most likely as a result of LCMV infection, newly developed M1Φ (52), are the key producers of these proinflammatory cytokines. This fits nicely with our observation in this work where LCMV infection of GM-CSF MΦ are responsible for increased proinflammatory cytokine expression.
Since MΦ are important cells in linking innate to adaptive immunity, we also examined the capability of DCs, GM-CSF MΦ, and M-CSF MΦ to support the proliferation of antigen-specific CD8+ T cells. We found that DCs can support antigen-specific CD8+ T cells proliferation more than GM-CSF MΦ, whereas M-CSF MΦ exhibited the lowest accessory capability. This novel finding is supporting the conclusions from the mixed lymphocytic reactions (MLRs) data, which were not antigen specific (56). In that study, they compared DCs, GM-CSF MΦ, and M-CSF MΦ in the nonspecific stimulation MLR test (56) and found that GM-CSF MΦ were better than M-CSF MΦ in inducing MLR activation.
Collectively, our study shows for the first time that GM-CSF MΦ responds to LCMV-ARM infection by inducing a stronger proinflammatory cytokine response than M-CSF MΦ. While the opposite was true with regard to the anti-inflammatory cytokine IL-10, indicating that these MΦ subsets have signature cytokines in response to virus infection, it may regulate adaptive immunity eventually to different outcomes. Thus, the balance of these cytokines after infection could be critical and clearing infection or when being employed in cytokine immunotherapy (15,47).
Footnotes
Acknowledgments
The LCMV-GFP strains were originally prepared in the laboratory of Dr. de La Torre at the Scripps Research Institute, La Jolla, USA, and kindly provided by Dr. Watts' group at the University of Toronto, Canada.
Author Disclosure Statement
No competing financial interests exist.
Funding Information
This work was supported by grants from the National Sciences and Engineering Research Council of Canada (NSERC) to S.B. and K.G. R.M. received Dr. Robert Wilson Fellowship and K.S. was awarded the Ontario Graduate Scholarship. T.A. is supported by the Ministry of Higher Education, Saudi Arabia.