
Abstract
We aimed to characterize the contribution of hepatitis E virus (HEV) in perpetuating the cytokine-mediated inflammatory setting related to liver damage in the context of obesity. Herein, serum samples from patients with liver disease were retrospectively analyzed and categorized as normal-weight patients (NW), overweight patients (OW), obese patients (ObP), and high alcohol consumer patients (HAC), and biochemical, anthropometrical, and transient elastography measurements were obtained. The positivity for immunoglobulin M (IgM) and immunoglobulin G (IgG) anti-HEV antibodies in samples was determined by enzyme-linked immunosorbent assay. Available samples from ObP were tested by reverse transcription–nested polymerase chain reaction for the presence of HEV-RNA. Cytokine profile in the serum of ObP was identified using a multiplexed immune assay. Globally, the highest frequency of IgG anti-HEV was found in ObP (57.5%), followed by HAC (20%), OW (15%), and NW (7.5%). A strong association between HEV serology and obesity was found (odds ratio = 4.21, confidence interval = 1.91.9.27) with a cutoff of 29.3 kg/m2 (area under curve [AUC] = 0–66; p = 0.003) and, a 23.7% of available samples of ObP provided amplification of HEV genome. Cytokine analysis revealed significantly higher levels of proinflammatory cytokines (interleukin [IL]-12, interferon [IFN]-γ, and IL-1β) in IgG anti-HEV-positive ObP than in IgG anti-HEV-negative ObP. Moreover, a high proportion of patients with positive serology showed advanced liver damage. In conclusion, the high percentage of anti-HEV antibodies and viral RNA detection in the setting of an excess of fat, along with an associated proinflammatory cytokine profile found in IgG anti-HEV-positive ObP with more severe liver disease, support an interplay between HEV and obesity.
Introduction
Obesity is defined as an excessive or abnormal accumulation of fat. This condition is considered a 21st century epidemic, with a prevalence of 1.9 billion cases worldwide (42).
Obesity is intimately related to chronic, low-grade inflammation generated by pathologic adipose tissue (30). Accumulating evidence suggests that obesity-associated inflammation is a risk factor for other chronic diseases, including nonalcoholic fatty liver disease (NAFLD), which in turn predisposes individuals to nonalcoholic steatohepatitis (NASH) and liver fibrosis (32).
In normal physiological conditions, adipose tissue is characterized by the presence of resident immune cells that operate in a T helper (Th) 2 state with a predominant concentration of interleukin (IL)-4, IL-33, IL-10, and IL-13 (1,23). In contrast, excessive accumulation of free fatty acids or pathologic antigen-triggered inflammation is characterized by the release of a large amount of proinflammatory cytokines, such as tumor necrosis factor alfa (TNF-α) and IL-1β (22). Moreover, CD4+ T cells are also activated in adipose tissue during inflammatory processes (30).
Antigen-presenting cells have been demonstrated to be able to activate the Th1 phenotype in CD4+ T cells (10,43), promoting increased levels of interferon (IFN)-γ and IL-12 (31,39). These cytokines and IL-17F, produced mainly by Th17 cells, are related to the development of chronic inflammatory disease (8,13). Furthermore, the inability of adipose tissue to store energy excess induces fat deposition in the liver, releasing proinflammatory cytokines that activate Kupffer cells from the liver into a proinflammatory stage, inducing genes related to de novo lipogenesis, contributing to hepatic steatosis, which is a risk factor for NAFLD and NASH, perpetuating the inflammatory state (22).
Similarly, the liver plays a key role in immune homeostasis. The disruption of cellular homeostasis by inflammation as a consequence of obesity or infectious diseases is a risk factor for liver damage (3). During viral hepatic infection (hepatitis B virus [HBV] or hepatitis C virus [HCV] infections), excess of fat acts synergistically with liver damage progression through chronic inflammation (9). Moreover, during HCV genotype 3 (Gt3) infection, the development of NAFLD is enhanced fivefold in conditions of obesity (26), increasing the concern of liver damage induction in this population, particularly in the setting of secondary viral hepatitis infections.
Hepatitis E virus (HEV) has recently emerged as the leading causative agent of liver disease, with 20 million HEV infections worldwide each year. This virus belongs to the genus Orthohepevirus in the Hepeviridae family and is endemic in many low-income countries, where it is mainly transmitted through the fecal/oral route by contaminated water (14). In addition, HEV is also recognized as an emerging infection in developed regions, where it has been associated with zoonotic transmission by the consumption of raw pig meat (41).
HEV usually causes self-limiting hepatitis, but in immunocompromised patients, the infection may progress to chronic disease, potentially evolving into liver cirrhosis. In this regard, several reports indicate that in the context of alcoholic or viral hepatitis comorbidities, the infection with HEV promotes the promptly advance of liver fibrosis and rapid decompensated cirrhosis (5,21). Nevertheless, it remains unclear whether HEV may influence the risk of progression to chronic liver disease in obese patients (ObP), and we lack conclusive evidence that would allow us to elucidate the immune mechanisms responsible for this process. Herein, we aimed to study the interplay between HEV infection and cytokine secretion in the context of obesity and liver disease.
Methods
Study population
In this study, 136 serum samples from unrelated patients (>16 years of age) with liver disease, determined by clinical history and biochemical markers as previously reported (38) were retrospectively analyzed. Liver disease was considered when clinical findings, including hepatomegaly and jaundice and at least one abnormality in conjugated bilirubin (CB >0.3 mg/dL), gamma-glutamyl transferase (GGT >30 IU/L), aspartate aminotransferase (AST >38 IU/L), and alanine aminotransferase (ALT >35 IU/L) values was found. Moreover, taking into account that alcohol consumption is a major etiology for liver damage, high alcohol consumption (>200 g/week) was retrospectively analyzed in accordance with the fifth edition Diagnostic and Statistical Manual of Mental Disorders for Alcohol Use Disorder (29). In addition, total cholesterol (TC) and triglycerides (TG) values were retrospectively analyzed. Participants were recruited at the Centro de Referencia de Hepatitis Virales del Occidente de Mexico in the Servicio de Biologia Molecular, Hospital Civil de Guadalajara Fray Antonio Alcalde (HCGFAA), Guadalajara, Jalisco, Mexico, between 2011 and 2016. The study was conducted at the Unidad de Inmuno-virologia in the Servicio de Biologia Molecular, HCGFAA. Serum levels of CB, GGT, AST, ALT, TC, and TG were previously measured using routine clinical laboratory procedures by using an Ortho Chemistry System Clinical Vitros Chemistry System (GMI, Ramsey, MN).
All serum samples analyzed were seronegative for hepatitis A virus (HAV), HBV, HCV, and human immunodeficiency virus (HIV), and negative for HBV and HCV viral genomes. None of the participants included in this study had been vaccinated against HAV or HBV, and none was diagnosed with decompensated cirrhosis as defined previously (37). Patients with liver disease who were undergoing treatment with immunosuppressive or anti-inflammatory drugs; hepatotoxic drugs; those with acute or chronic HAV, HBV, HCV, or HIV infections; and those diagnosed with autoimmune hepatitis were excluded from the study.
This study was approved by the Ethics Committee of the HCFAA and the Centro Universitario de Ciencias de la Salud, Universidad de Guadalajara (IRB: CI-00215).
Body mass index analysis
The height of patients was previously determined using a stadiometer (Rochester Clinical Research, New York, NY). The body composition was evaluated by electrical bioimpedance with an InBody 3.0 instrument (Analyzer Body Composition; Biospace, Seoul, Korea), which evaluated body fat, total weight, and body mass index (BMI; kg/m2) as previously reported (34). Using the BMI results, we classified the subjects according to the criteria of the WHO for obesity and overweight as follows: normal-weight patients (NW; 18.5–24.9 kg/m2), overweight patients (OW; 25–29.9 kg/m2), and ObP (>30 kg/m2) (42).
Serological diagnosis of HEV
The serum samples were tested for the presence of immunoglobulin M (IgM) and immunoglobulin G (IgG) anti-HEV antibodies using the commercial Enzyme-Linked Immunosorbent Assay Kit following the manufacturer's instructions (MIKROGEN, Neuried, Germany). The final reading was obtained with a WHYM201 microplate reader (Poweam Medical Co., Ltd., Nanjing, China).
Multiplex immunoassay for serum cytokines
The cytokine profile was determined in serum from 46 ObP (23 samples positive and 23 samples negative for the presence of IgG anti-HEV antibodies) and 5 NW (3 samples positive and 2 samples negative for the presence of IgG anti-HEV antibodies). An 8-plex Kit (IL-1β, IFN-γ, IL-12p70, IL17F, IL-23, IL-13, IL-4, and IL-10) from Merck Millipore (Darmstadt, Germany) for cytokine detection was used. A fraction of serum samples stored at −80°C until the day of the assay was thawed and processed according to the manufacturer's instructions. Briefly, following plate prewetting, interleukin IL-1β, IFN-γ, IL-12p70, IL17F, IL-23, IL-13, IL-4, and IL-10 cytokine beads were combined and then added to the plate. After the plate was washed twice, 25 μL of serum from each patient (diluted 1:2 with the assay buffer) was added to the plate. The plate was incubated overnight at room temperature and then the plate was washed twice. Subsequently, detection antibody was added per well and incubated for 30 min at room temperature. Finally, the plate was washed three times, sheath fluid was added to each well, and precombined beads for each cytokine from the plate were read in a MAGPIX machine driven by xMAP® Luminex Technology. The exponent software EMD (Merck Millipore) was used for analysis. The detected values were expressed as median fluorescence intensity.
Evaluation of liver stiffness
The liver stiffness in patients was previously assessed by transient elastography (FibroScan®; Echosens, Paris, France). Liver fibrosis stages were classified according to the specific cutoff values by each etiology according to the manufacturer's instruction. The cutoff values for patients with liver disease were F0; <5.8 kPa, F1; 5.9–7.0 kPa, F2; 7.1–8.8 kPa, F3; 8.9–11.8 kPa, and F4; >11.9 kPa, and for those patients with high alcohol consumption F0; <5.8 kPa, F1; 5.9–7.8 kPa, F2; 7.9–11.5 kPa, F3; 11.6–19.5 kPa, and F4; >19.6 kPa (34,37).
Nested polymerase chain reaction for HEV RNA detection
RNA was extracted from 300 μL of patient's serum samples using a QIAamp Viral RNA Mini Kit (QIAGEN) following the manufacturer's specifications.
HEV-RNA detection was carried out with a two-step reverse transcription–nested polymerase chain reaction (RT-nPCR) targeting the ORF-1 region (5′ end methyltransferase gene) (40) using 5 μL of purified RNA. The reverse transcription reaction was carried out in a 12 μL reaction mix of 1.75 μM of reverse primer (R: 5′-CCATCRARRCAGTAAGTGCGGTC-3′), 8.5 U of M-MLV RT (Promega), and 870 μM of dNTP mix (Promega). For the first round of amplification of nPCR, a total volume of 20 μL was used. The mix contained 4 μL of the complementary DNA, 250 μM of dNTP mix, 0.25 μM of each primer (F: 5′-CTGGCATYACTACTGCYATTGAGC-3′), and 2.5 U Taq Polymerase. Thirty-five cycles of 94°C for 1 min, 48°C for 45 sec, and 72°C for 1 min, with a final extension of 72°C for 10 min, were used for amplification. For the second round, 2 μL of the first round was used under the same conditions as the first round and 0.25 μM of each primer (F: 5′-CTGCCYTKGCGAATGCTGTGG-3′ and R: 5′-GGCAGWRTACCARCGCTGAACATC-3′). The first-round external primers amplified 418 bp, and the second-round internal primer amplified 287 bp.
Statistical analyses
The description of the categorical (qualitative) variables is represented by frequencies and percentages. A Kolmogorov–Smirnov test was used to evaluate the normal distribution of the data. The continuous (quantitative) variables are summarized using the mean ± standard deviation. Differences between groups were assessed with Student's t-test and analysis of variance for variables normally distributed and with nonparametric tests, Mann–Whitney U and Kruskal–Wallis, for variables not normally distributed. Statistical associations were analyzed by Chi-square and Fisher's test to compare proportions. The results of the previous analysis were used for univariant analyses as appropriate. Receiver operating characteristic (ROC) curve analysis was used to establish the cutoff point that best distinguished the serology result. Spearman analysis was used for statistical correlations. A p-value <0.05 was considered statistically significant. All analyses were performed using the program IBM SPSS statistics, version 24 for Windows (IBM Corp, Inc., Chicago, IL).
Results
Demographic and clinical data of the study population
As shown in Table 1, samples were mostly obtained from male patients. The mean age of patients was 40.88 ± 12.55 years. Based on the criteria mentioned above relative to BMI, globally, the cohort was classified as overweight. In addition, a high percentage of subjects were high alcohol consumer patients (HAC). Even though the mean GGT, ALT, AST, and CB presented values in the normal range, the subjects individually had altered values, indicating liver insult in this cohort. In addition, TC and TG were close to reaching the abnormally increased range supporting metabolic disorders in patients.
Demographic and Biochemical Characteristics of Patients
ALT, alanine aminotransferase; AST, aspartate aminotransferase; BMI, body mass index; CB, conjugated bilirubin; F, female; GGT, gamma-glutamyl transferase; HAC, high alcohol consumer patients; M, male; NW, normal-weight patients; ObP, obese patients; OW, overweight patients; SD, standard deviation; TC, total cholesterol; TG, triglycerides.
Highly frequent IgG anti-HEV antibodies in obese individuals
We previously reported a high HEV seroprevalence (26.5%) in serum samples from cirrhotic patients from west Mexico with no other etiological agent present, suggesting the potential role of HEV in the development of liver damage (28). This piece of information led us to compare the IgM and IgG anti-HEV frequency in serum samples from patients with liver disease. The cohort presented an IgM anti-HEV prevalence of 1.47% (n = 2), and 40 patients (29.4%) presented IgG anti-HEV antibodies (Fig. 1A). These results suggest that either (1) the underlying liver damage represents a risk factor for HEV infection or (2) liver disease might be associated with HEV infection in these patients.
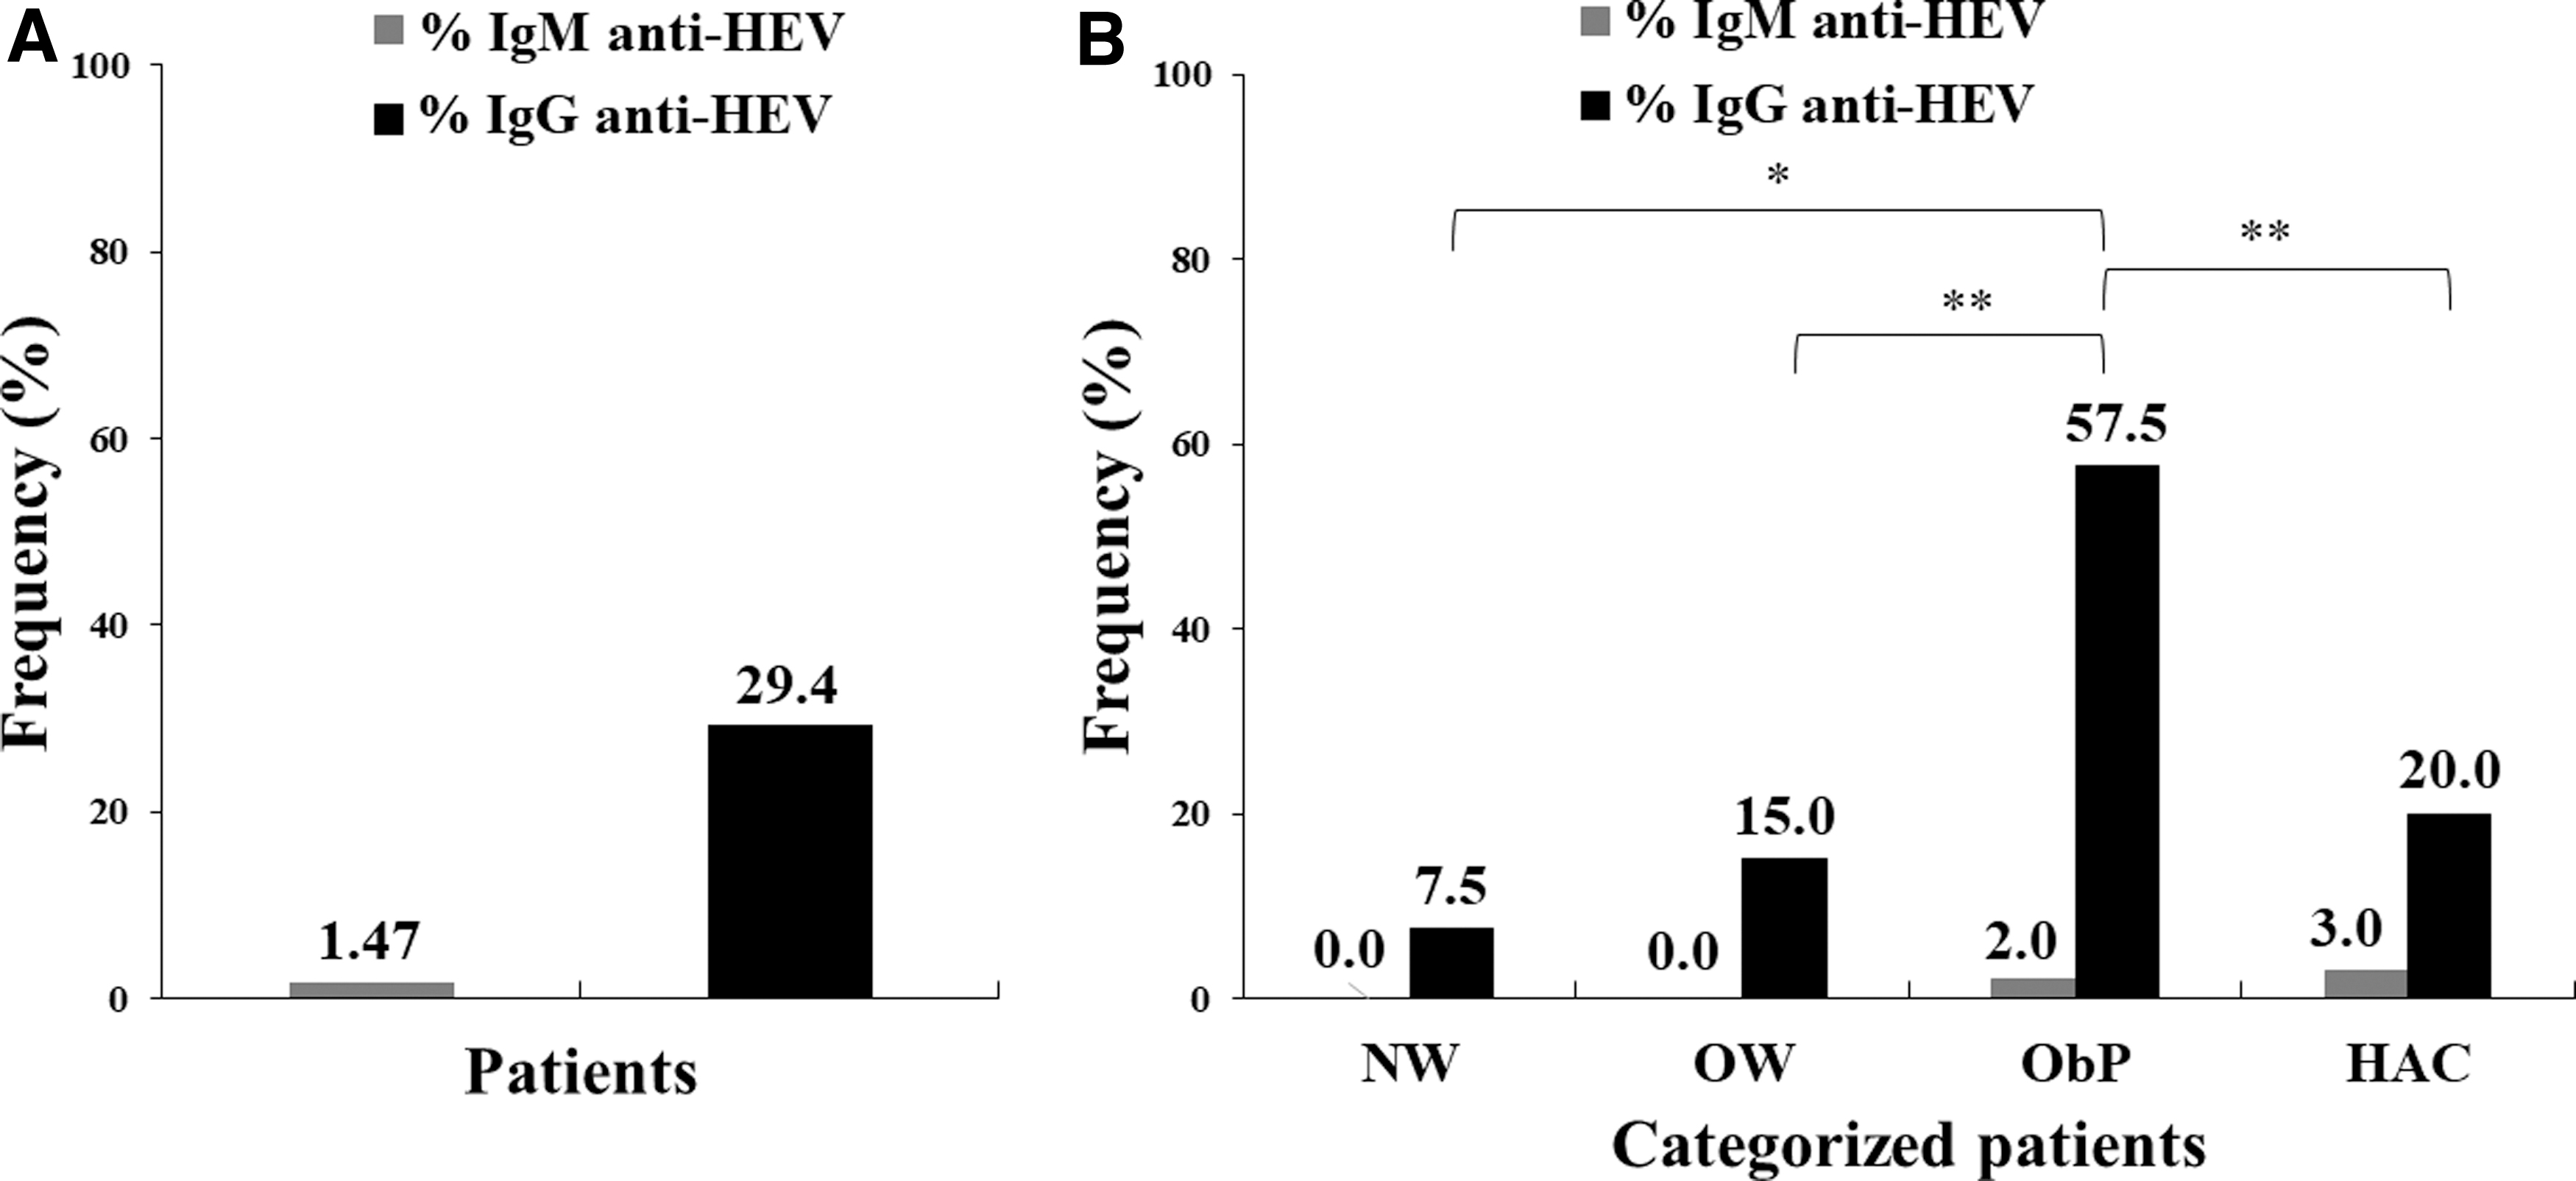
Seroprevalence of anti-HEV antibodies in patients with liver disease.
Data from a previous study by our group revealed an IgG anti-HEV seroprevalence of 17% in individuals with obesity and diabetes mellitus type 2 (28). However, little is known about the role of HEV in the obese state. Given the high incidence of obesity in Mexico (12) and considering that this condition is a recognized risk factor for NAFLD and thus a predisposing factor for NASH, we hypothesized that HEV might play a role in the development of liver disease in conditions of excess of fat. To test this hypothesis, we evaluated IgM and IgG anti-HEV frequencies in patients categorized according to their BMI. In addition, because high alcohol consumption is a major etiology for liver damage (16), the HEV seroprevalence according to alcohol consumption pattern was also analyzed. Of the patient groups examined, ObP showed the highest proportion of IgG reactivity to HEV in the overall analysis, followed by HAC, OW, and NW with 57.5% (n = 23), 20% (n = 8), 15% (n = 6), and 7.5% (n = 3), respectively. Furthermore, when the groups were analyzed independently, ObP exhibited a significantly higher IgG anti-HEV prevalence compared with the patients in the other groups (ObP vs. NW, p = 0.005; ObP vs. OW p = 0.001; ObP vs. HAC, p = 0.005). No significant differences were found among NW, OW, and HAC. ObP and HAC presented only one patient with IgM anti-HEV antibodies (Fig. 1B).
Because of the high seroprevalence of IgG found in ObP, we hypothesized a potential association between obesity and HEV infection. To test this hypothesis, patients were categorized into NW/OW and ObP to estimate the influence of this condition on HEV seropositivity, grouped as IgG anti-HEV negative or positive. The univariant analysis showed that obesity was associated (odds ratio [OR] = 4.21, confidence interval [CI] = 1.91–9.27; p = <0.001) with increased HEV seropositivity. The ROC curve analysis for BMI identified 29.3 kg/m2 (area under curve [AUC] = 0.66; p = 0.003) as the cutoff value that best distinguished IgG anti-HEV positive from negative.
A direct relationship between liver damage and excess fat has been well established. To analyze whether our population follows the same behavior, a comparison of the demographic and biochemical variables among the stages of liver damage was carried out but did not reveal significant differences. Moreover, of 134 patients with available transient elastography data, 68 (50.7%) had no liver fibrosis and 19 (14.2%), 20 (14.9%), 12 (9%), and 15 (11.2%) were in stage F1, F2, F3, and F4, respectively. However, after subcategorization according to BMI and alcohol consumption, the highest proportion of patients with liver damage in the F4 stage was found among HAC (20%), followed by ObP, OW, and NW with 8.9%, 8.8%, and 0%, respectively, but no significant differences were found (data not shown). Likewise, when the biochemical variables were compared according to the subcategorization by BMI and alcohol consumption, we observed that hepatic biomarkers as GGT and ALT were significantly increased in Ob and HAC groups (Table 2); nonetheless, the levels of ALT remain in the limit of the normal ranks and GGT levels were slightly increased.
Demographic and Biochemical Characteristics of Patients According to the Body Mass Index and Alcohol Consumption
Differences between groups were analyzed by Kruskal–Wallis test and Mann–Whitney U-test for post hoc differences with an α = <0.05. Statistically significant values are shown in bold.
NW/OW; bNW/ObP; cNW/HAC; dObP/OW; eOW/HAC; fObP/HAC.
ALT, alanine aminotransferase.
HEV serology correlates with a proinflammatory cytokine profile in ObP
Obesity is a condition that predisposes individuals to a proinflammatory state, promoting an increased risk for liver damage in the presence of a pathogen trigger. To evaluate whether HEV influences the immune inflammatory state during obesity, a cytokine profile evaluation in ObP was performed. Compared with ObP negative for IgG anti-HEV, ObP seropositive for IgG anti-HEV exhibited a different cytokine pattern.
Significantly higher levels of proinflammatory cytokines IL-12, IFN-γ, and IL-1β were found in IgG anti-HEV-positive ObP than in IgG anti-HEV-negative ObP. In contrast, those ObP with negative detection of IgG anti-HEV showed significantly higher levels of cytokines IL-4, IL-10, and IL-13. IL-17F exhibited a trend toward an increase in HEV-positive patients, whereas IL-23 had no significant differences. A trend toward increased levels of IL-12, IFN-γ, and IL-1β was found in NW positive for IgG anti-HEV relative to individuals negative for antibodies (Fig. 2 and Supplementary Table S1).
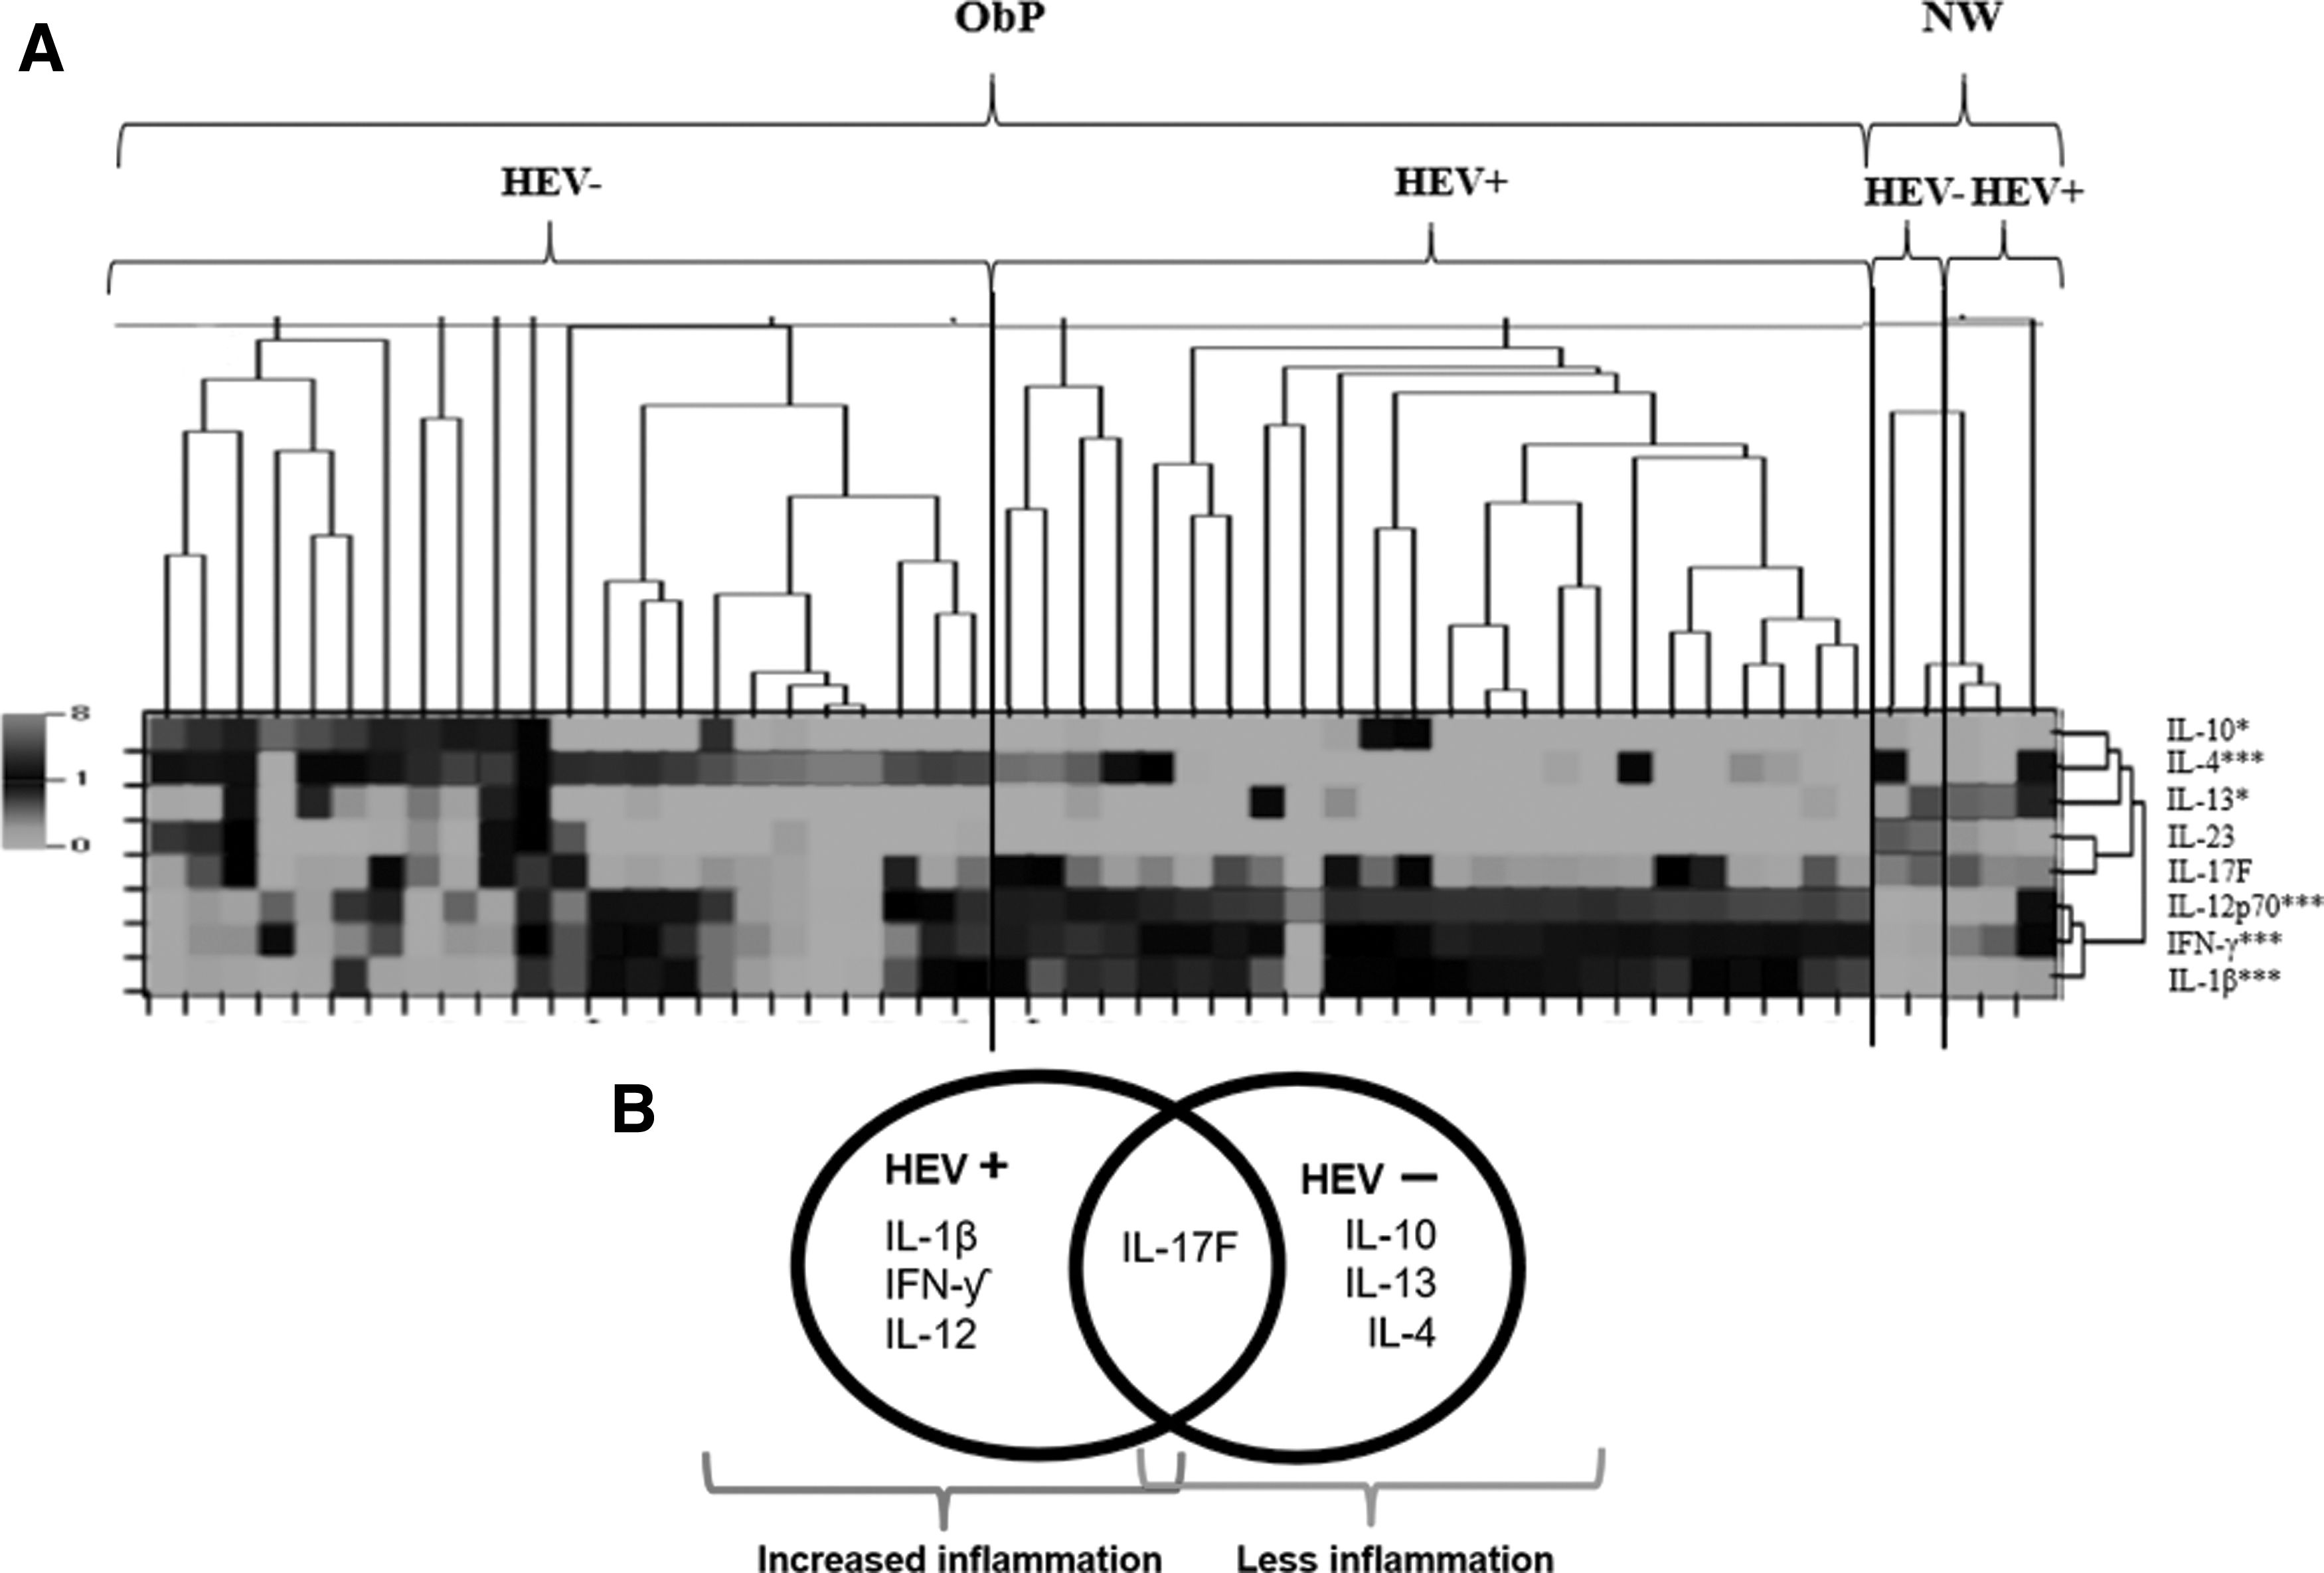
HEV serology was correlated with a proinflammatory cytokine profile in serum.
Because the cytokine profile can differentiate the HEV contact, quantitative correlations between the cytokines and the optical density (OD) for IgG anti-HEV antibodies were analyzed. Positive linear correlations were found between OD values and IL-12, IFN-γ, and IL-1β levels, whereas negative correlations were exhibited with IL-13 and IL-4. However, the R 2 value of the data was low, indicating low linearity. Moreover, when the correlation data of the cytokines from the NW group was evaluated, we observed a positive linear correlation among IL-1β and IFN-γ (Table 3).
Quantitative Correlations Among Cytokines Median Fluorescence Intensity and Optical Density
Spearman analysis was carried out with an α = <0.05. Statistically significant values are shown in bold.
IFN, interferon; IL, interleukin; NS, nonsignificant.
Liver damage in IgG anti-HEV-seropositive patients
To analyze the influence of the IgG seropositivity for HEV in liver damage, a comparison of the liver biomarkers was carried out according to the serology results. The patients positive for IgG anti-HEV were significantly older than those nonreactive (46.08 ± 11.39 vs. 38.71 ± 12.43, p = 0.002). A univariant analysis showed an OR = 1.05 (CI = 1.01–1.09; p = 0.008) for HEV infection and age. Moreover, ROC curve analysis identified 40.5 years (AUC = 0.67; p = 0.002) as the cutoff value that best distinguished IgG anti-HEV positive from negative. It is important to point out that, considering this cutoff value, the BMI did not show significant differences in this cohort (p > 0.2). Additionally, patients who were IgG anti-HEV reactive had increased levels of GGT and AST (40.41 ± 34.53 vs. 30.83 ± 27.60, p = 0.033; 32.63 ± 13.00 vs. 29.52 ± 16.78, p = 0.049), suggesting that patients with IgG anti-HEV antibodies might have a worse liver condition than those without these antibodies. Moreover, the mean comparison of the BMI demonstrated that patients positive for HEV were mostly obese (30.5 ± 4.57 vs. 28.07 ± 4.89, p = 0.003) (Table 4). The demographic and biochemical comparisons between the seroprevalence results according to the BMI and alcohol consumption subcategorization did not show significant differences.
Demographic and Biochemical Characteristics of Patients According to Immunoglobulin G Serology
Differences between groups were analyzed by t-test and Mann–Whitney U-test with an α = <0.05. Statistically significant values are shown in bold.
HEV, hepatitis E virus.
To test if the increase in liver biomarkers was reflected in the fibrosis stage, an analysis of the proportion of IgG anti-HEV-positive samples according to the stage of liver damage is shown in Figure 3A and B. In this study, 52.5% of patients with IgG anti-HEV antibodies had liver damage; similarly, 50% of those with negative results for IgG anti-HEV antibodies had liver damage. Interestingly, HEV contact showed a trend toward an increased proportion of patients in stage F4 liver damage, at a proportion of 15% compared with 9.5% in those with no HEV contact, whereas patients negative for IgG anti-HEV antibodies exhibit a trend toward an increased proportion of patients in stage F3 relative to HEV-positive patients. Moreover, liver damage analysis according to BMI and alcohol consumption showed a higher proportion of those with stage F4 liver damage among IgG anti-HEV-positive patients than among patients overall and those nonreactive for HEV; however, these differences were not statistically significant (Fig. 3C). In addition, statistical associations among risk factors for liver damage and liver fibrosis were not significant (data not shown). Furthermore, screening of the 5′-end ORF-1 region of HEV-RNA in 38 IgG anti-HEV-positive ObP with available serum samples showed that 23.7% (n = 9) were positive for HEV-RNA, which indicates an active HEV infection (data not shown).
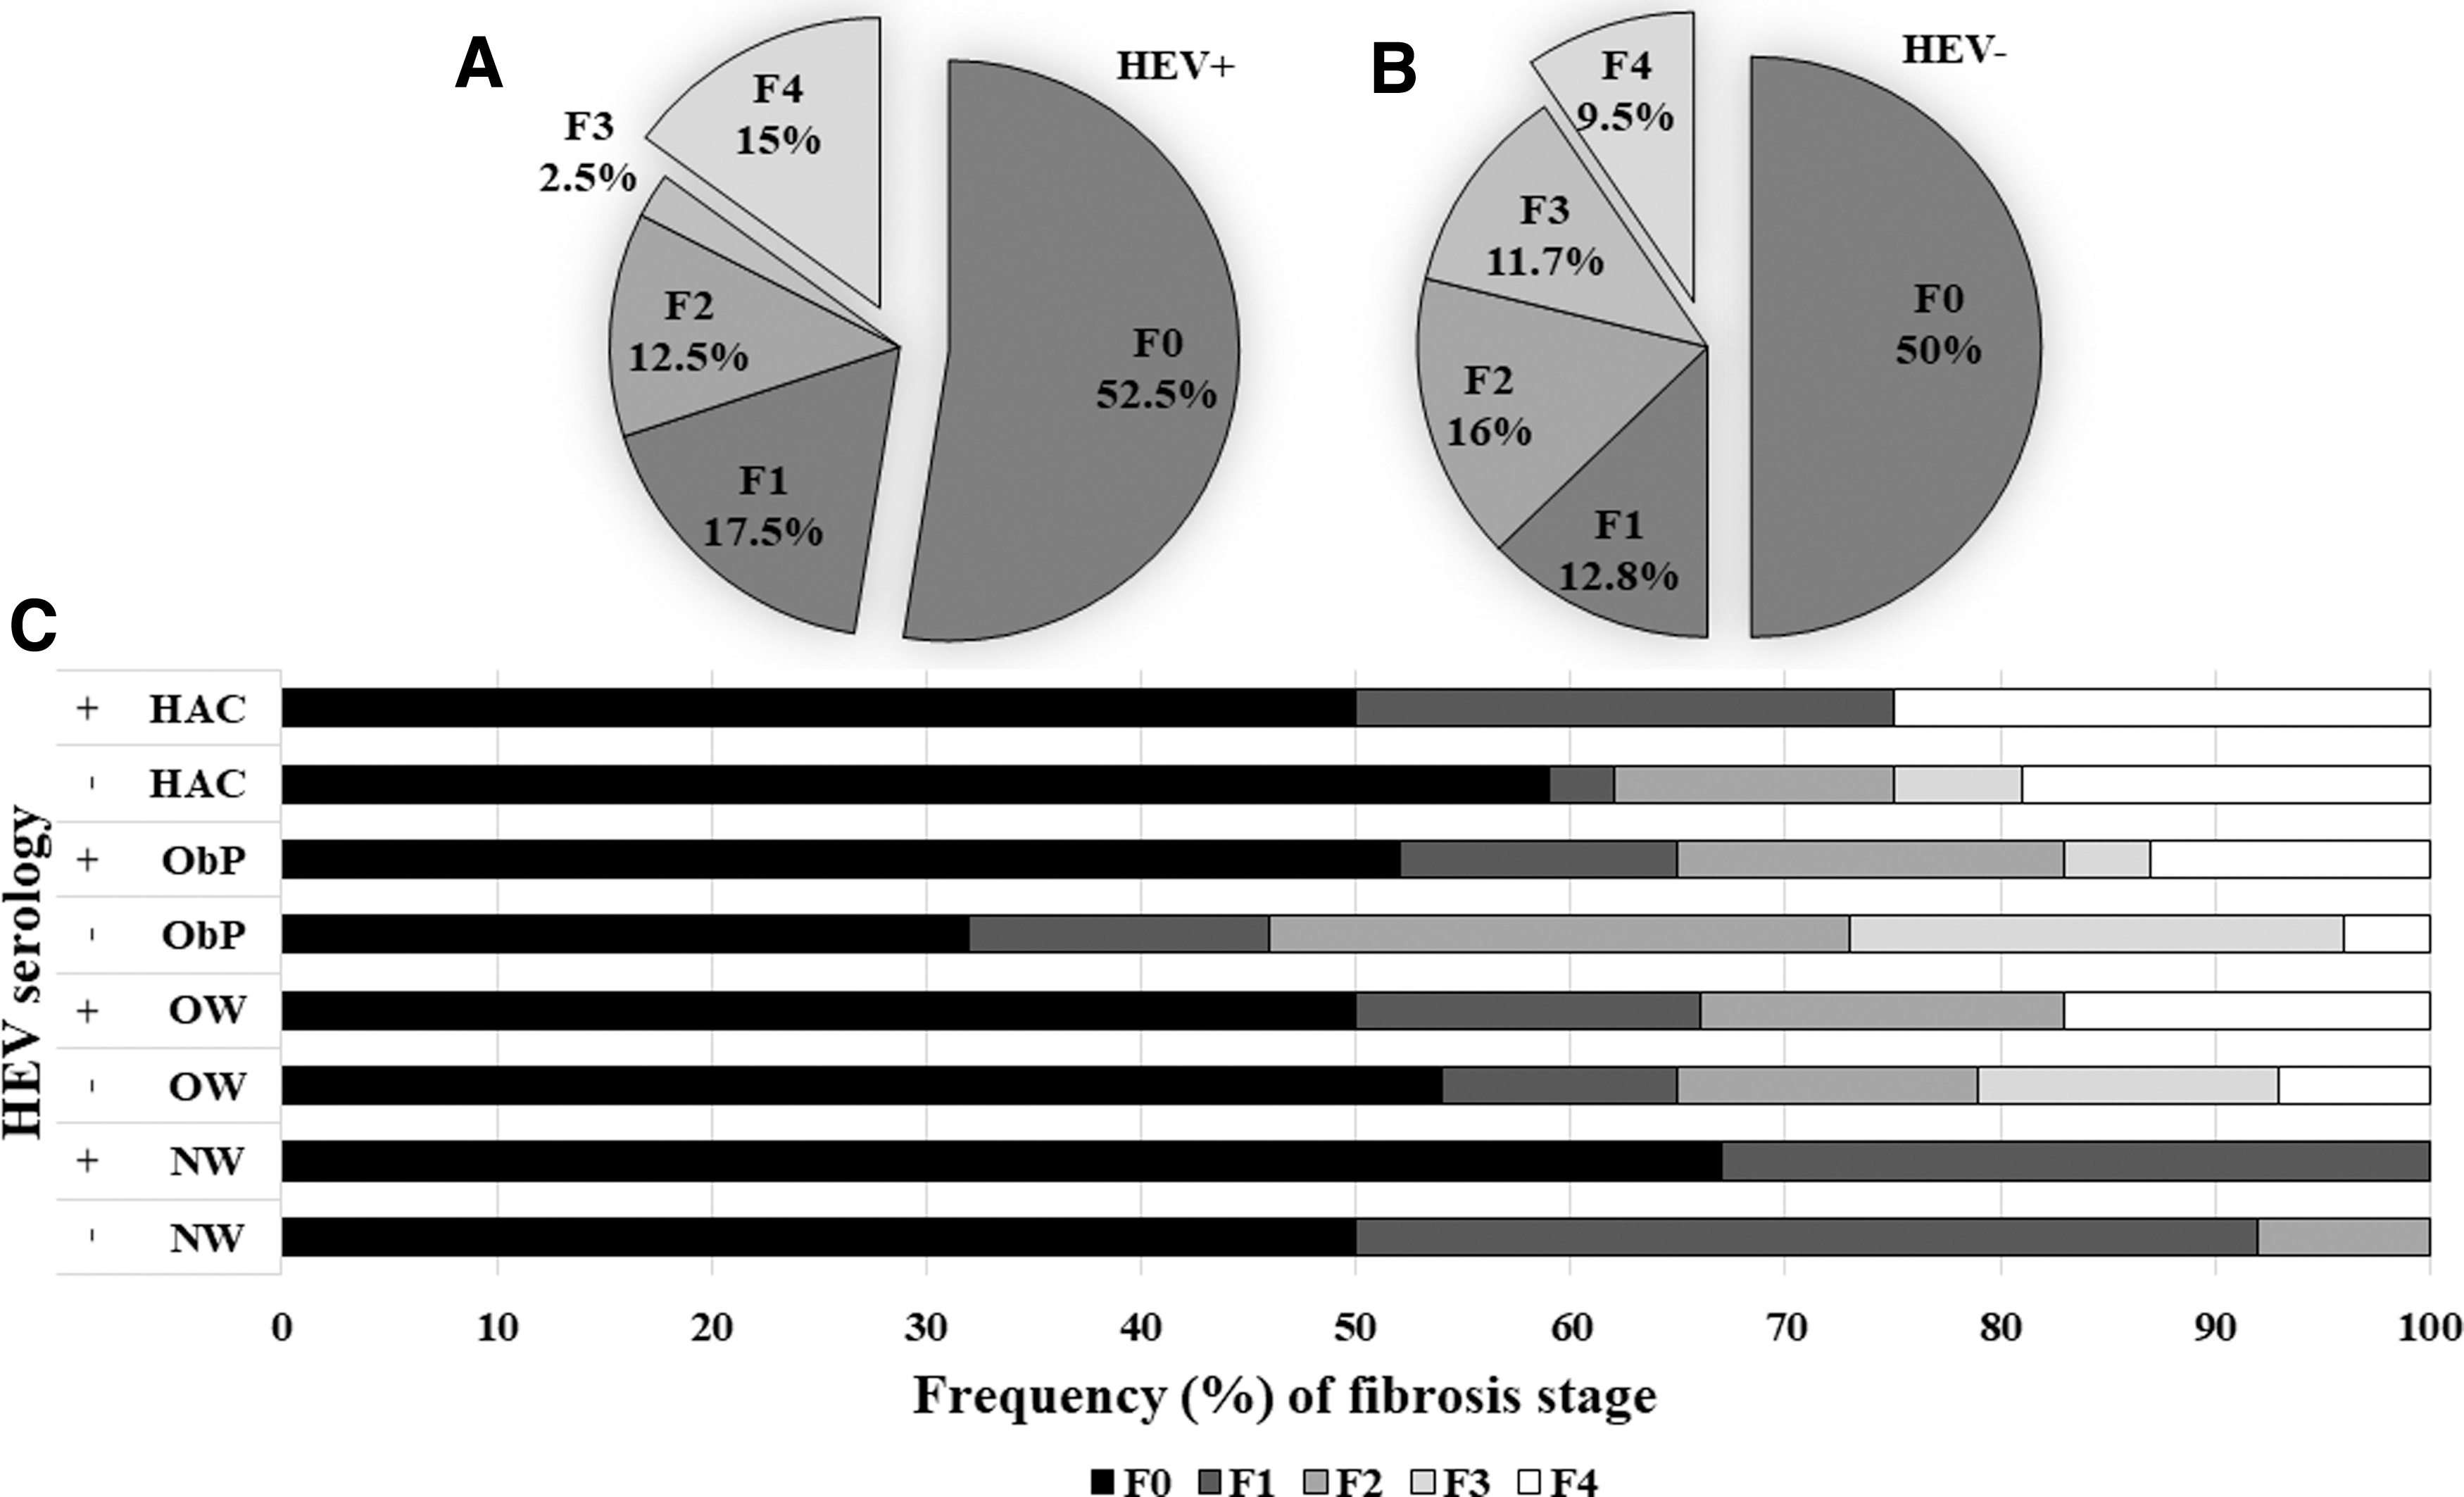
An increased proportion of IgG anti-HEV-seropositive patients presented advanced liver damage. Available data of transient elastography from 134 patients were included for analysis. Statistical differences were analyzed by Chi-square with an α < 0.05.
Discussion
To our understanding, this is the first report that provides evidence of a relationship between HEV infection and obesity. A meta-analysis of the country-level socioepidemiological factors associated with IgG anti-HEV seroprevalence in north and south America (15) revealed a negative correlation between BMI and the presence of HEV serology; however, these results did not reach statistical significance. Furthermore, the analysis was only conducted among overweight and obese individuals, and no comparisons were performed between normal-weight and obese populations. In addition, a recent report revealed a high prevalence of NAFLD in patients with anti-HEV IgG antibodies in China (35). Although other studies have evaluated the relation of these variables, with no significant differences, these studies have not been conducted in the context of obesity (11,17) or were carried out with a resulting low (2.6%) HEV seroprevalence (20) compared with the present study (29.4%).
Herein, a strong association between obesity and the HEV seroprevalence was found, identifying a BMI cutoff of 29.3 kg/m2 that differentiates the anti-HEV reactivity. Interestingly, a high percentage of ObP was reactive to IgG anti-HEV (57.5%). This may be explained by socioeconomical characteristics of the analyzed population living in west Mexico, a region where a high IgG anti-HEV seroprevalence has been reported in swine samples suggesting a potential zoonotic transmission of the infection (24). However, future studies analyzing HEV strains from animal and human sources from this geographical region may support this possibility. In addition, as previously reported (4), in the present study the highest frequency of anti-HEV antibodies was found in older patients supporting that age and lifestyle might predispose for the infection.
A synergistic effect on liver inflammation by obesity and viral infection has been described, as in chronic HCV-infected patients, and this inflammation is related to increased hepatic fibrosis (18). A higher intrahepatic concentration of proinflammatory cytokines (as IFN-γ) has been previously reported in patients with a BMI >30 kg/m2 during chronic infection with HCV (27). In fact, during the liver fibrosis process, systemic inflammation is present in patients and is characterized by the increased production of activation antigens in T cells accompanied by the augmentation of IFN-γ and IL-17 (2,3,25). In the present study, a proinflammatory cytokine profile (elevation of IL-12, IFN-γ, and IL-1β) was found in ObP reactive to IgG anti-HEV; also, a trend of a positive correlation between the OD for IgG anti-HEV and these cytokines was observed but with low linearity. The cytokine profile from patients nonreactive to IgG was more likely to be present in the lean population or obese people with nonpathologic adipose tissue, characterized by the presence of IL-4, IL-13, and IL-10. It is important to note that no high alcohol consumers were included in this analysis; therefore, alcohol did not influence the inflammatory process found. Moreover, a trend toward increased levels of IL-12 IFN-γ, and IL-1β in NW reactive to IgG anti-HEV relative to NW patients nonreactive to IgG supporting that in the context of obesity HEV promotes an exacerbated proinflammatory state.
Recent studies have revealed that patients exposed to HEV (IgG anti-HEV positive) present an upregulation of proinflammatory cytokines IFN-γ and IL-12 (7,36); in fact, this inflammation is present even once the infection was resolved (33). Thus, inflammation due to HEV exposure and the well-documented systemic inflammation during chronic liver disease and NAFLD in obesity (1,2) might create a vicious circle that contributes to the progression of fibrosis in HEV-positive patients, resulting in the greater percentage of patients with advanced liver damage observed in this study. Herein, patients who were IgG anti-HEV reactive had increased levels of liver enzymes suggesting a more altered liver dysfunction than those without these antibodies. Moreover, although patients nonreactive to IgG showed a trend toward an increased proportion of patients in stage F3 liver damage, those individuals positive for IgG anti-HEV antibodies exhibit a trend toward an increased proportion of patients in stage F4 suggesting a more accelerated progression toward liver disease in the context of HEV infection. However, future prospective studies are required to evaluate this possibility.
Genomic variability influences the HEV outcomes. The HEV causing chronic liver disease is predominantly HEV Gt3 (19). Although this viral genotype is mostly related to chronic liver damage in immunosuppressed patients, HEV-Gt3 chronic liver infection in an apparently immunocompetent patient has been recently reported in an obese individual with liver cirrhosis (6). In this study, viral RNA was detected in 23.7% of obese individuals but genomic variability was not determined due to the limited volume of samples available. However, taking into account that we previously reported the circulation of HEV-Gt3 in patients with chronic liver disease from the same geographical region (38), our study underscores that the genetic characterization of circulating HEV strains in risk groups, including the obese population, is necessary for handling the infection on specific geographic regions.
In conclusion, the high percentage of ObP with antibodies against HEV and viral RNA detection, along with an associated proinflammatory cytokine profile found in this study, support an interplay between HEV and obesity. Although the nature of our study does not make it possible to establish which one is a risk for the development of the other (obesity as a risk factor for HEV infection or HEV infection causing obesity); the information obtained in this study, will help to elucidate the inflammatory machinery involved in the development of chronic liver disease during HEV in the setting of the obesity pandemic.
Footnotes
Authors' Contributions
O.V.-S.: main author; processing of samples; analysis and interpretation of data; drafting and critical revision of the article. A.P.: coordinator of the Viral Hepatitis Clinic; medical liver disease assessment; acquisition of samples; clinical database files; critical revision of the article. J.L.T.-O.: counseling in the cytokine profile determination; interpretation of the immunity data; critical revision of the article. E.C.-.V.: serology analysis for IgM and IgG anti-HEV determination. R.T.-V.: acquisition of samples; serum bank organization for patients with high alcohol consumption; determination of alcohol consumption; analysis of liver damage data; critical revision of the article. M.S.-V.: acquisition of samples; serum bank organization for ObP; anthropometric analysis; critical revision of the article. S.R.: serum bank organization for patients with obesity and high alcohol consumption; acquisition of samples; clinical database files; critical revision of the article. N.A.F.: study concept and design; critical revision of the article for important intellectual content.
Acknowledgment
The authors thank Gisela Dupont for technical assistance.
Author Disclosure Statement
No competing financial interests exist.
Funding Information
This study was funded by grants from the Consejo Nacional de Ciencia y Tecnología (CONACYT, No. 246839, to N.A.F.). Red Mexicana de Virología to O.V.-S.
Supplementary Material
Supplementary Table S1
References
Supplementary Material
Please find the following supplemental material available below.
For Open Access articles published under a Creative Commons License, all supplemental material carries the same license as the article it is associated with.
For non-Open Access articles published, all supplemental material carries a non-exclusive license, and permission requests for re-use of supplemental material or any part of supplemental material shall be sent directly to the copyright owner as specified in the copyright notice associated with the article.