
Abstract
Dysfunctional immune activation accumulates during chronic viral infection and contributes to disease pathogenesis. In HIV-1, immune activation is exacerbated by concurrent infection with hepatitis C virus (HCV), accelerating depletion of CD4+ T cells. HIV-1 suppression with antiretroviral therapy (ART) generally reconstitutes CD4+ T cell counts, while also reducing the proportion that is activated. Whether this immune reconstitution also reduces the complexity of the CD4+ T cell population is unknown. We sought to characterize the relationship between activated CD4+ T cell repertoire diversity and immune reconstitution following ART in HIV-1/HCV coinfection. We extracted T cell receptor (TCR) sequences from RNA sequencing data obtained from activated CD4+ T cells of HIV-1/HCV coinfected individuals before and after treatment with ART (clinical trial NCT01285050). There was notable heterogeneity in both the extent of CD4+ T cell reconstitution and in the change in activated CD4+ TCR repertoire diversity following ART. Decreases in activated CD4+ TCR repertoire diversity following ART were predictive of the degree of CD4+ T cell reconstitution. The association of decreased activated CD4+ TCR repertoire diversity and improved CD4+ T cell reconstitution may represent loss of nonspecifically activated TCR clonotypes, and possibly selective expansion of specifically activated CD4+ clones. These results provide insight into the dynamic relationship between activated CD4+ TCR diversity and CD4+ T cell recovery of HIV-1/HCV coinfected individuals after suppression of HIV-1 viremia.
Introduction
HIV-1
The effect that coinfection has on HIV-1 disease progression is less well defined, but there is evidence that HCV-mediated dysfunctional T cell activation may augment similar processes in HIV-1. HIV-1 monoinfection causes widespread CD4+ and CD8+ T cell activation that correlates closely with CD4+ T cell depletion and HIV-1 disease progression (7,18,24,36,49). Some studies have shown that HCV monoinfection also causes dysfunctional T cell activation (13,16,35). Furthermore, HIV-1/HCV coinfection generates significantly greater T cell activation than either HIV-1 or HCV infection alone (13,14,16,22). HIV-1 suppression with antiretroviral therapy (ART) generally leads to decreases in T cell activation with CD4+ T cell count recovery and an improved capacity to target opportunistic and other pathogens (2,33,34).
Given the dynamic modulation of the activated CD4+ T cell compartment by HIV-1/HCV coinfection and ART, we were interested to examine how the diversity of the activated CD4+ T cell receptor (TCR) repertoire changes following HIV-1 suppression. The total CD4+ TCR repertoire is less diverse in HIV-1 compared to healthy controls (21,54), with one study finding no significant improvement in diversity after 3 months of HIV-1 suppression with ART (21). There are limited data indicating that CD4+ TCR diversity in HCV may be unchanged compared to healthy controls (51). We are not aware of any previous study investigating TCR diversity in activated CD4+ T cells in HIV-1 monoinfection or in HIV-1/HCV coinfection.
Decreased HIV-1 viremia after ART reduces a dominant antigenic stimulus, which could lead to increased TCR diversity in the activated CD4+ T cell compartment. However, suppression of HIV-1 also has the potential to reduce dysfunctional immune activation, leading to loss of diverse, nonspecifically activated TCR clonotypes, which could lead to reduced activated CD4+ TCR diversity. Furthermore, other chronic antigenic stimuli, such as chronic HCV infection, may influence the diversity of the TCR repertoire after HIV-1 suppression by acting as a dominant antigenic stimulus for recovering T cells, thereby reducing net activated CD4+ TCR diversity. Alternatively, another infection may also be a continued stimulus for dysfunctional activation, which could maintain nonspecific activated CD4+ TCR diversity even after HIV-1 suppression.
To define the net result of this combination of factors, we examined the TCR repertoire of activated CD4+ T cells before and after HIV-1 suppression in a cohort of HIV-1/HCV coinfected individuals. Notably, a prior study of this cohort showed a reduction in the proportion of activated CD4+ T cells following ART (11), but we found that the magnitude of this reduction in CD4+ T cell activation was not significantly correlated with the extent of total CD4+ T cell count recovery. We did observe, however, that greater reductions in activated CD4+ TCR diversity after HIV-1 suppression correlated with more robust, early recovery of total CD4+ T cells.
Materials and Methods
Human subjects
Twenty persons with HIV-1/HCV coinfection were enrolled in a prospective study of HIV-1 and HCV viral kinetics before ART, as previously described (5). One of the 20 participants did not complete the study and therefore did not have measurements from later time points. This individual was consequently excluded from final analysis. A second participant did not have RNA sequencing (RNAseq) data after HIV-1 suppression and so was also excluded from our analysis. Persons with chronic HIV-1 and HCV infections were recruited from the Johns Hopkins HIV-1 Clinic, the Baltimore City Sexually Transmitted Diseases Clinic, and other area clinics.
HIV-1 infection was established by detection of HIV-1 antibodies and an HIV RNA level of >400 copies/mL. Chronic HCV infection was determined by detection of HCV antibodies and an HCV RNA level of >100,000 IU/mL for >6 months. Participants had received <24 months of ART over their entire lives and none within 6 months. Participants were excluded if hepatitis B surface antigen was detected in plasma; they were pregnant; there was a history of severe depression or any uncontrolled disease; platelet count was <50,000/mm3; or there was a contraindication to use of raltegravir, tenofovir disoproxil fumarate, or emtricitabine. Because therapy was judged too urgent to wait for study procedures as per current treatment guidelines for HIV-1 and HCV, persons at screening whose CD4+ T lymphocyte counts were <200/mm3 or who had cirrhosis were also excluded. A total of 32 patients were screened to identify 20 study participants, two of whom were excluded for this analysis as described above.
Participants were admitted to the Johns Hopkins Hospital Clinical Research Unit. A detailed description of the study protocol has previously been published in full (5). Briefly, blood was collected at baseline. A single injection of pegylated interferon (IFN)-α2b (1.5 μg/kg) was subsequently administered subcutaneously. Participants returned 48 h, 72 h, 7 days, and 14 days afterward for plasma HIV-1 RNA measurements.
On day 14, ART consisting of raltegravir, tenofovir disoproxil fumarate, and emtricitabine was given by the Johns Hopkins Research Pharmacy Investigational Drug Service. When HIV-1 RNA levels were stably <400 cp/mL, participants returned for repeat blood collection. The first specimen collected for sequencing (“Baseline”) was acquired before the initial pegylated IFN-α2b injection and the second specimen (“After HIV-1 suppression”) was collected after HIV-1 RNA levels were stably <400 cp/mL for a median of 19 weeks (range 7–25 weeks). All participants gave written informed consent to the protocol. The Johns Hopkins University School of Medicine Institutional Review Board approved this study.
Isolation of RNA from activated CD4+ T cells
Isolation of activated CD4+ T cells and extraction of RNA were performed as part of a previously published study (12). Briefly, previously frozen peripheral blood mononuclear cells (PBMCs) from blood draws at baseline and after HIV-1 suppression were thawed, washed, and incubated with CD3-FITC (BioLegend), CD4-PE/Cy7 (BioLegend), CD8-APC (BD Biosciences), HLA-DR–PE (BioLegend), and CD38-BV421 (BioLegend) antibodies as per the manufacturers' recommendations. Immediately before sorting, plasma membrane-compromised cells were labeled with propidium iodide (Sigma-Aldrich).
The population of interest was FACS sorted (MoFlo Legacy Sorter, Beckman Coulter) directly into ≥4 volumes of Quick-RNA MicroPrep lysis buffer (Zymo Research) as per the manufacturer's recommendation. Sorting was stopped when the number of sorted cells reached 125,000 cells, although many samples did not reach this number (median number of cells sorted 72,304, range 16,587–125,000). Flow cytometry analysis on two randomly selected postsort samples revealed >95% purity. Sorted samples were vortexed, incubated for 10 min at room temperature, vortexed again, and frozen at −80°C until RNA extraction.
RNA isolation was performed using the Quick-RNA MicroPrep kit (Zymo Research) according to the manufacturer's protocol without the on-column deoxyribonuclease treatment. The eluate was treated with DNAse I (Qiagen), then purified, and concentrated using the RNA Clean-up and Concentrator kit (Zymo Research) according to the manufacturer's protocol. The high-sensitivity assay for RNA or DNA was performed on RNA isolations and complementary DNA (cDNA) libraries, respectively, using a 2100 Bioanalyzer (Agilent).
Library preparation and sequencing
cDNA libraries were produced as part of a previous study (12) using the Ovation Single-cell RNAseq kit (NuGEN) according to the manufacturer's specifications. All sequencing data were deposited in the National Center for Biotechnology Information (NCBI) Sequence Read Archive (accession no. SRP068424).
TCR repertoire estimations of diversity and clonality
TCR sequences were extracted from RNAseq paired-end reads based on alignment with reference V, D, J, and C genes (GenBank) and were grouped into clonotypes based on CDR3 nucleotide sequence using the software MiXCR (version 3.0.12) through the RNAseq pipeline (9). Subsampling was performed on the original FASTQ files using Seqtk (45). The R package immunarch (ImmunoMind, version 0.5.2) (46) was used to perform clonotype analysis and to estimate Chao1 richness and Shannon Entropy. All R code was executed within R Studio (version 1.2.5019) (47).
Sample identity validation
We performed analysis to determine the sex of two samples originating from participants of differing sex, which we suspected to have been unintentionally exchanged based on an early analysis of repertoire overlap between subjects (data not shown). The software Salmon (version 1.1.0) (37) was used to quantify transcripts from raw RNAseq data, using human genome GRCh38 for alignment. The Bioconductor package tximeta (version 1.4.5) (30) was used within R to analyze differential expression of X-inactive specific transcript (XIST) (19), a noncoding RNA important for X chromosome inactivation in women.
The two samples that had been suspected of being switched showed nonconcordance between their reported sex and the sex of their sample based on XIST expression. Based on these results, they were switched back. The analysis in this article was also conducted with the samples unswitched with the same results (data not shown). All R code was executed within R Studio (version 1.2.5019) (47).
Statistical analysis
Comparisons of CD4+ T cell counts were done using a paired t-test after using the Shapiro-Wilk's test to demonstrate a normal distribution. Comparisons of richness and Shannon Entropy between the two time points was done using the nonparametric paired samples Wilcoxon signed rank test. Correlation coefficients were calculated using the Kendall ranked correlation test. A cutoff of p < 0.05 was used to determine statistical significance. All statistical analysis was performed in R Studio (version 1.2.5019 (47).
Results
Marked variability in peripheral CD4+ T cell reconstitution after HIV-1 suppression
Using a previously characterized cohort of 18 HIV-1/HCV coinfected individuals (Table 1) (5,12), we measured CD4+ T cell counts at baseline and after participants had started ART and achieved an undetectable HIV-1 viral load. All participants achieved HIV-1 suppression (median time with undetectable HIV RNA was 19 weeks, range was 7–25 weeks). As expected, there was a statistically significant increase in CD4+ T cell count after participants had achieved HIV-1 suppression (Fig. 1A). However, analysis of the change in CD4+ T cell count by individual participant (Fig. 1B) demonstrated notable heterogeneity in reconstitution. We knew from a prior study of this same cohort that the frequency of activated CD4+ T cells (defined by co-expression of CD38 and human leukocyte antigen (HLA)-DR) decreased following initiation of ART (11). We reasoned that if CD4+ T cell activation were dysfunctional and nonspecific in HIV/HCV coinfected persons, then the magnitude of reduction in CD4+ T cell activation would predict the magnitude of CD4+ T cell recovery. Surprisingly, we detected no correlation in the change in frequency of activated CD4+ T cells and the magnitude of increase in total CD4+ T cells (Fig. 1C).
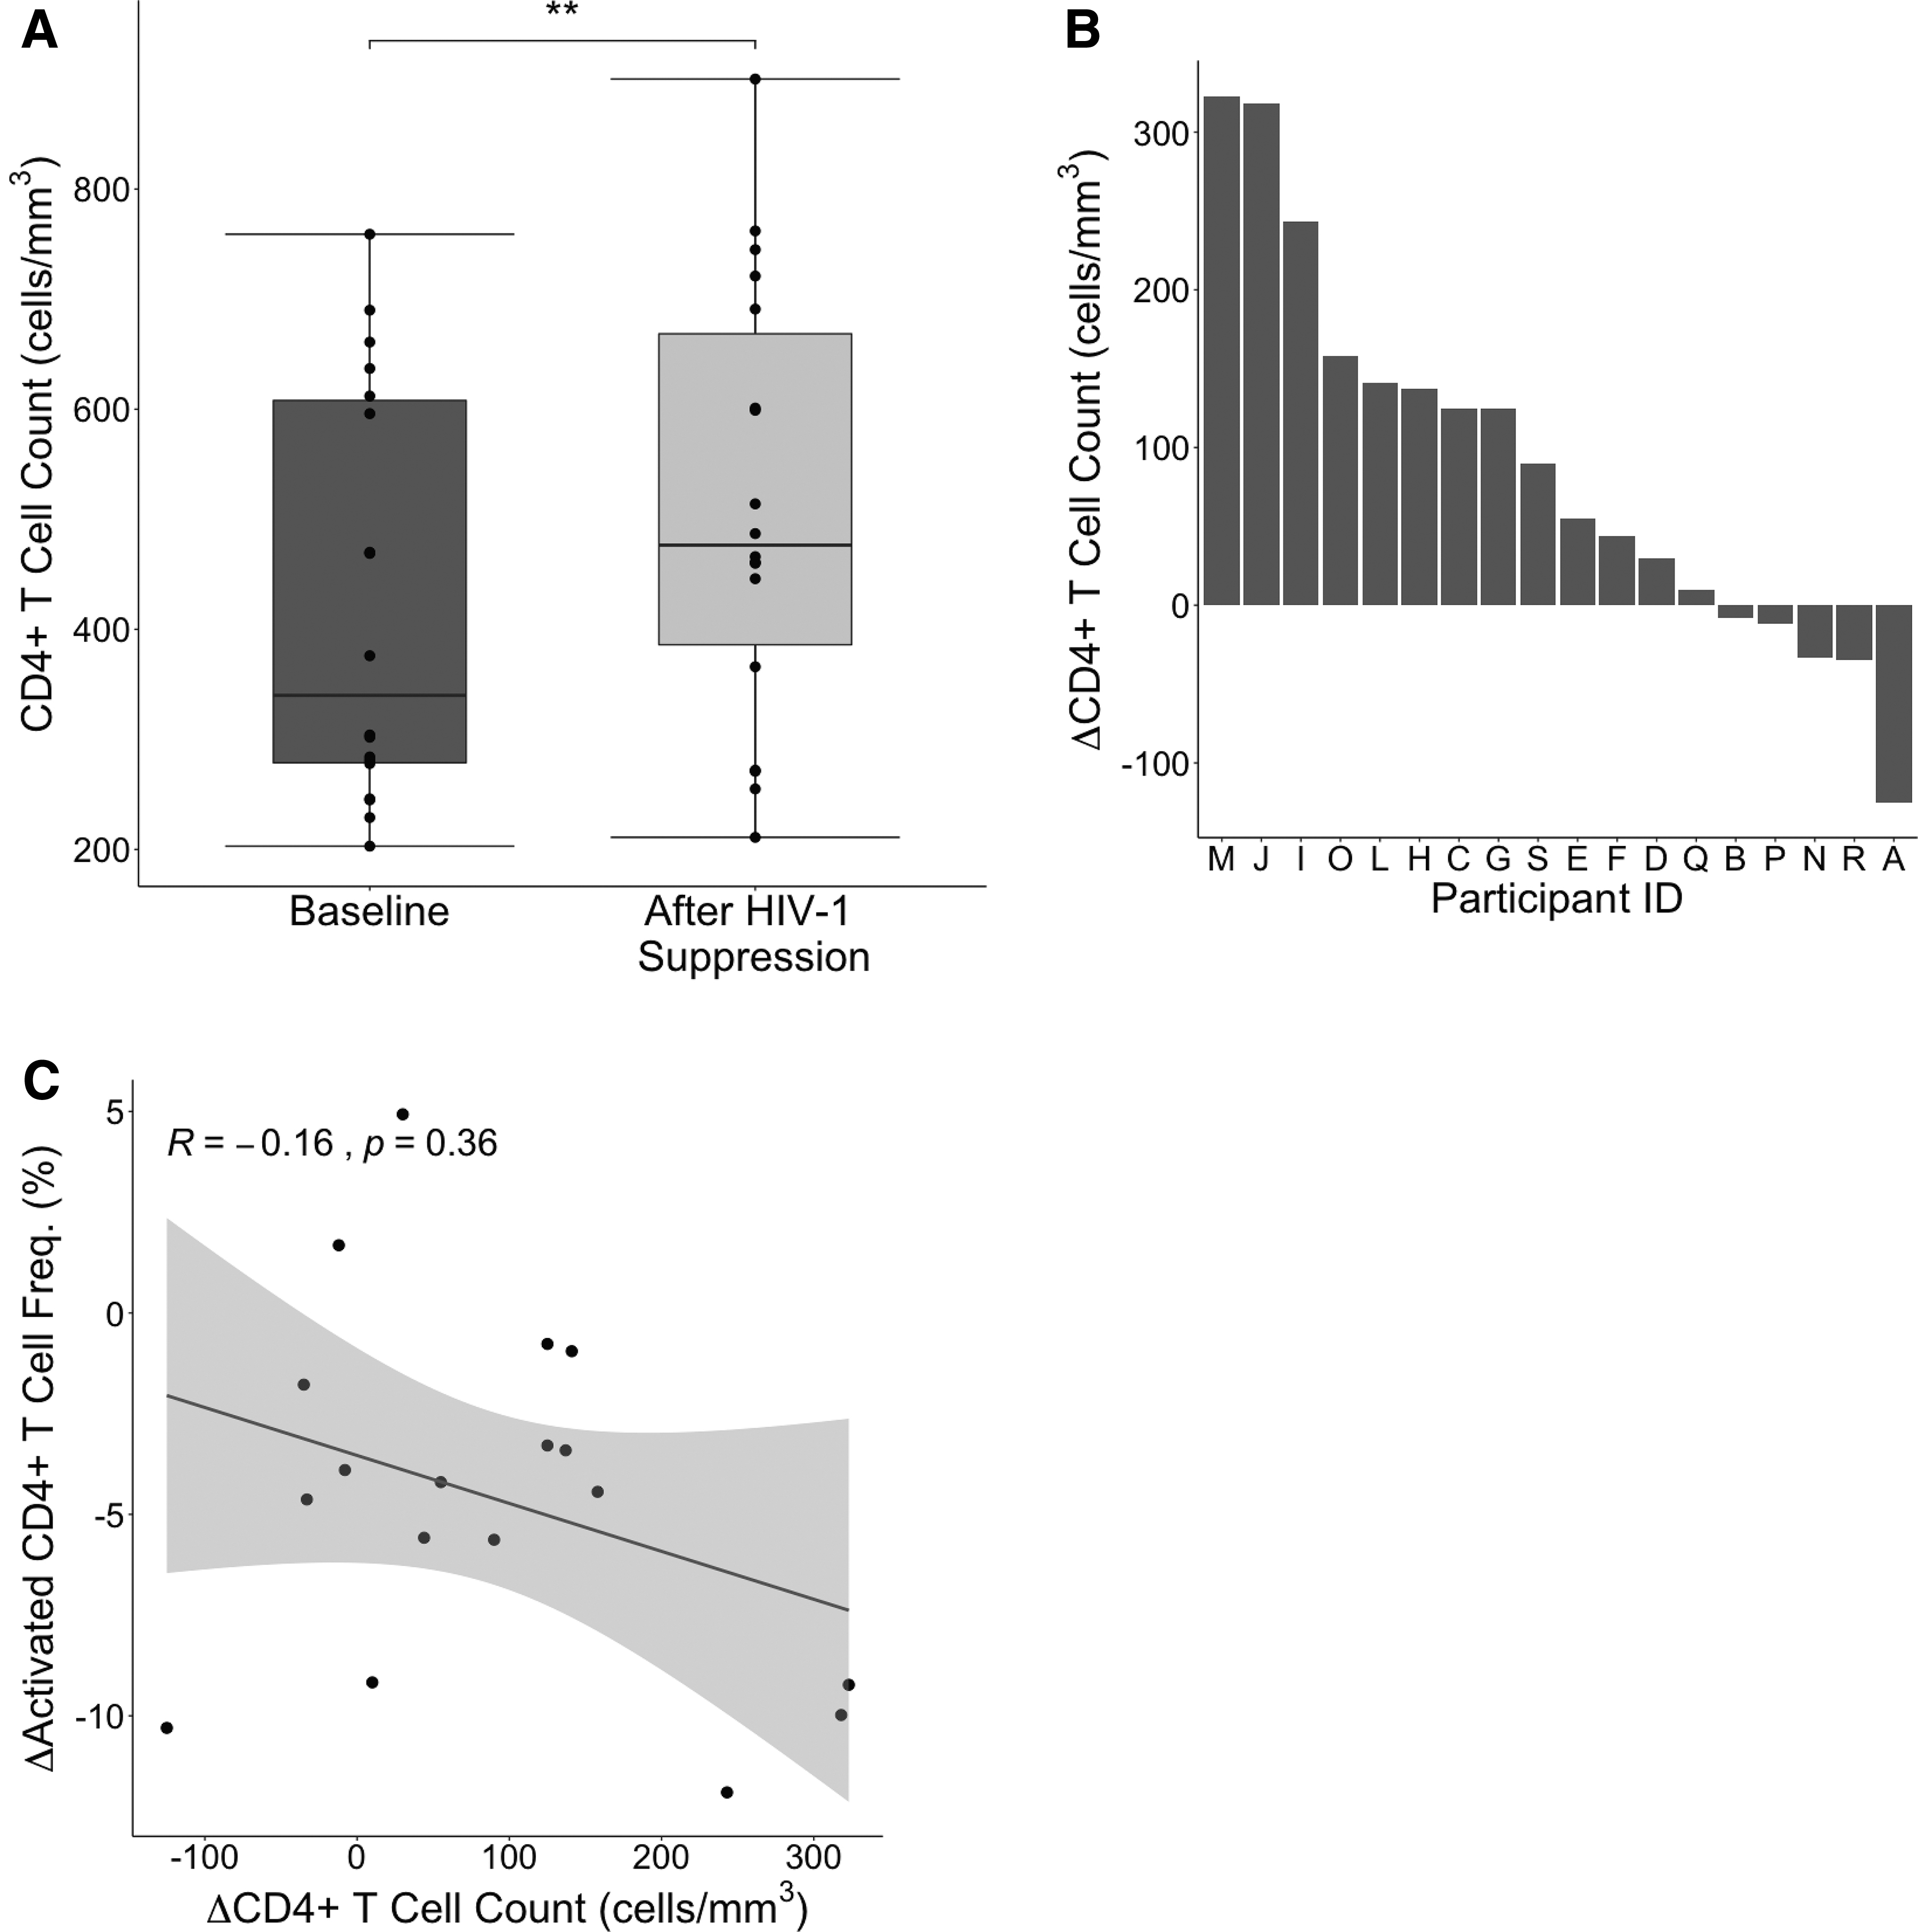
CD4+ T cell counts before and after HIV-1 suppression.
Participant Characteristics
HCV, hepatitis C virus.
Overall activated CD4+ T cell repertoire diversity was unchanged after HIV-1 suppression
We were next interested in the diversity of the activated CD4+ TCR repertoire during HIV reconstitution. For a prior study, whole transcriptome RNAseq had been performed on sorted, activated CD4+ T cells from participants at baseline and after HIV-1 suppression (12). We defined activation of CD4+ T cells using the markers CD38 and HLA-DR. Other frequently used markers of T cell activation include CD69 and CD25, which are early- and intermediate-term markers of activation, with expression peaking around 24 h (CD69) or multiple days (CD25) after activation and beginning to decline thereafter (3,41,42). We used CD38 and HLA-DR, which can have a more prolonged expression, because of their well-cited association with many chronic infections, including HIV-1, HCV, and HIV-1/HCV coinfection (16,29,32). In particular, the presence of activated CD4+ T cells specifically as defined by CD38 and HLA-DR expression has been repeatedly shown to correlate with progression of HIV-1 disease to AIDS (4,20,25,43).
We used the software MiXCR (9) to identify TCR sequences from the transcriptome sequences and group them into unique clonotypes based on CDR3 nucleotide sequence. We estimated diversity using the Chao1 estimator of richness, which quantitates the number of unique TCR specificities. We used a measurement of richness because our interest was primarily in assessing nonspecific activation within the activated CD4+ TCR repertoire. Nonspecific activation would be expected to generate many different TCR specificities at low frequency, which would be well captured by richness measurements. As a secondary measure, we also repeated all calculations using the Shannon Entropy (Supplementary Figs. S1 –S3). Diversity was estimated using sequence data from both the TCR β chain and the TCR α chain. Changes in activated CD4+ T cell diversity were heterogenous, although measurements at both the α and β chain correlated highly with one another (Fig. 2A, B and Supplementary Fig. S1A, B). Treatment with ART did not result in an overall change in activated CD4+ T cell diversity (Fig. 2C, D and Supplementary Fig. S1C, D), as some participants' diversity increased, while others decreased or remained unchanged.
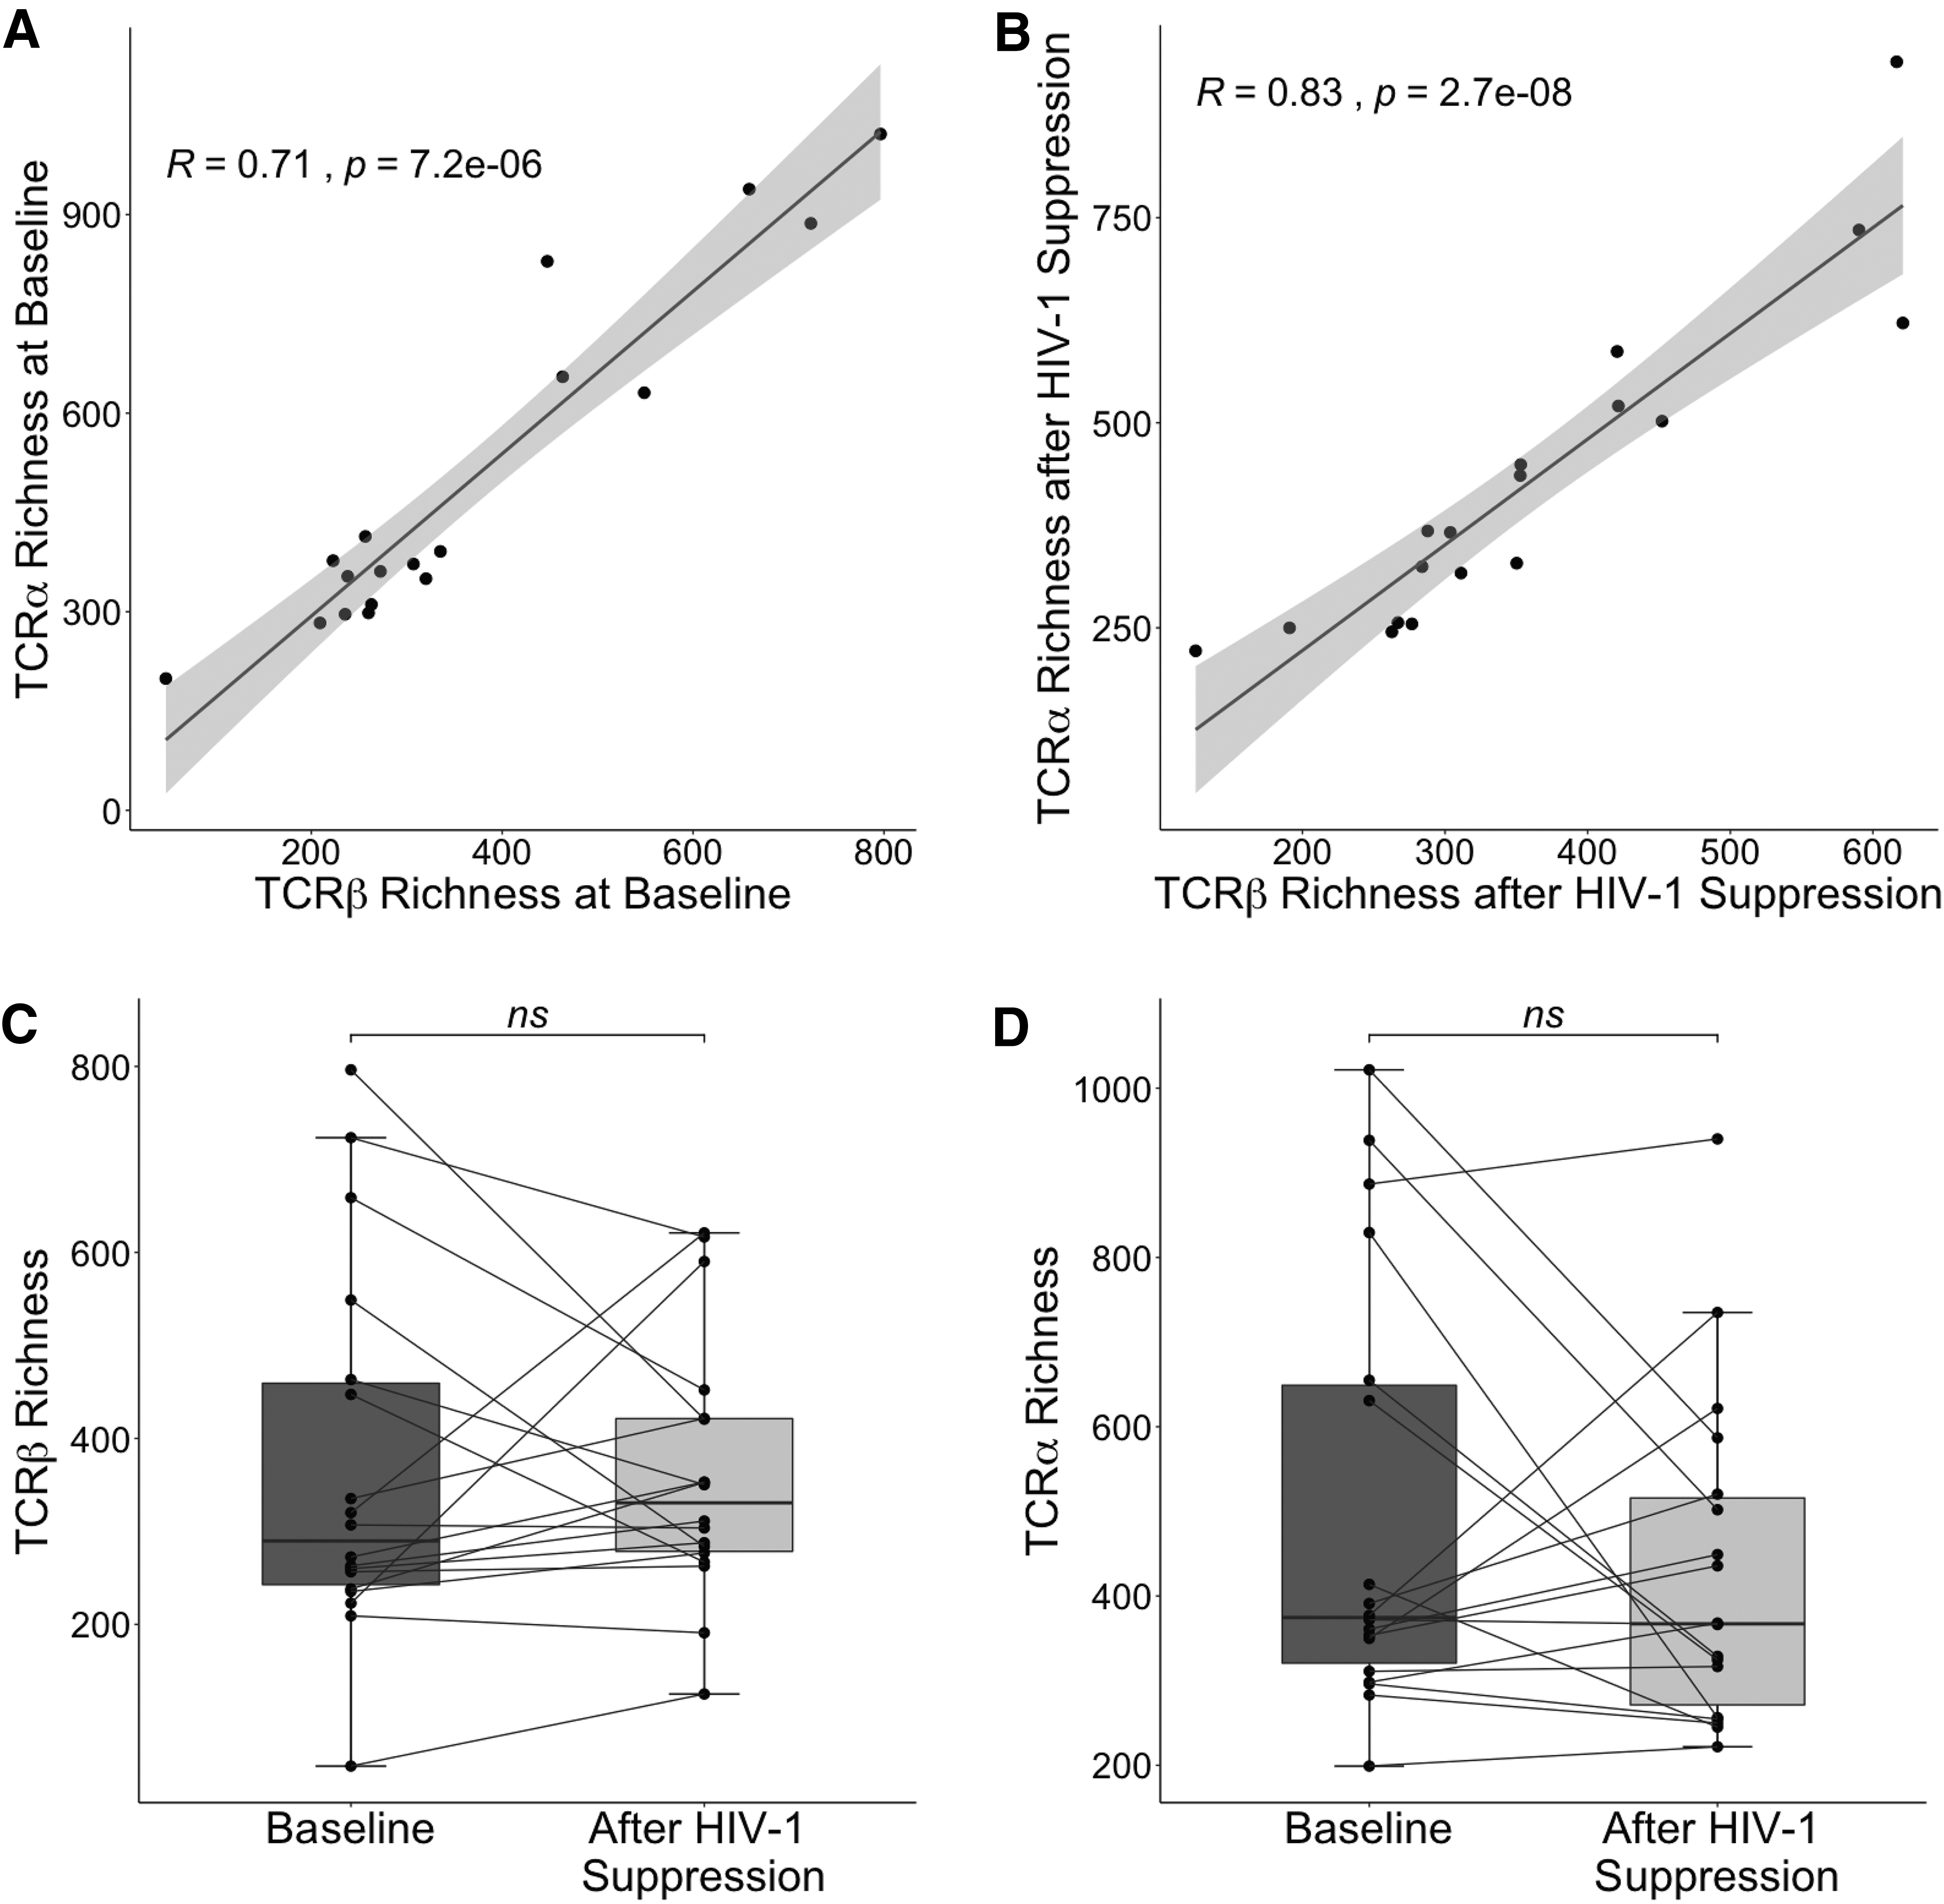
TCR repertoire richness before and after HIV-1 suppression. TCR β chain richness was plotted against TCR α chain richness for each participant at baseline
Decrease in the activated T cell repertoire diversity correlated with increase in total CD4+ T cell count
Given the heterogeneity we observed in both total CD4+ T cell recovery (Fig. 1B) and change in TCR diversity after ART (Fig. 2C, D and Supplementary Fig. S1C, D), we next examined the change in CD4+ T cell count as a function of the change in activated CD4+ TCR diversity from pre- to post-HIV-1 suppression. We observed a negative correlation between the change in diversity (at both the TCR β and TCR α chains) and the change in CD4+ T cell count (Fig. 3A, B and Supplementary Fig. S2A, B). Individuals who had decreases in activated CD4+ T cell diversity were more likely to have larger increases in total CD4+ T cell count. By using the best-fit line for both the TCR β and TCR α analysis, we found that reductions in activated CD4+ TCR diversity were associated on average with total CD4+ T cell count increases of ∼36–82 cells/mm3. Conversely, participants with increases in activated CD4+ T cell diversity generally had diminished CD4+ T cell reconstitution, with some participants experiencing a decrease in CD4+ T cell count, despite HIV-1 suppression with ART.
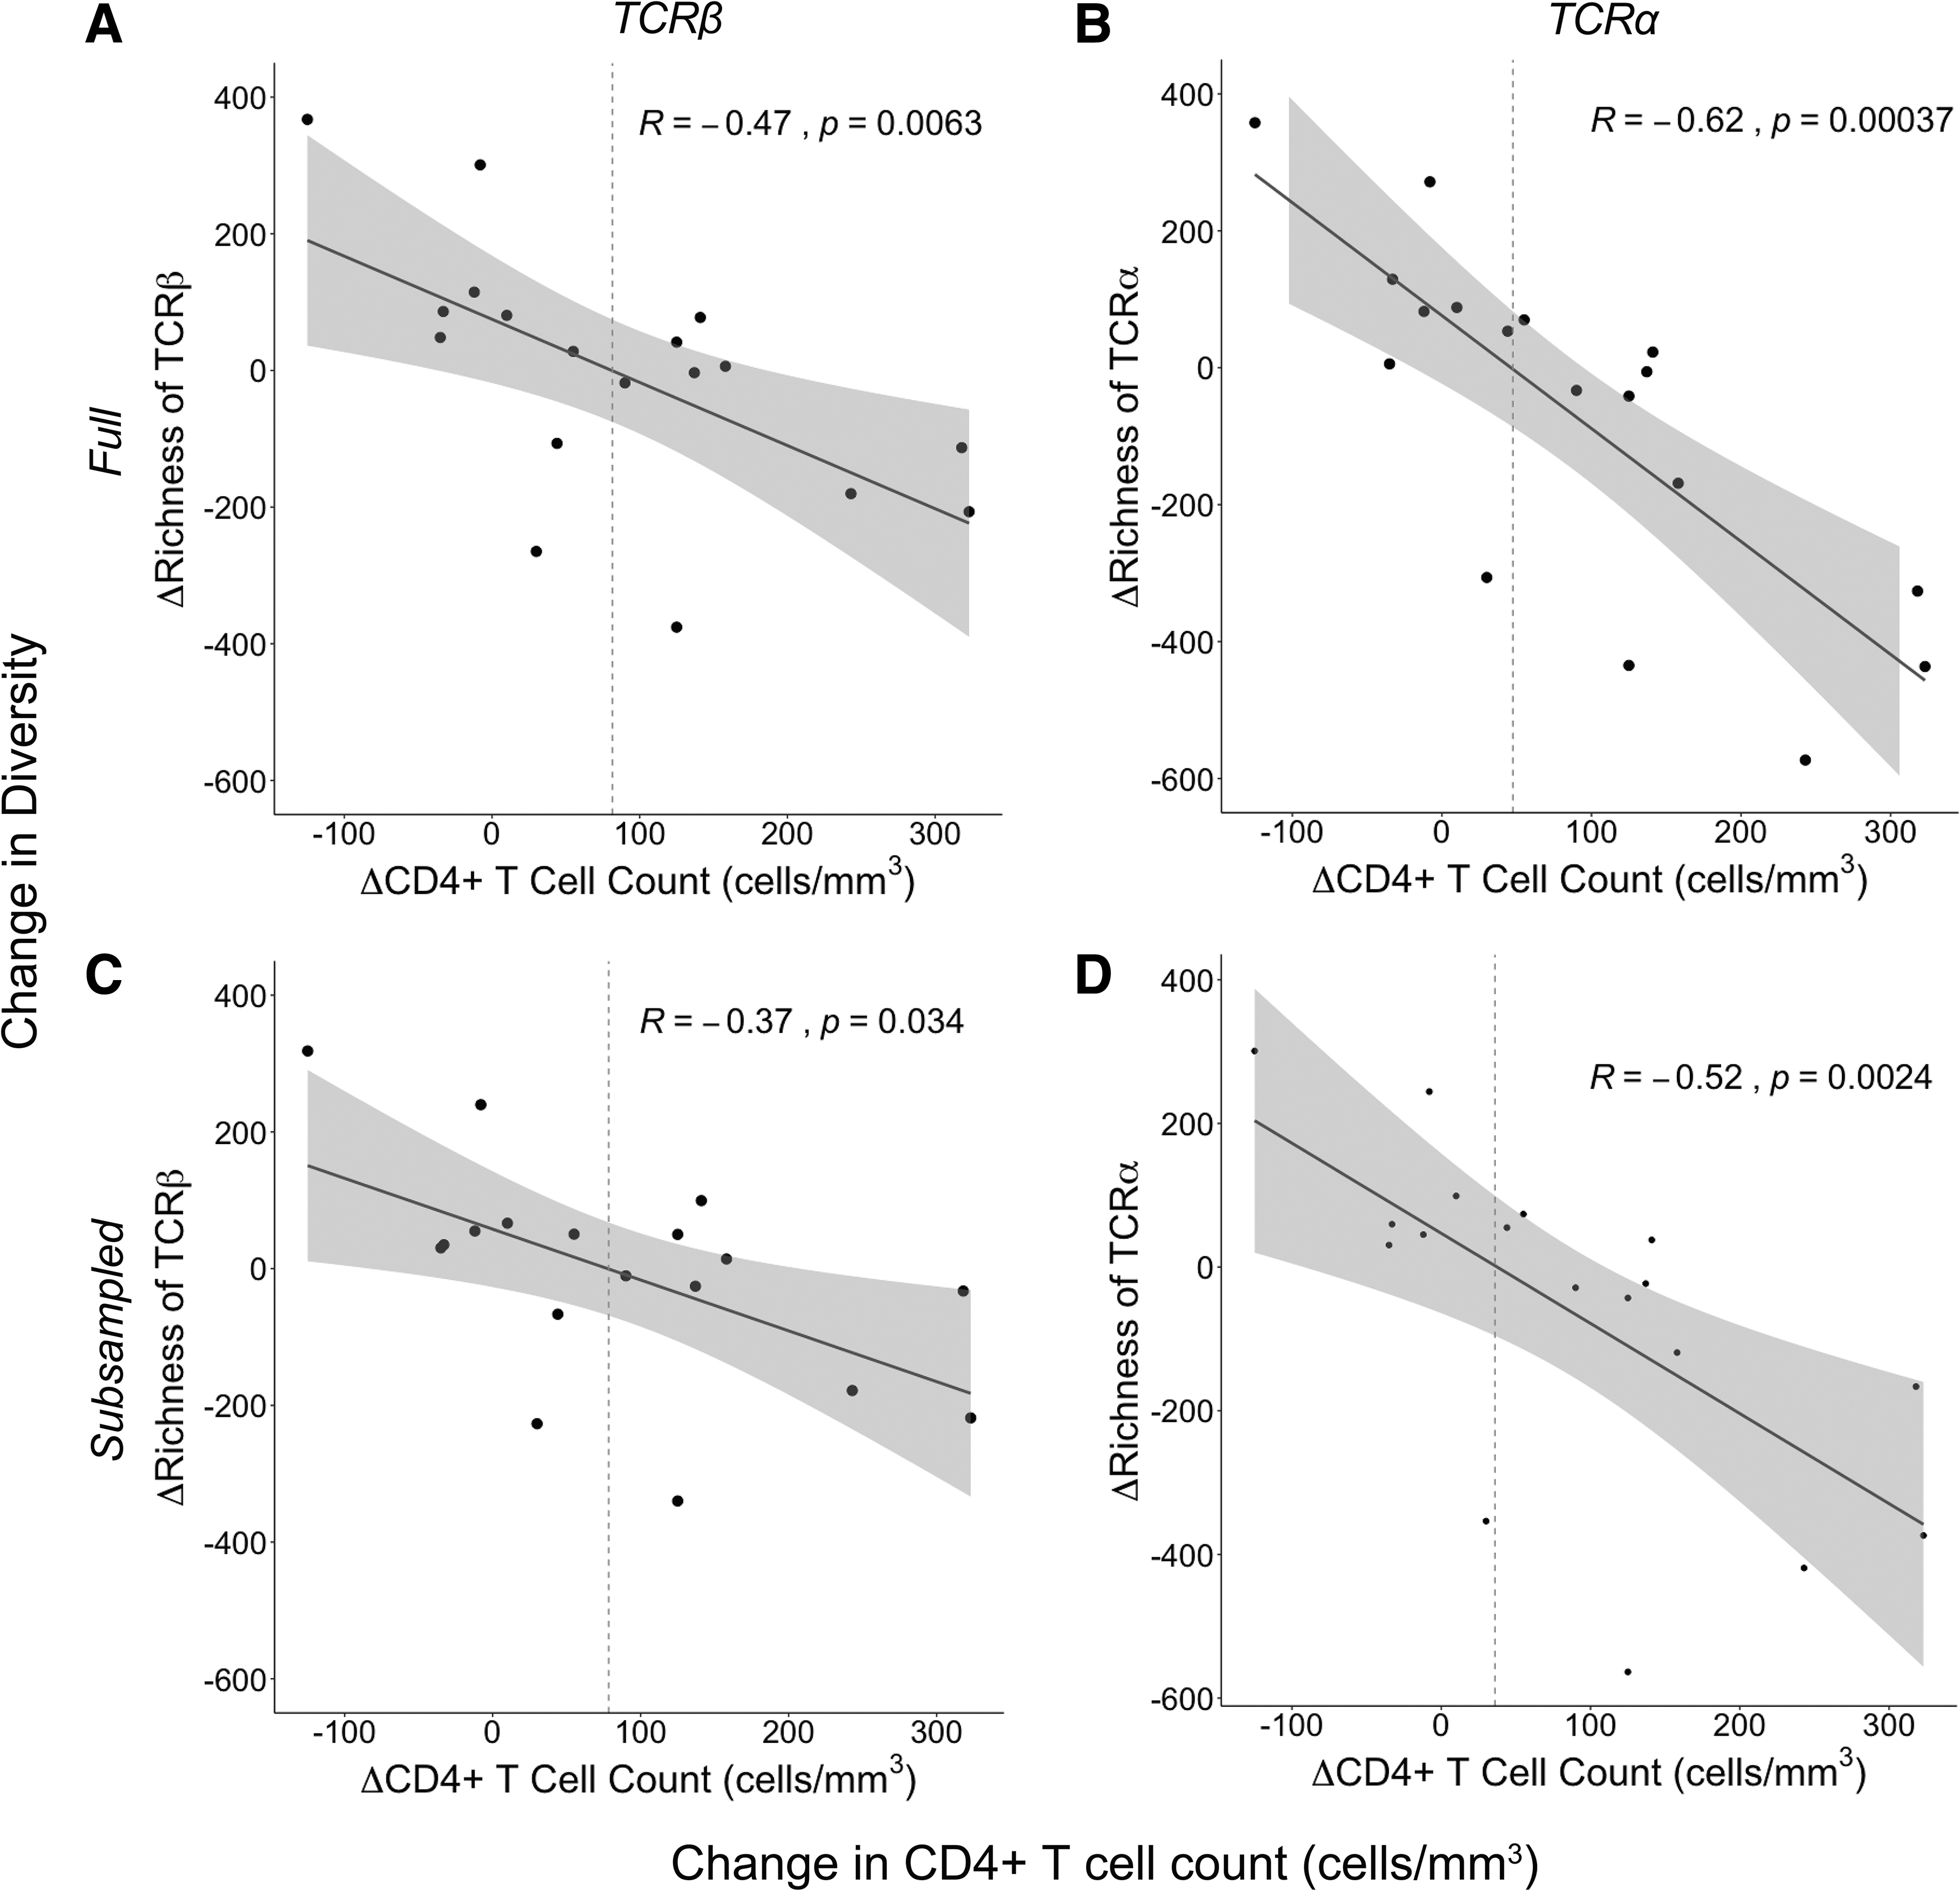
Change in richness as a function of change in CD4+ T cell count. The change in richness (Chao1 estimator) from baseline to after HIV-1 suppression for each participant (n = 18) was plotted against the change in CD4+ T cell count over this same time period. Richness estimates were done at both the TCR β chain
There was considerable variability in the number of activated CD4+ T cells sorted from each participant (between 16,587 and 125,000 with a median of 72,304 cells). Differences in cell numbers could be expected to influence sequencing depth, and consequently measurements of diversity. We found a weak correlation (data not shown) between the number of activated CD4+ T cells sorted and the richness. Therefore, to control for the effect of sequencing depth on richness, we performed random subsampling of the transcriptome sequences, generating files with equal numbers of reads for each participant (2.9 × 10⁷ sequences). The subset of sequences randomly selected for the α chains was different than those selected for the β chains, and different sequences were chosen for each participant. Repeating our richness analysis on these subsampled files revealed the same negative association between the change in activated CD4+ TCR richness and change in CD4+ T cell count after HIV-1 suppression (Fig. 3C, D). We found similar results using the Shannon Entropy at the TCR α chain, although results at the TCR β chain failed to reach statistical significance (Supplementary Fig. S2C, D).
We also examined TCR V and J gene usage (TRBV/TRBJ and TRAV/TRAJ at the β and α chains, respectively) and CDR3 length, as these are commonly used markers of clonality that can be reflective of repertoire diversity. We did not find differences in either TRBV/TRAV or TRBJ/TRAJ gene usage or CDR3 length before and after HIV-1 viral suppression (data not shown). We then examined these parameters in just the subset of subjects who experienced increases in repertoire diversity, postulating that differences might be more apparent in these subjects. However, there was no difference in TRBV/TRAV, TRBJ/TRAJ, or CDR3 length (Supplementary Fig. S4) in this subset between the two time points.
We also aligned CDR3 amino sequences beginning from the end of the V region and calculated amino acid usage at each position, comparing usage at baseline and after HIV-1 suppression in all subjects and in subjects with increases in diversity following ART (Supplementary Fig. S5). We performed this analysis at both the TCR β chain and TCR α chain and did not observe any differences between the two time points or between the analyses with all subjects and the analyses with subjects with an increase in diversity following ART.
Heterogeneity in subject age and absolute CD4+ T cell counts did not associate with T cell recovery or change in diversity
Our study population had a wide range of baseline CD4+ T cell counts (203–759 cells/mm3) and included individuals with heterogenous ages (21–61 years old) (Table 1). Because these subjects had untreated HIV-1, their baseline CD4+ T cell counts were taken to be reflective of their nadir CD4+ T cell counts. Nadir CD4+ T cell count is known to be related to degree of CD4+ reconstitution (1,43). We therefore considered the possibility that baseline CD4+ T cell counts were predictive of both the change in total CD4+ T cell count and the change in TCR diversity, thereby driving the correlation of these variables with one another. However, in this cohort, we found no correlation between baseline CD4+ T cell count and change in CD4+ T cell count (Fig. 4A).
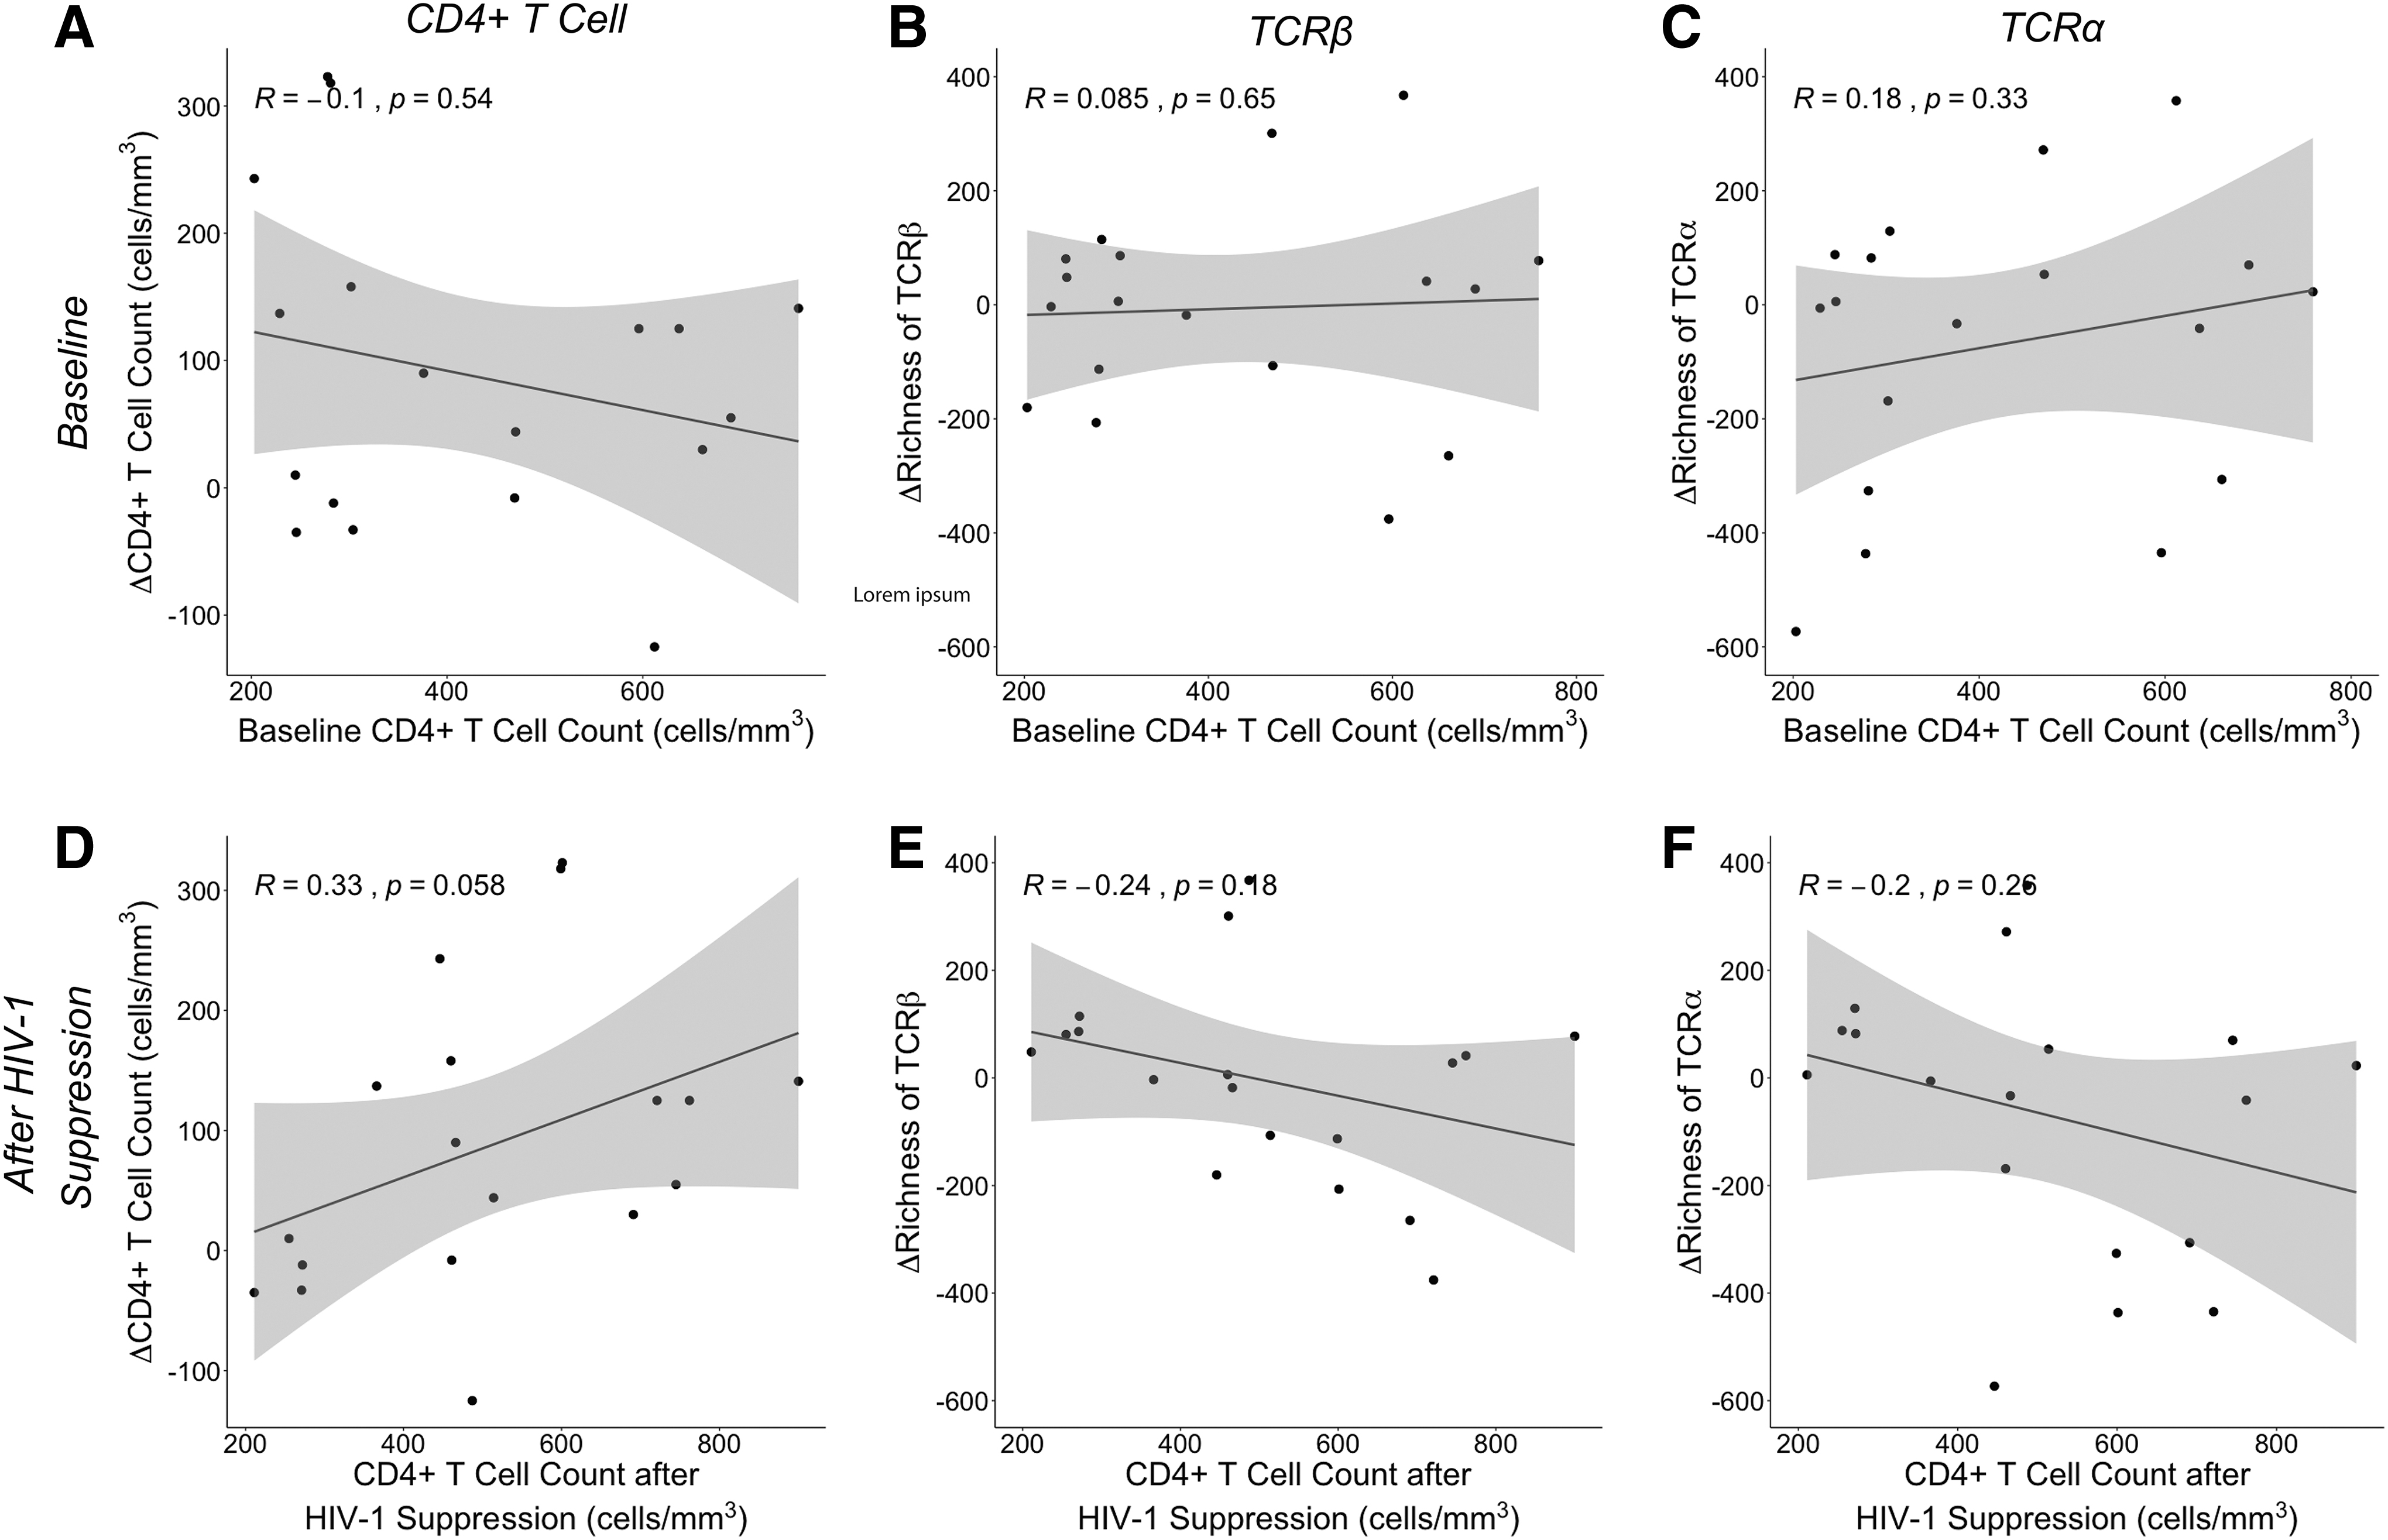
Change in CD4+ T cell counts and TCR richness as a function of absolute CD4+ T cell counts. The change in CD4+ T cell count from baseline to after HIV-1 suppression for each participant (n = 18) was plotted against the absolute CD4+ T cell count at baseline
We similarly observed no association between baseline CD4+ T cell count and change in TCR diversity (Fig. 4B, C and Supplementary Fig. S3A, B). We also found no association between CD4+ T cell count after HIV-1 suppression and change in CD4+ T cell count (Fig. 4D), and no association between CD4+ T cell count after HIV-1 suppression and change in diversity (Fig. 4E, F and Supplementary Fig. S3C, D), indicating that neither initial nor postsuppression CD4+ T cell counts were related to changes in activated TCR repertoire diversity. Instead, over this interval of 7–25 weeks of HIV suppression, it was the change in CD4+ T cell count that was correlated with change in activated TCR repertoire diversity (Fig. 3 and Supplementary Fig. S2A, B, D).
Similarly, age can affect both CD4+ T cell recovery following initiation of ART (28) as well as T cell repertoire diversity (17,27). We therefore examined whether age in our participants could explain our observed association between magnitude of CD4+ T cell recovery and change in activated CD4+ T cell diversity. We found no correlation between age and change in diversity (Supplementary Fig. S6A, B) or between age and CD4+ T cell recovery (Supplementary Fig. S6C).
Decreases in HCV RNA levels do not correlate with CD4+ T cell recovery or change in diversity
All subjects received a single dose of pegylated IFN-α2b at the beginning of the study as part of a previously published investigation into IFN sensitivity and HCV RNA setpoint in HIV-1/HCV coinfection (5). We consequently examined whether differences in HCV RNA decline following IFN treatment played a role in activated CD4+ TCR repertoire diversity or CD4+ T cell recovery following ART. We found no association between the change in HCV RNA level and either change in activated CD4+ T cell diversity (Supplementary Fig. S7A, B) or CD4+ T cell recovery (Supplementary Fig. S7C).
Discussion
As anticipated, we observed statistically significant increases in CD4+ T cell counts with administration of ART over the course of our study. Increases in CD4+ T cell count after HIV-1 suppression were not predicted by the decline in frequency of activated CD4+ T cells, total CD4+ T cell count at baseline (reflective of nadir CD4+ T cell count), or total CD4+ T cell count after HIV suppression. Although nadir CD4+ T cell count has been shown to correlate with CD4+ T cell reconstitution (43), we did not observe this in our study, likely due to the exclusion of individuals with CD4+ T cell counts <200 cells/mm3 (median CD4+ T cell count was 423 cells/mm3). In addition, subjects were on ART for 4–6 months so may not have reached their plateau CD4+ T cell counts.
However, we detected a correlation between a loss in activated CD4+ TCR diversity and the rise in CD4+ T cell count. Decreases in activated CD4+ TCR diversity were associated with a rise in CD4+ T cell count of ∼36–82 cells/mm3. These findings suggest that suppression of HIV replication by ART reduces nonspecific T cell activation and/or restores relatively specific activated T cell clones, findings that contribute to our understanding of the pathogenesis of HIV-1 in HIV-1/HCV coinfected individuals.
We found similar results when we performed subsampling of the sequencing data to control for variability in depth of sequencing. However, association between change in CD4+ T cell count and change in Shannon Diversity at the TCR β chain failed to reach statistical significance in the subsampled analysis.
We suspect that the minor differences between the richness (Fig. 3) and Shannon Entropy (Supplementary Fig. S2) analyses arose because of differences in how richness and entropy are measured. Richness is calculated by counting the total number of distinct TCR clonotypes without accounting for the frequency at which clonotypes are present. In contrast, Shannon Entropy measures the number of distinct clonotypes (richness) weighted by the abundance of each clonotype. Shannon Entropy therefore emphasizes the evenness of clonotype distribution, such that many different clonotypes with equal abundance generate a higher diversity estimate than the same number of clonotypes with unequal abundances.
Immunologically, Shannon Entropy is highest when all clonotypes are present at the same abundance and lowered when there is selective expansion of individual clonotypes. Since richness is not affected by evenness, it is not diminished when certain clones are more expanded than others (i.e., in response to specific antigenic or nonspecific stimulation). Consequently, richness is a more sensitive measure of the variety of TCR specificities present. Similarly, we found that changes in other common measures of clonality (TRBV/TRAV gene usage, TRBJ/TRAJ gene usage, and CDR3 length) as well as amino acid usage at aligned positions in CDR3 did not correlate with CD4+ T cell recovery, likely because they are less sensitive measures of diversity than the more explicit measure of clonotype number (richness) that we employed.
One explanation for our findings is greater reduction in nonspecific CD4+ T cell activation among participants with the most robust CD4+ T cell recovery. HIV-1 infection fosters CD4+ T cell activation and depletion (49). Coinfection with HCV has been shown to amplify CD4+ T cell activation (2,14,34). Treatment with ART and resultant HIV-1 suppression is associated with reductions in the proportion of activated T cells, despite overall CD4+ T cell expansion (7,36). Our data may indicate that a loss of nonspecific activation, and consequently a reduction in activated CD4+ T cell diversity, is predictive of more robust CD4+ T cell recovery. The increase in activated CD4+ diversity observed in participants with minimal CD4+ T cell recovery may suggest that some individuals continue to have ongoing nonspecific CD4+ T cell activation in the weeks following HIV-1 suppression, hindering immune reconstitution. It is interesting that the magnitude of decline in frequency of activated CD4+ T cells was not correlated with observed increases in total CD4+ T cell counts after ART, indicating that a decrease in activated CD4+ TCR diversity may be a more sensitive measure of reduction in nonspecific T cell activation than a decrease in activated CD4+ T cell frequency.
Another, nonmutually exclusive, possibility is that more robust CD4+ T cell reconstitution may be accompanied by expansion of antigen-specific activated CD4+ T cell clones. Expansion of a few clones that dominate the activated CD4+ T cell compartment might result in a reduction of diversity. CD4+ T cell reconstitution has been shown to result in expansion of antigen-specific CD4+ T cells targeting chronic or opportunistic pathogens (23,39,53). Unfortunately, we were not able to identify pathogen-specific T cell responses in this study, but future work with greater depth of TCR sequencing would be an important next step to explore this question more fully. In addition, since we employed RNAseq of bulk T cells, it was necessary to study TCR β and TCR α chains separately. Further experiments using single-cell RNAseq would enable pairing of α and β chain data.
We have shown that after HIV-1 suppression in individuals with HIV-1/HCV coinfection, a reduction in the diversity of activated CD4+ T cells is associated with robust early reconstitution of the CD4+ T cell compartment. This may reflect an overall decrease in dysfunctional nonspecific immune activation resulting in reduction in diversity of activated CD4+ T cells. It may also indicate preferential expansion of activated pathogen-specific CD4+ T cell clones.
Important next steps include measuring diversity of the activated CD4+ repertoire over time as CD4+ reconstitution continues, determining if similar changes in TCR diversity occur in HIV-1 monoinfection, and exploring changes in the frequency of pathogen-specific T cell clones with deeper TCR sequencing. In addition, we focused in this study on changes in diversity within activated CD4+ T cells; however, exploration of changes in diversity within all CD4+ T cell subsets would complement our findings.
Finally, this study provides correlative data, given ethical and practical constraints inherent in performing a human trial. We aim to offer reasonable potential interpretations about the relationships between HIV-1 suppression with ART, activated CD4+ T cell diversity, and total CD4+ T cell recovery, but cannot exclude the possibility that other factors may drive or influence our results. We examined factors that we had reason to believe might affect either CD4+ T cell recovery, diversity, or both. These included subject age as well as HCV RNA response to a single dose of pegylated IFN-α2b administered at the start of the study. Neither of these variables correlated with CD4+ T cell recovery or diversity. However, we were unable to assess unmeasured variables, such as duration of infection with either HIV-1 or HCV, which could have affected our results.
Furthermore, it is worth noting that our study population was predominantly male and of Black race, which could limit applicability to women or individuals of other races/ethnicities. Finally, since this was a study of HIV-1/HCV coinfected individuals exclusively, our results may not be applicable to HIV-1 monoinfection. Definitively establishing the role that HCV co-infection may have in driving our results would require further study with an HIV-1-monoinfected control group.
Footnotes
Authors' Contributions
J.R.B., S.C.R., A.B., and D.L.T. conceived and designed the experiments. R.E.-D. and A.B. performed the experiments. N.E.S., R.E.-D., C.V., and H.P. analyzed the data. A.S. and S.J.W. provided expert guidance. N.E.S., J.R.B., S.C.R., A.B., D.L.T., and C.V. wrote and edited initial drafts. All authors reviewed and edited the article.
Author Disclosure Statement
No competing financial interests exist.
Funding Information
This work was supported by National Institutes of Health (NIH) grant R37 DA 013806, R01 AI 116868, R01 DA 016078, UM1-AI-068613, T32 AI007291-27, and the Johns Hopkins Institute for Clinical and Translational Research (ICTR), which is funded, in part, by grant no. UL1 TR 000424–06 through a Clinical and Translational Science Award (CTSA) from the National Center for Advancing Translational Sciences (NCATS), a component of the NIH, and NIH Roadmap for Medical Research.
Supplementary Material
Supplementary Figure S1
Supplementary Figure S2
Supplementary Figure S3
Supplementary Figure S4
Supplementary Figure S5
Supplementary Figure S6
Supplementary Figure S7
References
Supplementary Material
Please find the following supplemental material available below.
For Open Access articles published under a Creative Commons License, all supplemental material carries the same license as the article it is associated with.
For non-Open Access articles published, all supplemental material carries a non-exclusive license, and permission requests for re-use of supplemental material or any part of supplemental material shall be sent directly to the copyright owner as specified in the copyright notice associated with the article.