
Abstract
Diagnosing HIV-associated neurocognitive impairment in most high-burden, but resource-constrained, settings is difficult due to the unavailability of specialist neurologists and neuropsychologists in primary health care centers. New tests that are easy to perform, based on virological and host immune response biomarkers, may be valuable in the diagnosis of HIV-associated neurocognitive disorder. The receiver operator characteristic curve analysis was used to investigate the diagnostic accuracy of threshold/cutoff concentrations for the peripheral lymphocyte proviral load and plasma biomarkers as diagnostic candidates for neurocognitive impairment in 133 HIV-infected individuals, using global deficit scores as the clinical gold standard. Forty-five (33.83%) of the participants had HIV-associated neurocognitive impairment, with 17.29% being mildly impaired and 16.54% moderately impaired. IL-2 had the best performance as a diagnostic tool for neurocognitive impairment with sensitivity of 67% and specificity of 52%, while the lowest performance was IL-6 with 65% sensitivity and 39% specificity. MIP-1α had the highest precision for the cutoff value, as indicated by the narrow 95% confidence interval (CI) (2.23–3.27), followed by IL-2 with 95% CI (3.02–5.12). RANTES had least precision, as shown by the widest 95% CI (135–9,487.61). For clinical markers of HIV diagnosis and monitoring, the lymphocyte proviral load cutoff value of 145 genome copies/million cells had the highest accuracy with 60% sensitivity and 51% specificity. The plasma viral load had an imperfect balance of 46% sensitivity and 78% specificity. The study demonstrated low to medium diagnostic accuracy of plasma cytokine biomarker cutoff values for defining neurocognitive impairment in people living with HIV.
Introduction
Studies have shown that HIV-associated neurocognitive disorder (HAND) pathogenesis is determined by a complex interplay between cellular targets, viral factors, and the immune response (7). HIV entry into the brain and infection of susceptible cells such as macrophages, microglia, and astrocytes result in uncontrolled release of cellular neurotoxins and proinflammatory cytokines. Active replication of HIV in the brain releases viral proteins such as gp 120, Tat, Nef, and Vpr, which function as neurotoxins. Together with inflammatory cytokines, viral proteins promote neuronal apoptosis and cell death, inhibition of axonal growth, neural dysfunction, astrocyte necrosis, and increased permeability of the blood–brain barrier (13,18). Hence, there is a diagnostic and disease-tracking potential for cytokines in HIV-associated neurocognitive impairment.
Detailed clinical assessments are the gold standard for detecting neurocognitive impairment and have defined the scope and severity of HAND (22,24). Diagnosis of cognitive impairment is performed by HIV neurologists and neuropsychologists (31) after exclusion of other causes. Diagnosing the disease in most high-burden, but resource-constrained, settings is difficult due to the unavailability of these specialists in primary health care centers. New tests that are easy to use, based on host immune response biomarkers, may be valuable in aiding the prognosis diagnosis of HAND. Currently, there is no single laboratory test that is used to reveal the underlying neuropathology of HAND, which can aid in the diagnosis in clinical settings. There is need for balance or complementarity among behavioral, clinical, and biological phenotypes to conclude the diagnosis of HAND. Biomarkers also become useful in the era of antiretroviral therapy (ART) where psychometric performance testing is challenging in identifying patients with more subtle neurocognitive deficits (5).
How cytokine levels impact cognition in HIV infection is not well understood; however, plasma concentrations have been linked to cognitive impairment in other neurological diseases such as multiple sclerosis and Alzheimer's disease where inflammation is thought to worsen the underlying disease process (6,17,34). Can we use plasma cytokine levels to predict the clinical outcome of HAND? It has been demonstrated that inflammatory cytokine levels were significantly higher in patients with HAND and were directly correlated with proviral HIV DNA (1). In the past 25 years, studies have identified several inflammatory pathways that are associated with HIV neuropathogenesis and have established the neuroinflammatory nature of HIV infection in the central nervous system (CNS) (1,11,35). Evidence of CNS-migrating immune cells and inflammatory cytokines produced by them has been demonstrated in HIV-associated neuroinflammation (14). Since plasma concentrations of some cytokines have been shown to be predictive of disease progression, they have the potential to be used as biomarkers in prognosis and clinical management (27). However, the fundamental criteria for use of biomarkers in clinical practice are accuracy and optimal cutoff point selection. In this case, diagnostic accuracy is used to define how close the result of the cytokine biomarker measurement (index test) is to the true clinical disease situation (9). This study utilizes high-throughput Luminex assays and statistical approaches to determine diagnostic accuracy of cytokine cutoff values as well as virological and cellular biomarkers for HIV-associated neurocognitive impairment.
Methods
This study was approved by the Health Research Ethics Committee (HREC) of Stellenbosch University, Ethics Reference #: S17/02/035.
A cross-sectional study was conducted on 133 HIV-positive Xhosa-speaking individuals recruited from primary care HIV clinics in Cape Town, South Africa. Inclusion criteria to participate in the study included the following: (1) age ranging from 18 to 45 years with at least 5 years of formal education, this age range was selected to avoid age-related CNS abnormalities; (2) HIV serostatus, determined by ELISA and then confirmed by Western blot; and (3) HIV-1 RNA for plasma viral load measured by the Abbott m2000sp and the Abbott m2000rt analyzers. Exclusion criteria included any major psychiatric condition that could significantly affect cognitive status; clinical evidence of opportunistic CNS infections (toxoplasmosis, progressive multifocal, leukoencephalopathy, and neoplasms); and current substance abuse or alcohol abuse as defined by the structured interview (26,28,30).
Neuropsychological evaluation
A battery of cognitive tests sensitive to deficits associated with HIV was administered to all participants, as described by Paul et al. (26). Scores for individual cognitive tests were averaged to generate a mean T-score and deficit for each of the cognitive domains and calculate a global T-score and global deficit score (GDS). The GDS was then used to categorize cases as either impaired or unimpaired (15). A GDS of 0.5 or more was regarded as neurocognitive impairment; GDS <0.5 was considered unimpaired, 0.5 ≤ GDS <2 mildly impaired, 2 ≤ GDS <3.5 moderately impaired, and GDS ≥3.5 severely impaired. Categorization/classification for neurocognitive impairment using GDSs was determined in the context of established measures of HIV-associated neuropsychological impairment called the Frascati criteria (7,8).
Plasma cytokine quantification by multiplex bead assay
Cytokine concentrations in plasma samples were determined using a 27-plex kit, as described earlier in our laboratory (29). Quantified cytokines included IL-1β, IL-1α, IL-2, IL-4, IL-5, IL-6, IL-7, IL-8, IL-9, IL-10, IL-12p70, IL-13, IL-15, IL-17, eotaxin, basic FG, G-CSF, GM-CSF, IFN-γ, IP-10, MCP1, MIP-1α, MIP-1ß, PDGF-BB, RANTES, TNF-α, and GM-CSF and VEGF.
Statistical analyses
The STATA statistical package, version 12.1 (StataCorp, College Station, TX), was used for data analysis. The receiver operator characteristic (ROC) curve analysis procedure was used to assess the diagnostic accuracy of individual biomarkers for neurocognitive impairment in HIV infection. For optimal cutoff values and associated sensitivities and specificities, in view of statistical assurance of internal validity, consistency, and reliability, two statistical approaches were deployed—empirical estimation (21) and the Youden Index (10,33). The Liu method maximizes the product of sensitivity and specificity; the Youden method maximizes the sum; and the nearest to (0,1) method finds the cutpoint on the ROC curve closest to (0,1) (the point with perfect sensitivity and specificity). Nonparametric ROC analyses were performed to determine the area under the ROC curve (AUC) and the optimal cutoff point, as defined by Zweig and Campbell (36). Cutoff points for maximum efficiency and based on the ROC curve were also computed.
Results
Cohort participants' neurocognitive profile
The participants had a range of neurocognitive deficits. The majority, 88 participants (66.17%), were unimpaired and 45 (33.83%) were impaired. In the impaired group, 23 (17.29%) were mildly impaired/with asymptomatic neurocognitive impairment, 22 (16.54%) were moderately impaired, and no participants were severely impaired. Figure 1 shows the distribution of participants according to severity of neurocognitive impairment.

Classification and distribution of cases by GDS. GDS, global deficit score.
Cytokine biomarker cutoff/threshold values using the empirical method
The reference diagnosis for HIV-associated neurocognitive impairment was deficit in neurocognitive function measured by GDSs. Cytokine cutoff/threshold levels were then considered as novel diagnosis/classification markers for neurocognitive impairment. Cutoff values for different cytokines differed, as did their specificity and sensitivity, as shown in Table 1. The GM-CSF had the lowest cutoff value of 1.17 pg/mL, and RANTES had the highest cutoff value of 4,676.25 pg/mL. IL-2 had the best performance as a diagnostic tool for neurocognitive impairment with sensitivity, Se (%), of 67% and specificity, Sp (%), of 52%, while IL-6 had the lowest performance with 65% sensitivity and 39% specificity. Of the biomarkers displaying the most accurate cutoff points, MIP-1α had the highest precision for the cutoff value, as indicated by the narrow 95% confidence interval (CI) (2.23–3.27), followed by IL-2 with 95% CI (3.02–5.12). RANTES had the least precision, as shown by the widest 95% CI (135–9,487.61). Figure 2 shows the graphical presentation of cytokine cutoff values and associated specificities and sensitivities.
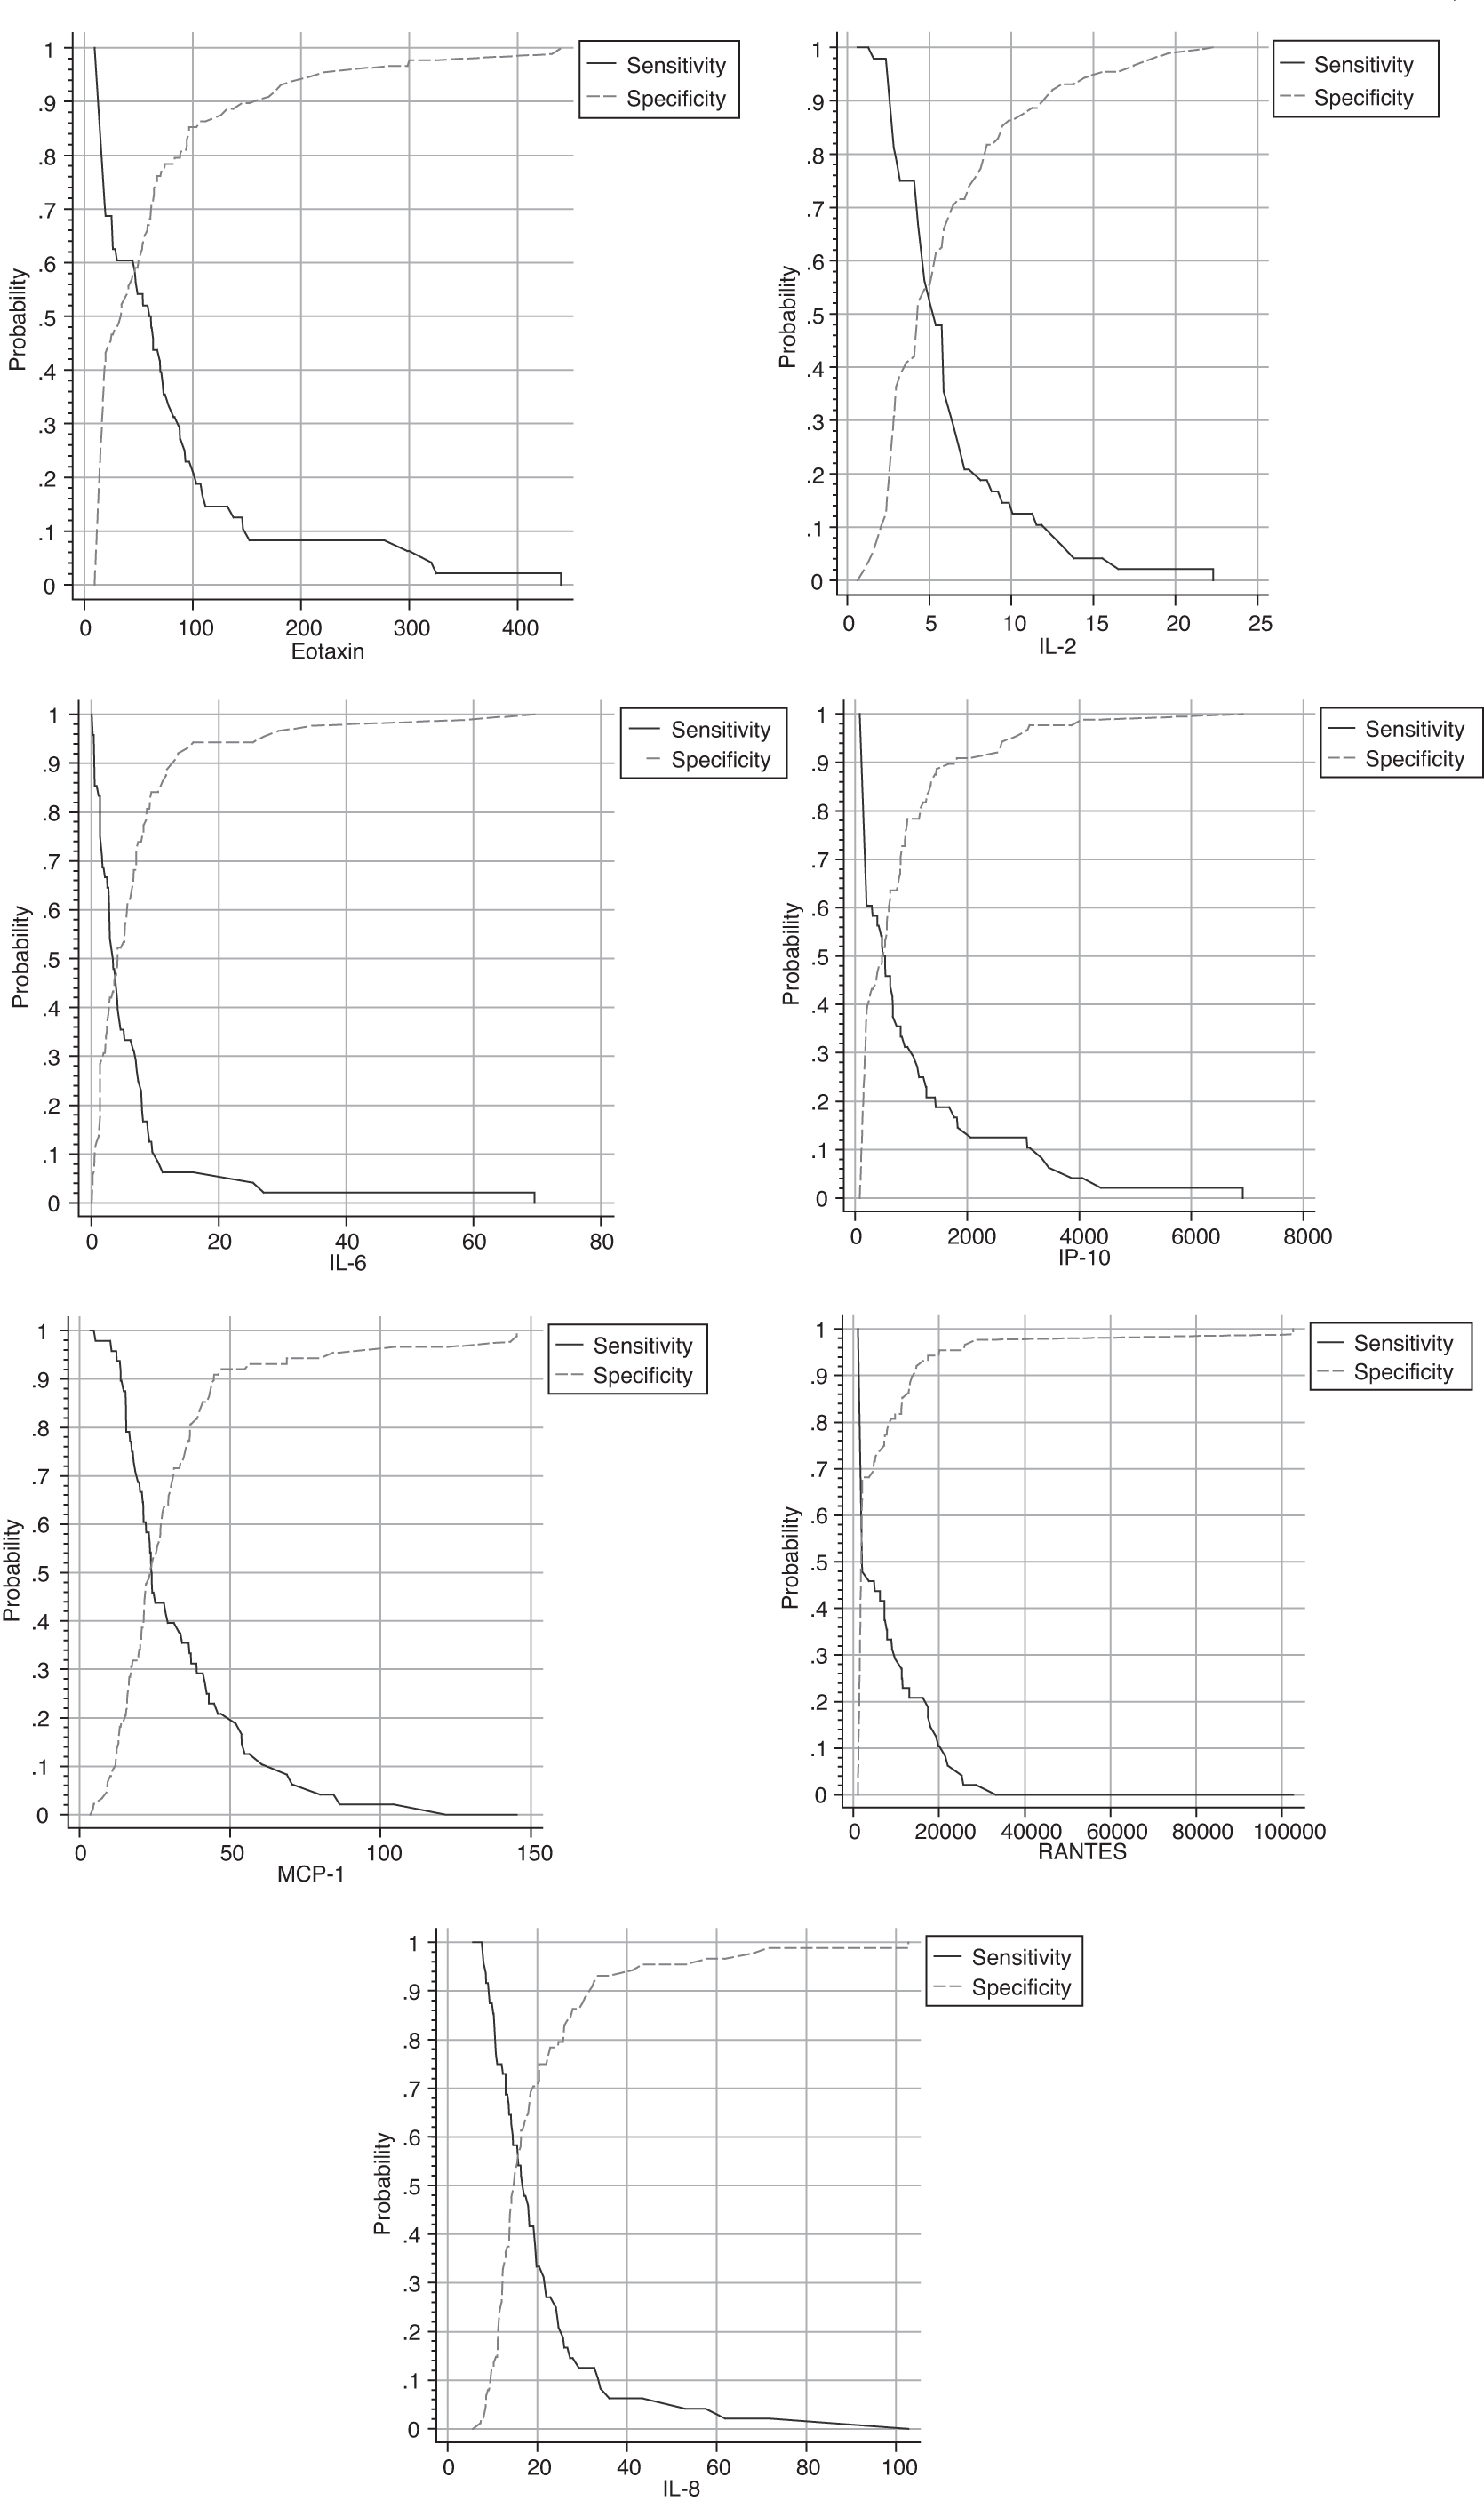
Graphical presentation of optimal cytokine cutoff values and associated sensitivities and specificities.
Accuracy of Different Cytokines as Diagnosis for Neurocognitive Impairment
CI, confidence interval; ROC, receiver operator characteristic; Se, sensitivity; Sp, specificity.
Virological and cellular biomarker cutoff or threshold values
The proviral load had the highest accuracy, as indicated by the balanced sensitivity and specificity, with a cutoff value of 145 copies per million cells. However, the cutoff values were not statistically significant (p = 0.13). The CD8 absolute count cutoff value of 819 cells/μL was significant (p = 0.000), with sensitivity, specificity, and AUC all above 50%, as shown in Table 2 below.
Viral and Cellular Cutoff Values
All cellular and virological biomarkers had an AUC of above 50%, indicating a higher chance for the cutoff value to distinguish between impaired and unimpaired participants. The plasma viral load had the largest AUC of 62%. Figure 3 shows viral and cellular cutoff values and associated specificities and sensitivities.
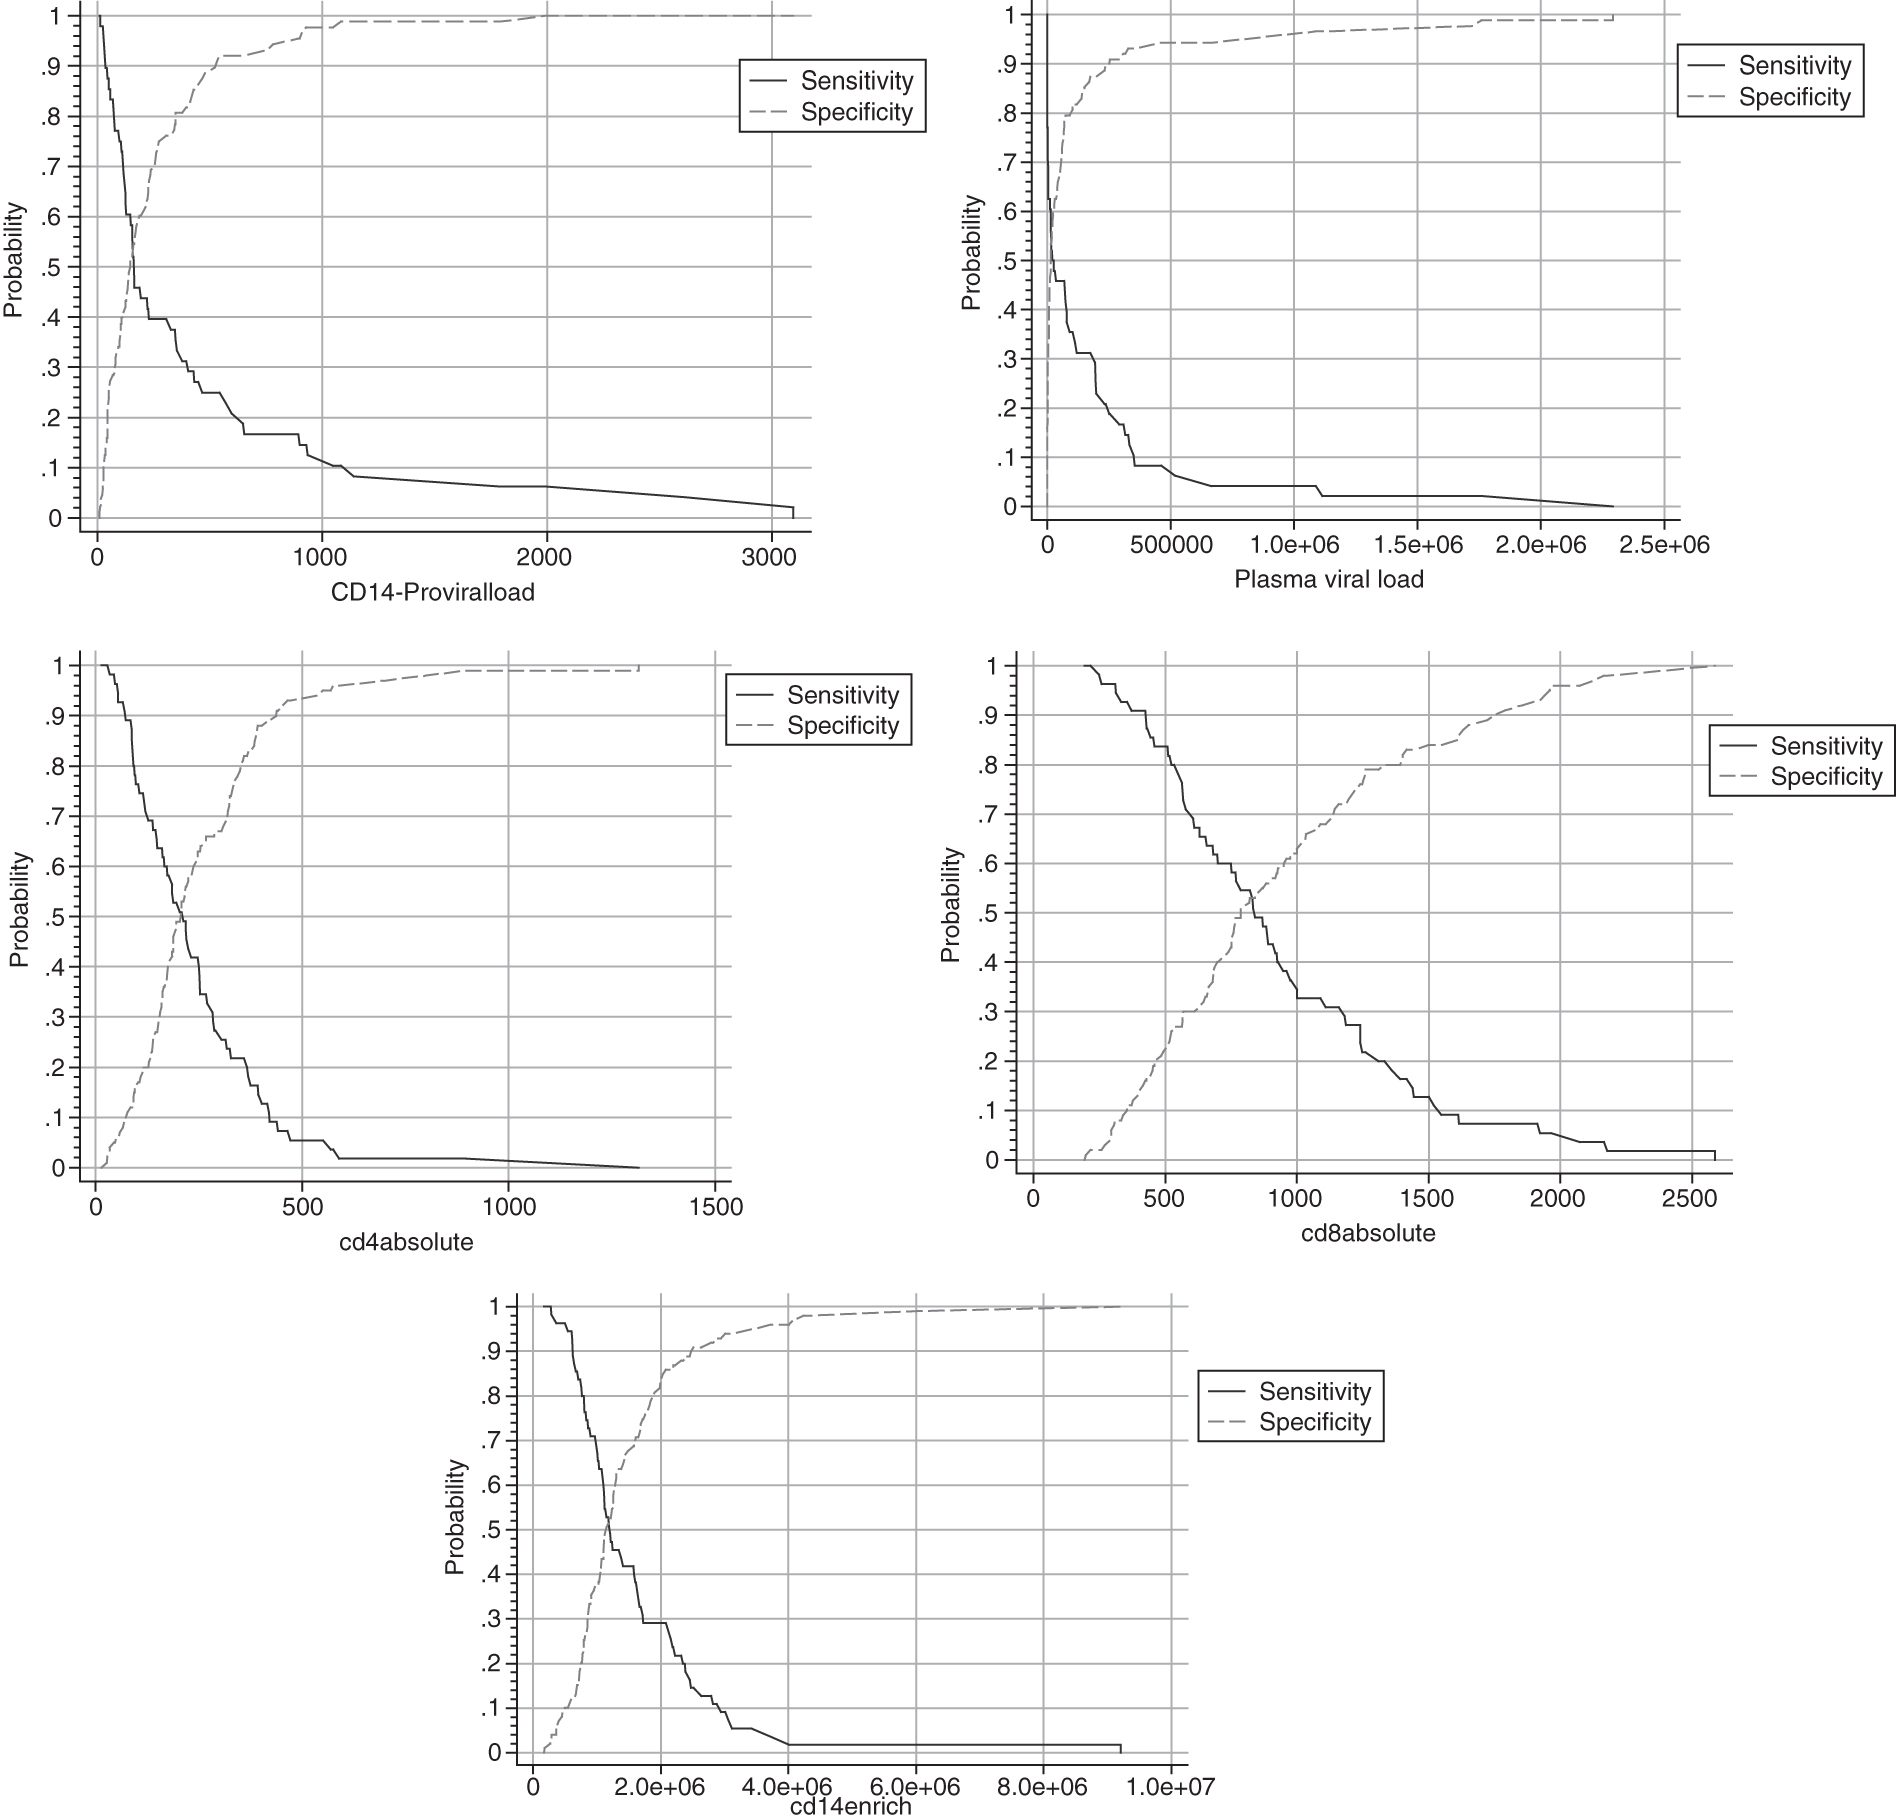
Optimal cutoff values for viral and cellular biomarkers for HIV-associated neurocognitive impairment and associated sensitivity and specificity.
Detailed analysis of the accuracy of tests: Youden analysis
Using the Youden method, the cutoff values and accuracy for the cytokine biomarkers were slightly higher than with the empirical method, but the difference was not significant. However, this analysis determined additional measures such as efficiency, Youden Index (J), likelihood ratios, and predictive values for sample prevalence, as shown in Table 3. Although IL-2 had the highest accuracy, MIP-1α had the highest Youden Index and efficiency, as well as AUC. Using this analysis, variability measures of accuracy (sensitivity and specificity) for different cutoff values adjusted for sample prevalence (Wilson) were determined. IL-2, which had the most accurate cutoff point estimation, had an adjusted sensitivity of 66.7% (95% CI: 52.5–78.3) and specificity of 52.3% (95% CI: 42.0–62.4). Eotaxin, which had a perfect balance between two measures of accuracy for the cutoff value, had sensitivity of 60.4% and specificity of 58.0% (95% CI: 47.5–67.7). IP-10 and GM-CSF had cutoff values with the least accuracy with sensitivity of 45.8% (95% CI: 32.6–59.7) and specificity of 63.6% (95% CI: 53.2–72.9) and sensitivity of 45.8% (95% CI: 32.6–59.7) and specificity of 70.5% (95% CI: 60.2–79.0), respectively. In both empirical and Youden methods, there were no significant differences between the measures of accuracy in the cutoff values. Table 3 shows cutoff values and their associated diagnostic accuracy values using the Youden method.
Analysis of Cutoff Values Using the Youden Method
AUC, area under the ROC curve.
Discussion
Clinical diagnosis of HAND typically requires a battery of lengthy neurocognitive assessments. Although the GDS has demonstrated excellent accuracy for diagnosis of neurocognitive impairment compared with clinical ratings, it has a limitation of multicollinearity with clinical ratings because they are generated from the same neuropsychometric scores (25). These tests are also time-consuming, requiring face-to-face interaction between the assessor and patient. There is need for independent neuropathological biomarkers to avoid this problem. Interpretation of these biomarkers would also be less intensive than GDSs. We evaluated cutoff values for 10 plasma inflammatory cytokine markers and peripheral markers of HIV infection for their diagnostic accuracy using the GDS as a clinical reference diagnostic standard.
Considering virological and immunological parameters, the peripheral monocyte-depleted (CD14−) HIV proviral load demonstrated the highest accuracy. The test had an optimal cutoff/threshold value of 145 genome copies per million cells with balance between sensitivity of 60% and specificity of 51%. Ideally, a good diagnostic test should have both high sensitivity and high specificity (32), but it may not always be the case due to the disease spectrum and patient variability. We identified a low discriminative power of lymphocyte proviral DNA as a diagnostic test for HAND (AUC = 0.56). Our findings have extended the current understanding by exploring the possibility of using the intracellular reservoir as a diagnostic tool for neurocognitive impairment in HIV infection. A previous study conducted using monocyte (CD14+) proviral DNA determined the optimal cutoff value for neurocognitive impairment to be 45 copies per million cells with 86% sensitivity and 70% specificity (31). Both our study and the study by Valcour et al. were conducted in treatment-naive patients and the GDS was used as the reference standard for diagnosis of HAND.
However, the disease spectra, which directly influence diagnostic accuracy, were different in both studies and therefore it is difficult to compare the diagnostic accuracy of the two tests in discriminating HAND patients. The seemingly low diagnostic accuracy shown in our study may have emanated from a high number of nonimpaired participants and predominantly low to mild disease zone of the spectrum. Diagnostic accuracy of an index test is not constant, but varies across clinical contexts, disease spectra, and even patient subgroups (20). Although the monocyte (CD14+)-derived HIV DNA role in HAND pathogenesis is well established, lymphocytes, including CD4+ T cells, represent the largest peripheral reservoir of HIV DNA (12) and are shown to be predictors of cognitive impairment in HIV infection (15,29). We also believe that therapeutic strategies targeting the largest reservoir would improve clinical outcomes of HAND and therefore may potentially be used in predicting progression or remission of the disease.
Although the plasma viral load threshold value had mild overall discriminative power (AUC = 0.62), it had very low sensitivity of 46%, implying that its ability to correctly identify participants with neurocognitive impairment was not good. Despite low sensitivity, the plasma viral load diagnostic cutoff value was highly specific (78%) and therefore can be important in diagnosis, particularly in cases where treatment has not been initiated. Further studies may be required with higher sensitivity so that a balanced trade-off between sensitivity and specificity for plasma viral load cutoff points suitable for diagnosis is obtained (23).
Cytokines have been implicated in many diseases caused by inflammatory processes, including Alzheimer's disease, where neurological outcomes were found to be associated with abnormal cytokine profiles (2). However, a limited number of studies have investigated clinical cytokine cutoffs to support diagnosis (19). We determined clinical diagnostic cutoff values for 10 plasma proinflammatory cytokines that have shown potential to be predictive of HIV-associated neurocognitive impairment (29). We noted that the diagnostic accuracy of the 10 cytokine biomarkers varied from moderate to low levels. Clinical validity of biomarkers as screening or diagnostic tools is measured by how well they are able to distinguish between those with neurocognitive impairment and those without (16). Our findings indicated that the ability of the 10 cytokines to correctly identify (sensitivity) participants with neurocognitive impairment ranged from 46% to 67% and the ability to identify truly nonimpaired (specificity) participants ranged from 39% to 70%. Our study is one of a few exploratory studies that determined cutoff values for cytokines as a prognosis for HIV-associated neurocognitive impairment.
IL-2 had an optimal cutoff value with a balanced trade-off between sensitivity and specificity for discriminating between impaired and nonimpaired participants. The sensitivity of its cutoff value to separate impaired from nonimpaired participants, although moderately high, was above the rest of the cytokine biomarkers examined. Cytokine levels vary greatly among individuals and their release and effects vary by activating signals; specific cell targets; the physiological environment, for example, serum or plasma state; and fitness levels (4,23). This variability affects both cutoff values and diagnostic accuracy thereof. In our accuracy study, we compared the results of an index test (cytokine cutoff value) and reference test (GDS). The discrepancy between the two is assumed to arise from errors in the index test (cytokine biomarker cutoff). In this case, it is assumed that the GDS is 100% accurate as a clinical reference standard, which rarely holds true in practice. Previous studies showed GDS sensitivity ranging from 60% to 83% and specificity ranging from 77% to 92% (3,25) compared with clinical ratings. Therefore, the accuracy values of cytokine biomarkers may have been underestimated since they can never be deemed to perform better than the reference standard GDS. We recommend that additional studies be conducted on diagnostic accuracy of cytokine biomarkers, comparing with both GDS and clinical ratings, as well as neuroimaging findings.
Interestingly, two markers, RANTES and IP-10, which demonstrated a strong association with neurocognitive impairment in HIV infection (28), had low sensitivity of 46% for both and specificity of 72% and 64%, respectively. Sensitivity and specificity do not depend on the prevalence and thus are considered intrinsic measures of diagnostic accuracy (36). A closer look at the diagnostic cutoff values of IP-10 and RANTES showed that there was high variability, as shown by wide 95% CIs of the cutoff values. Sensitivity and specificity for a quantitative classifier are dependent on the variability of the cutoff value chosen and the spectrum of disease (21). In our study, the clinical reference standard categories ranged from nonimpaired or mildly impaired to moderately impaired (7). This could have also introduced spectrum bias (24) since there was no severe form of neurocognitive impairment in our cohort. Differences in disease severity may lead to different estimates of diagnostic performance of an assay. Therefore, future studies should attempt to include a broader spectrum of cognitive impairment categories.
Cytokine release, concentrations, and subsequent effects on target anatomical sites vary based upon activating signals such as stress, fitness level, nutrition, and the environment (35). Although our recruitment controlled for opportunistic infections that could influence the clinical diagnosis of cognitive impairment and cytokine levels, other variables not investigated in the current study might have impacted cutoff values and related diagnostic accuracy. In addition, diagnostic parameters obtained in this study pertain to treatment-naive individuals. Therefore, they cannot be extrapolated to individuals on combination ART. To consider the potential utility of cytokine cutoff values in defining cognitive impairment in HIV infection, future studies need to be conducted in treated individuals as well.
Besides sensitivity and specificity, other basic statistical and fundamental techniques used in diagnostic testing and medical decision-making, such as predictive values, likelihood ratios, Youden Index, ROC curve, and AUC, were used in this study. A comparison of the empirical method and nonparametric methods showed that cutoff values for cytokines and associated diagnostic accuracy values were almost the same. This indicates that the values were true based on the disease spectrum of neurocognitive impairment and variability in patient cytokine levels. In clinical practice, the clinician/neuropsychologist would want to know how good the test is at predicting neurocognitive impairment. Therefore, we determined the proportion of participants with positive cytokine results and who had a neurocognitive impairment (positive predictive function). Positive predictive values for all the cutoff values were very low, indicating that the tests had low predictive power. Negative predictive values were moderate, ranging from 67% to 74%, indicating that the cutoff values were better at identifying participants without neurocognitive impairment. However, predictive values depend on the prevalence of disease (25) and therefore cannot be generalized to other settings with different disease prevalence, especially if the prevalence does not reflect population prevalence.
Conclusions
The study determined low to medium diagnostic accuracy of plasma cytokine biomarker cutoff values for defining neurocognitive impairment in people living with HIV. IL-2 and lymphocyte proviral load had the highest diagnostic discriminatory ability. Establishing an algorithm combining the biomarkers could improve diagnostic accuracy. Further investigations are needed to generate more data on diagnostic performance of these biomarkers, including in ART-treated individuals. Obtaining sensitive and specific tests for cognitive impairment in HIV infection using cytokines is significant because they are easy to measure. Standard methods are costly as they require highly specialized physicians who are not affordable for clinical diagnosis and monitoring of the disorder in resource-limited settings.
Footnotes
Authors' Contributions
R.H.G., V.R., S.E., and R.H.P were involved in study conception and design. V.R., R.H.P., J.A.J., and S.S. were involved in acquisition of data. V.R., G.N., S.E., R.H.G., and G.B.J. were involved in analysis and interpretation of data. All authors were involved in drafting of the manuscript and critical revision.
Acknowledgment
The authors would like to thank Cladnos Mapfumo for assistance with statistical analyses.
Author Disclosure Statement
No competing financial interests exist.
Funding Information
This study was supported by the Poliomyelitis Research Foundation (PRF: S.E. and V.R.), National Research Foundation (NRF: S.E.), and South African Medical Research Council (SAMRC) Collaborating Centre for HIV-1 Laboratory Research (S.E.).