
Abstract
In this study, B and T lymphocyte attenuator (BTLA) and herpesvirus entry mediator (HVEM) expression on the surface of circulating CD4+ T and CD8+ T cells of patients with chronic hepatitis B (CHB) was investigated to explore their relationship with hepatitis B virus (HBV) clinical parameters. Both BTLA and HVEM were significantly upregulated on CD4+ T and CD8+ T cells of CHB patients compared with healthy controls (p < 0.01). Intriguingly, in CHB patients, the percentage of BTLA expression was positively correlated with that of HVEM (CD4+ T cells: r = 0.5461, p < 0.001 and CD8+ T cells: r = 0.4206, p < 0.01). Moreover, the percentage of BTLA expression was positively correlated with the levels of aspartate aminotransferase (AST) (CD4+ T cells: r = 0.3136, p < 0.05 and CD8+ T cells: r = 0.3159, p < 0.05) and alanine aminotransaminase (ALT) (CD4+ T cells: r = 0.3177, p < 0.05 and CD8+ T cells: r = 0.3311, p < 0.05). At the same time, the percentage of HVEM expression was also positively correlated with AST levels (CD4+ T cells: r = 0.3721, p < 0.05 and CD8+ T cells: r = 0.3325, p < 0.05) and ALT (CD4+ T cells: r = 0.3689, p < 0.05 and CD8+ T cells: r = 0.3476, p < 0.05). However, the percentage of BTLA and HVEM expression did not show significant relevance to HBV viral load. Further study demonstrated that BTLA inhibitory signaling could significantly inhibit T cell proliferation, activation, and cytokine production under optimal T cell receptor signaling (p < 0.05). Thereby, our findings indicate that the increased BTLA and HVEM expression on the surface of CD4+ and CD8+ T cells might represent a certain clinical significance and be involved in CHB progression during T cell exhaustion.
Introduction
CD4
B and T lymphocyte attenuator (BTLA) is identified as an immune checkpoint receptor with similarities to programmed death-1 (PD-1). Different from PD-1 combining with B7 family members, BTLA binds with herpesvirus entry mediator (HVEM), a member of tumor necrosis factor receptor (TNFR) family. The ligation of BTLA with HVEM is the first example of the cross talk between the B7 family and TNFR superfamily (24). BTLA and HVEM are widely and distinctly expressed on many subpopulations of peripheral blood mononuclear cells (PBMCs) (28). BTLA interacts with HVEM in two different ways: the trans action between different cells and the cis acting way on the surface of the same initial T cells (19).
The cytoplasmic region of human BTLA contains three conservative phosphorylation sites: Grb2 combining motif, immunoreceptor tyrosine-based inhibitory motif (ITIM), and immunoreceptor tyrosine-based activation motif (ITSM) (22). The structure of BTLA is consistent with its function as an inhibitory receptor. While binding with HVEM, tyrosine residues in the BTLA cytoplasmic region were phosphorylated by recruiting SH2-containing protein tyrosine phosphatase-1 (SHP-1) and SHP-2 (31). Therefore, the interaction between BTLA and HVEM can drive an inhibitory signaling, which is dominant over HVEM-mediated stimulatory signaling (25) and overexpression of BTLA/HVEM on T cells will contribute to T cell exhaustion (20).
Many reports have described that overexpression of multiple immune checkpoints not only accounts for T cell exhaustion of patients infected with hepatitis B virus (HBV), hepatitis C virus (HCV), and human immunodeficiency virus (HIV) but also inhibits tumor-infiltrating HBV-specific T cells of patients with hepatocellular carcinoma (2,8,16,29). PD-1 and lymphocyte activation gene-3 (LAG-3) are detected with high expression levels on exhausted CD8+ T cells during chronic HBV infection. CD4+ T cell exhaustion is defined by high PD-1 and LAG-3 expression and the loss of helper T cell function in chronic hepatitis B (10). HCV-specific CD4+ T cells of patients with acute infection and chronic HCV infection express high levels of inhibitory receptors, including PD-1 and BTLA (1).
Interestingly, blocking PD-1 and LAG-3 can restore the function of exhausted T cells during chronic HBV infection (3). PD-1 modulation can reverse HIV latency in vitro and clinical trials prove anti-PD-1 therapeutical effect on treating HIV patients (11,14). Therefore, blockade of immune checkpoints is an affirmative therapeutic approach for chronic viral infections (9). For now, we still have obscure prospects of the clinical significance of BTLA and its ligand HVEM on circulating T cells of patients with chronic hepatitis B (CHB). This study focused on the BTLA and HVEM expression levels on the surface of CD4+ T and CD8+ T cells of CHB patients and their correlation with clinic parameters.
Materials and Methods
This study was approved by The Ethics The Affiliated Infectious Hospital of Soochow University. The principles of safety and fairness was fully considered and the recruited subjects were based on the principle of voluntary and informed consent.
Subjects
Forty healthy donors and 44 CHB patients were enrolled in the study. The patients were eligible if they had no evidence of HCV, hepatitis D virus, HIV, and acute hepatitis B infections and combined tumors, autoimmune diseases, alcoholic liver diseases, drug-induced hepatitis, hereditary liver diseases, and other liver diseases. The participants in CHB group did not receive antiviral therapy or other treatment to improve liver function. All healthy donors were negative for viral infection and other diseases. The study was approved by the ethics committee of The Affiliated Infectious Hospital of Soochow University. Informed consent forms were signed by all participants.
Serological and virological profile of hepatitis B viral load and clinical parameters
Serological and virological tests were conducted to determine each HBV marker and liver transaminase levels. Hepatitis B serologic testing measurements by the diagnostic kits (Abbott Ireland, Diagnostics Division, Sligo, Ireland) included hepatitis B e antigen (HBeAg), HBV DNA, aspartate aminotransferase (AST), alanine aminotransferase (ALT), albumin (ALB), and total bilirubin (TBIl) levels. The HBV viral load was measured by HBV LC PCR Kit (Shanghai Shenyou Technology Co. Ltd., Shanghai, China).
Determination of BTLA and HVEM on surface of CD4+ T and CD8+ T cells by flow cytometry
CD3-APC, CD4-FITC, CD8-FITC, and HVEM-PE monoclonal antibodies were purchased from BD Pharmingen (San Diego, CA). The mouse anti-human BTLA mAb (clone 8H9) was generated in our laboratory (28). Phycoerythrin (PE)-conjugated goat anti-mouse IgG was purchased from Immunotech (Marseilles, France). Peripheral blood mononuclear cells (PBMCs) from healthy controls (HC) and CHB patients were isolated by Ficoll and washed by phosphate-buffered saline (PBS). To observe BTLA expression on T cells, mAb 8H9 was first incubated with each sample for 45 min. After being washed carefully with PBS twice, PBMCs were incubated with PE-conjugated goat anti-mouse IgG antibody for 30 min.
After incubating and washing, CD3-APC and CD4-FITC or CD3-APC and CD8-FITC were then added for 30 min. To observe HVEM expression on T cells, CD3-APC, HVEM-PE, and CD4-FITC or CD3-APC, HVEM-PE, and CD8-FITC were incubated with PBMCs together for 30 min. Samples were detected by BD FACSAria (San Jose, CA) and analyzed by FlowJo (San Carlos, CA).
T cell proliferation, activation, and cytokine assay
Human PBMCs were isolated from peripheral blood by Ficoll-Paque Plus (Sigma-Aldrich) density gradient centrifugation. T cells were then purified by positive selection using immunomagnetic beads according to the manufacturer's protocol (MicroBeads, Miltenyi) and passed through a magnetic cell-sorting column (Miltenyi). Purified T cells were stimulated with plate-bound anti-CD3 mAb (0.25, 0.5, 0.75, 1.0, 1.25, or 1.5 μg/mL) and anti-CD28 mAb (2.0 μg/mL) in the presence of anti-BTLA mAb (Clone 7D7) (28) or control IgG (20 μg/mL). After T cells were cultured for 4 days, MTT (3-[4,5- dimethylthiazo-2-yl]-2,5-diphenyl-tetrazolium bromide) was used to measure cell proliferation.
To analyze T cell activation markers CD25 and CD69, T cells were activated by anti-CD3 mAb (0.5 μg/mL) and anti-CD28 mAb (2.0 μg/mL) in the presence of anti-BTLA mAb or control IgG (20 μg/mL). Then T cells were harvested on day 3 and were analyzed by flow cytometry. To determine interferon gamma (IFN-γ) and interleukin-2 (IL-2) production, T cells were stimulated with plate-bound anti-CD3 mAb (0.25, 0.5 or 0.75 μg/mL) and anti-CD28 mAb (2 μg/mL) in the presence of anti-BTLA mAb or control IgG (20 μg/mL). Supernatants were, respectively, collected on day 4 after stimulation and IFN-γ and IL-2 were measured by enzyme-linked immunosorbent assay (ELISA) method.
Statistical analysis
The software GraphPad Prism 6.0 was used for statistical analysis. A two-tailed unpaired Student's t test, Mann–Whitney test, or one-way analysis of variance (ANOVA) was performed as indicated. p < 0.05 was considered significant. Correlation analysis was evaluated by the Pearson's correlation test.
Results
Clinical characteristics of study populations
Forty HC and 44 CHB patients were enrolled. Patient demographics and characteristics are shown in Table 1 (mean ± standard error of the mean), which covered age, sex, HBeAg serostatus, serum HBV DNA concentrations, serum levels of AST and ALT, serum total protein, ALB, and TBIl.
Demographics of Healthy Control Group and CHB Patients
Data were presented as number or mean ± SEM.
ALB, albumin; ALT, alanine aminotransaminase; AST, aspartate aminotransferase; CHB, chronic hepatitis B virus infection; HBeAg, hepatitis B e antigen; HBV-DNA, hepatitis B virus-DNA; HC, healthy controls; NA, not applicable; SEM, standard error of the mean; TBIL, total bilirubin.
The expression levels of BTLA and HVEM were significantly upregulated on the circulating CD4+ T cells of CHB patients
Accumulating data demonstrated that multiple immune checkpoints contributed to T cell functional exhaustion. Since BTLA/HVEM axis can profoundly suppress T cell function, we tried to investigate their expression levels on T cells and the clinical significance in CHB progression.
We determined BTLA and HVEM expression on CD4+ T cell subsets by flow cytometry (Fig. 1A). First, we examined whether age variation had an impact on the expression levels of BTLA and HVEM on CD4+ T cells of healthy donors enrolled in our study since previous studies clarified that BTLA expression levels declined on B cells of the aged (15). The results showed no significant difference between different age groups of recruited healthy donors (p > 0.05) (Fig. 1B, C). However, BTLA and HVEM were significantly upregulated on CD4+ T cells of CHB patients compared with that of HC (p < 0.01) (Fig. 1D, E).
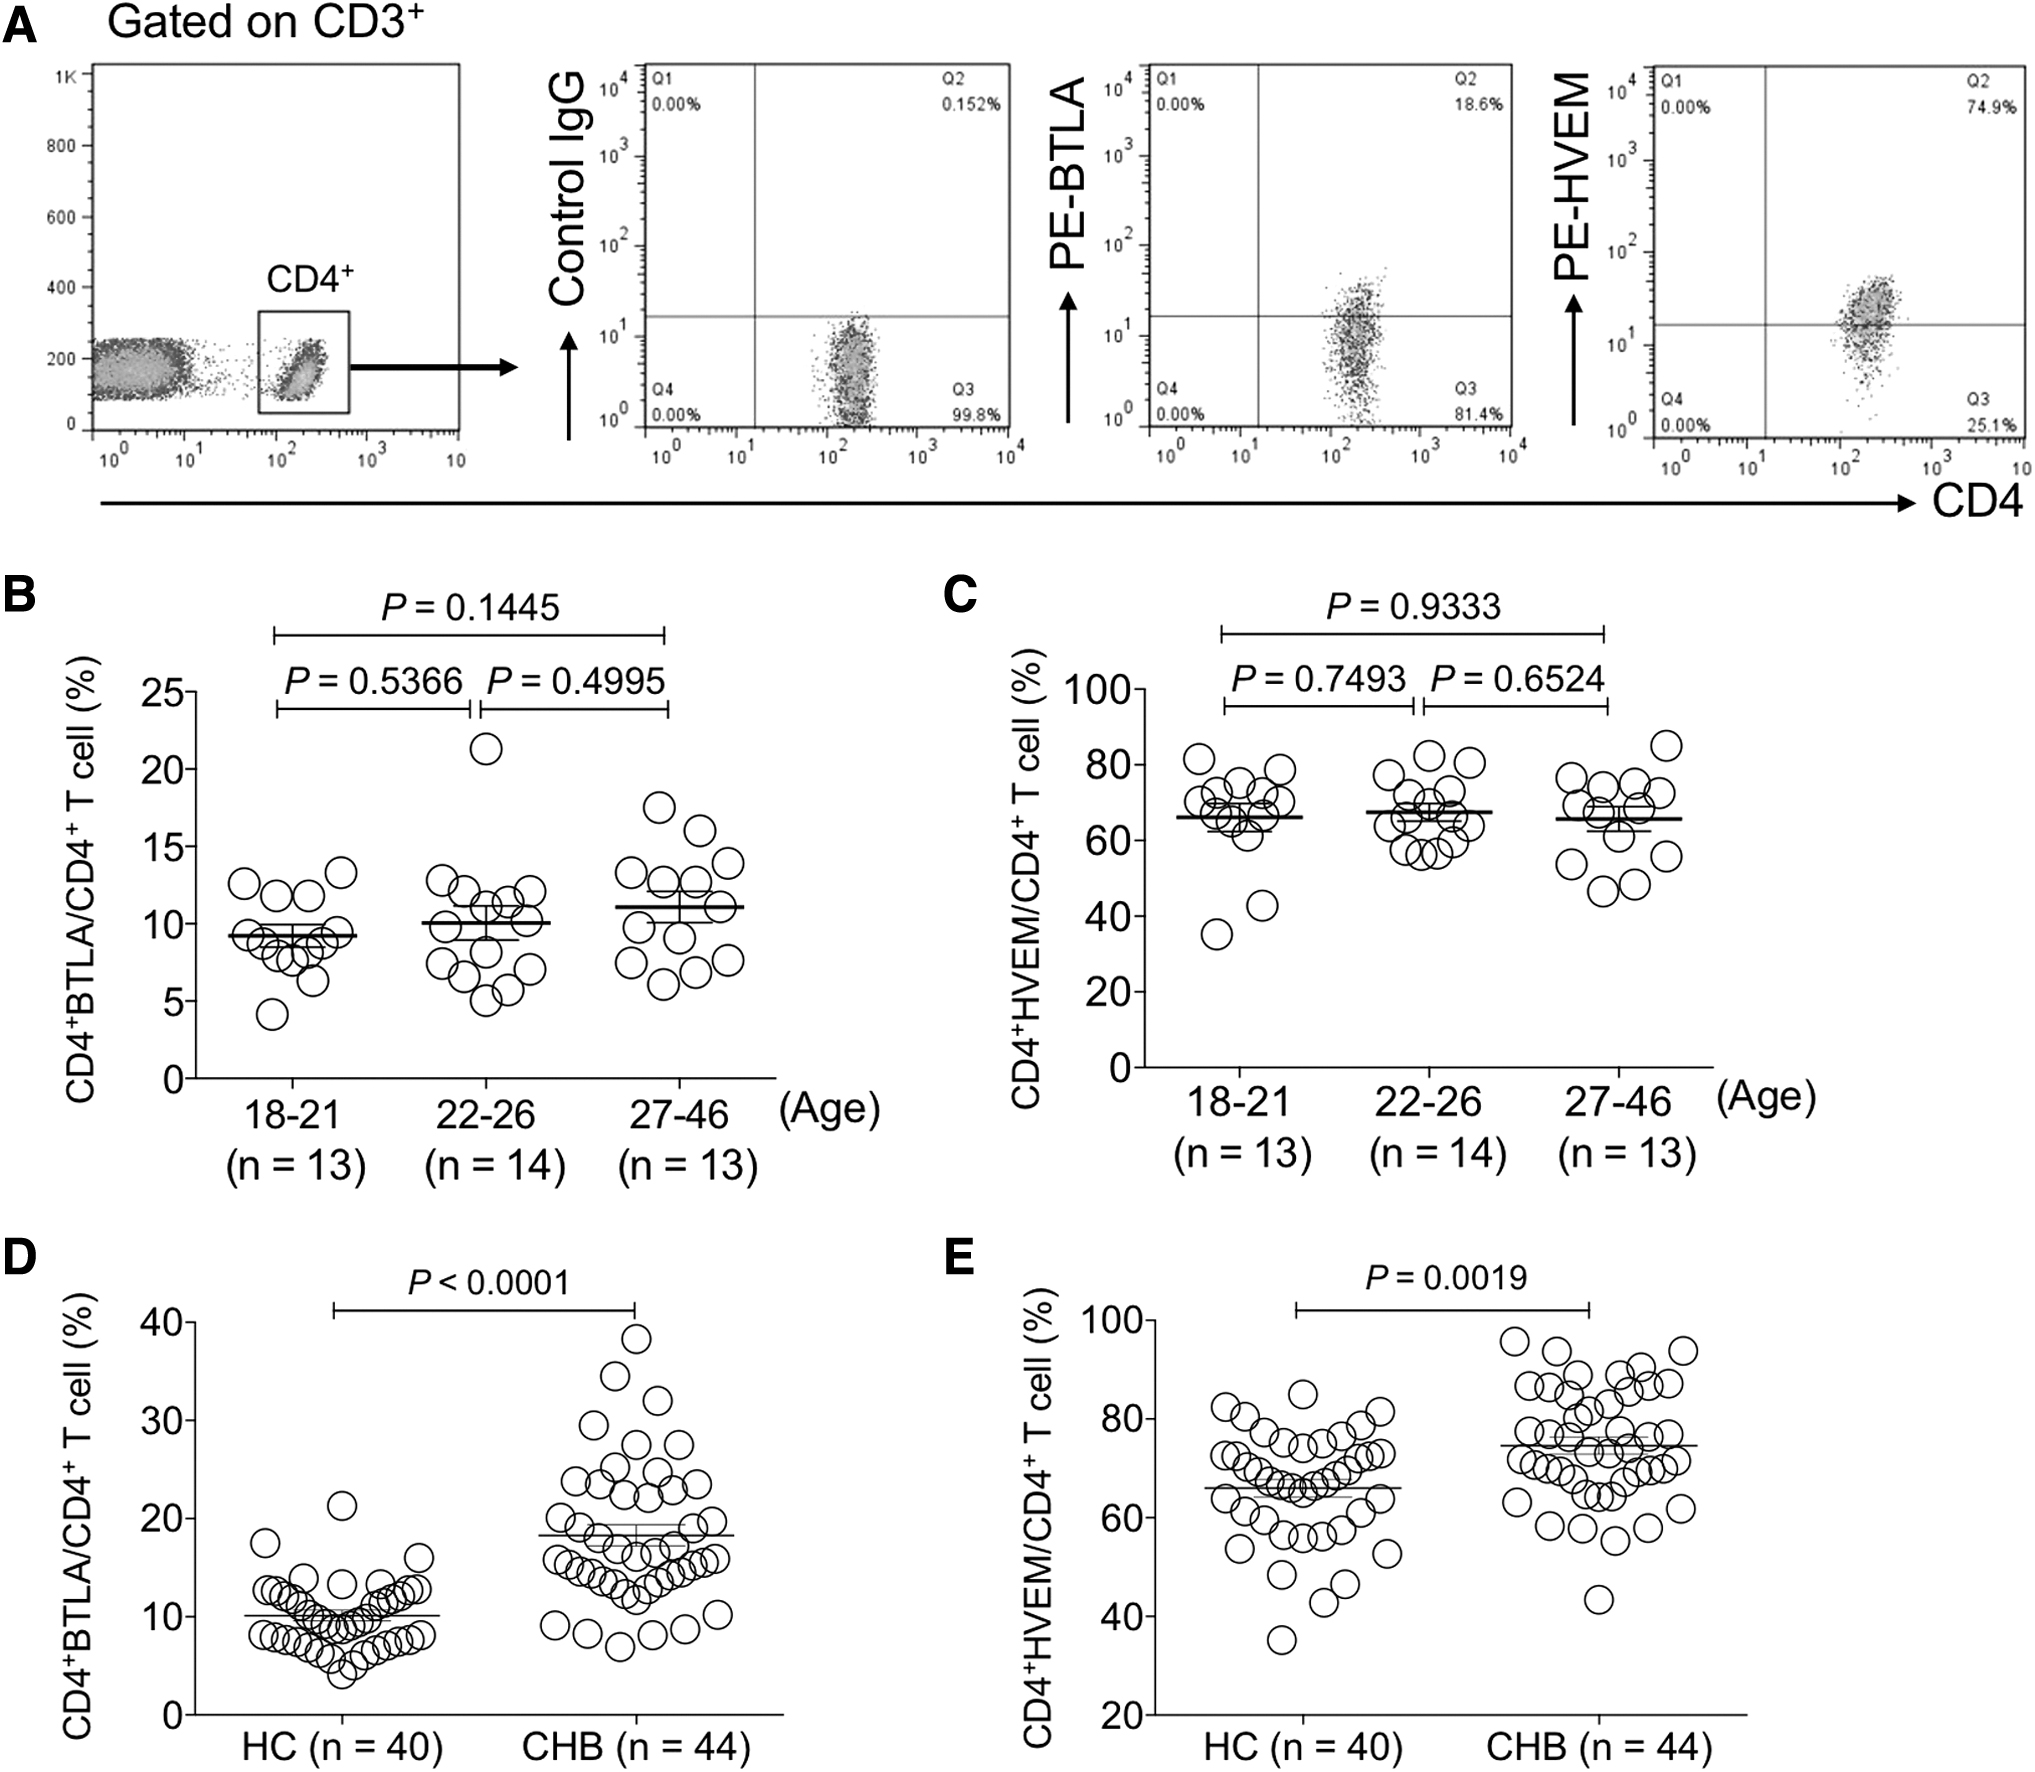
The expression levels of BTLA and HVEM were increased on circulating CD4+ T cells of CHB patients.
Furthermore, we explored whether the expression levels of BTLA and HVEM would change along with HBV viral DNA copies, ALT or AST levels. The results demonstrated that the levels of BTLA and HVEM expression on CD4+ T cells showed no significant difference between CHB patients with serum HBV DNA levels ˂106 copies/mL and those with serum HBV DNA levels ≥106 copies/mL (p > 0.05) (Fig. 2A, B).
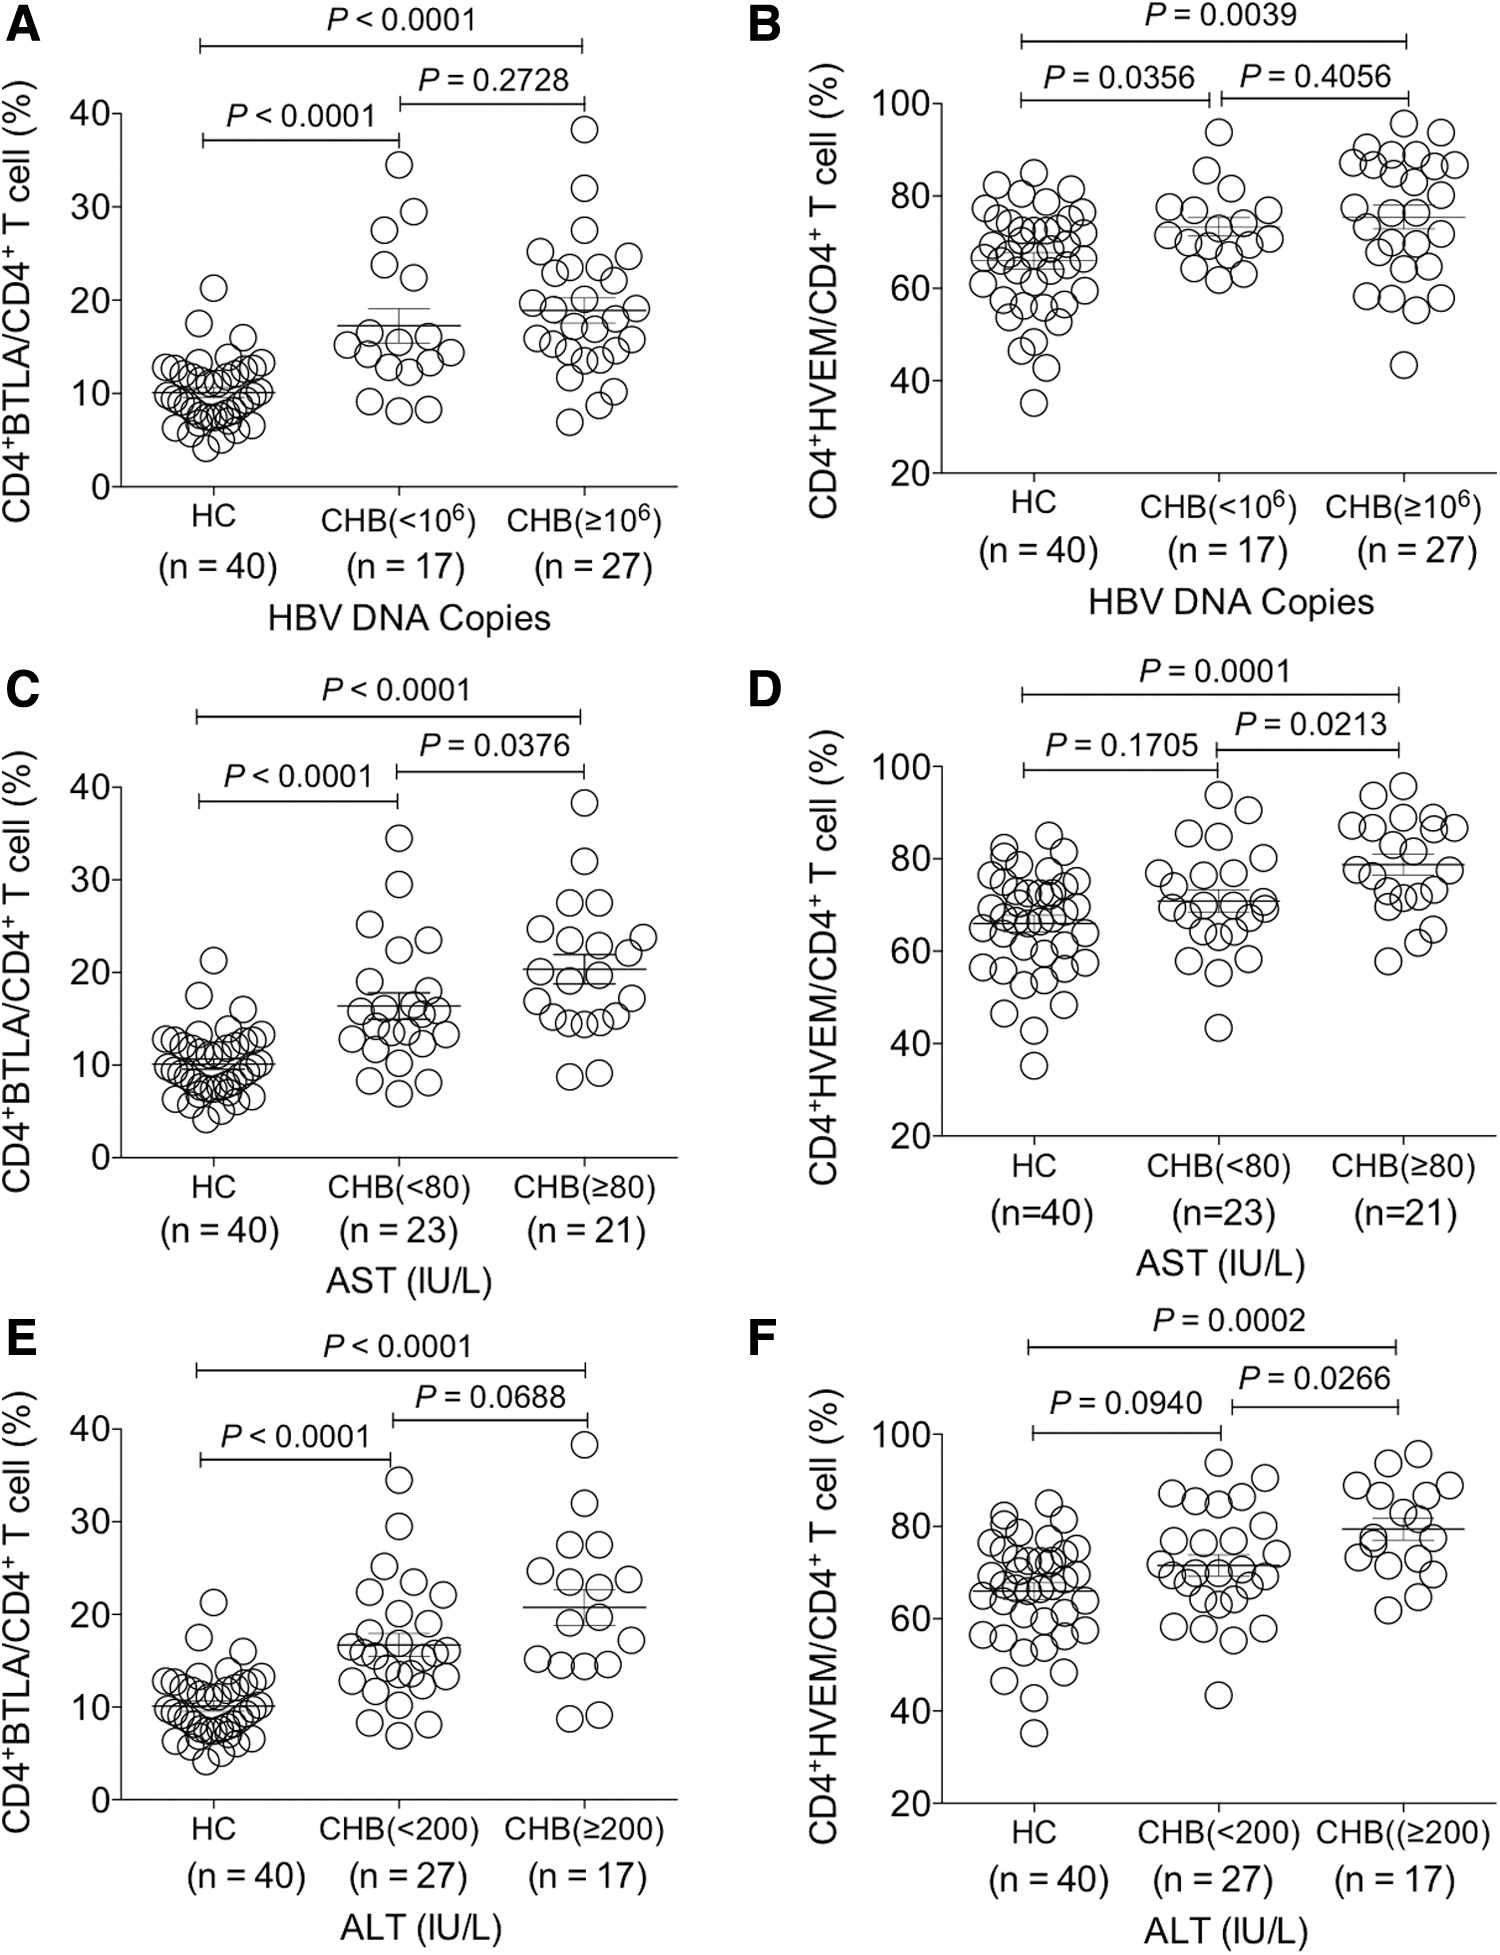
Investigation of the change of BTLA and HVEM expression on circulating CD4+ T cells of CHB patients with different clinical parameters. The comparative analysis of the expression levels of BTLA and HVEM on CD4+ T cells between HBV DNA load
Interestingly, the expression of BTLA and HVEM on CD4+ T cells of the CHB group with AST ≥80 IU/L was both higher than that with AST ˂80 IU/L (p < 0.05) (Fig. 2C, D). At the same time, HVEM was expressed with higher levels on CD4+ T cells of the CHB group with ALT ≥200 IU/L than that with ALT ˂200 IU/L (p < 0.05), while such significant difference was not found for BTLA on CD4+ T cells (p > 0.05) (Fig. 2E, F).
Taken together, the expression levels of both BTLA and HVEM on CD4+ T cells were significantly increased in CHB patients and those with more liver injury presented higher expression levels of BTLA and HVEM.
The expression levels of BTLA and HVEM were significantly upregulated on circulating CD8+ T cells of CHB patients
Furthermore, we performed examination of BTLA and HVEM expression on CD8+ T cells of HC donors and CHB patients through identical gating strategies to CD4+ T cells (Fig. 3A). Similarly, no significant difference of BTLA and HVEM expression on CD8+ T cells was found between different age groups of recruited healthy donors (p > 0.05) (Fig. 3B, C). However, we found that both BTLA and HVEM were significantly upregulated on CD8+ T cells of CHB patients compared with that of HC (p < 0.0001) (Fig. 4A, B).
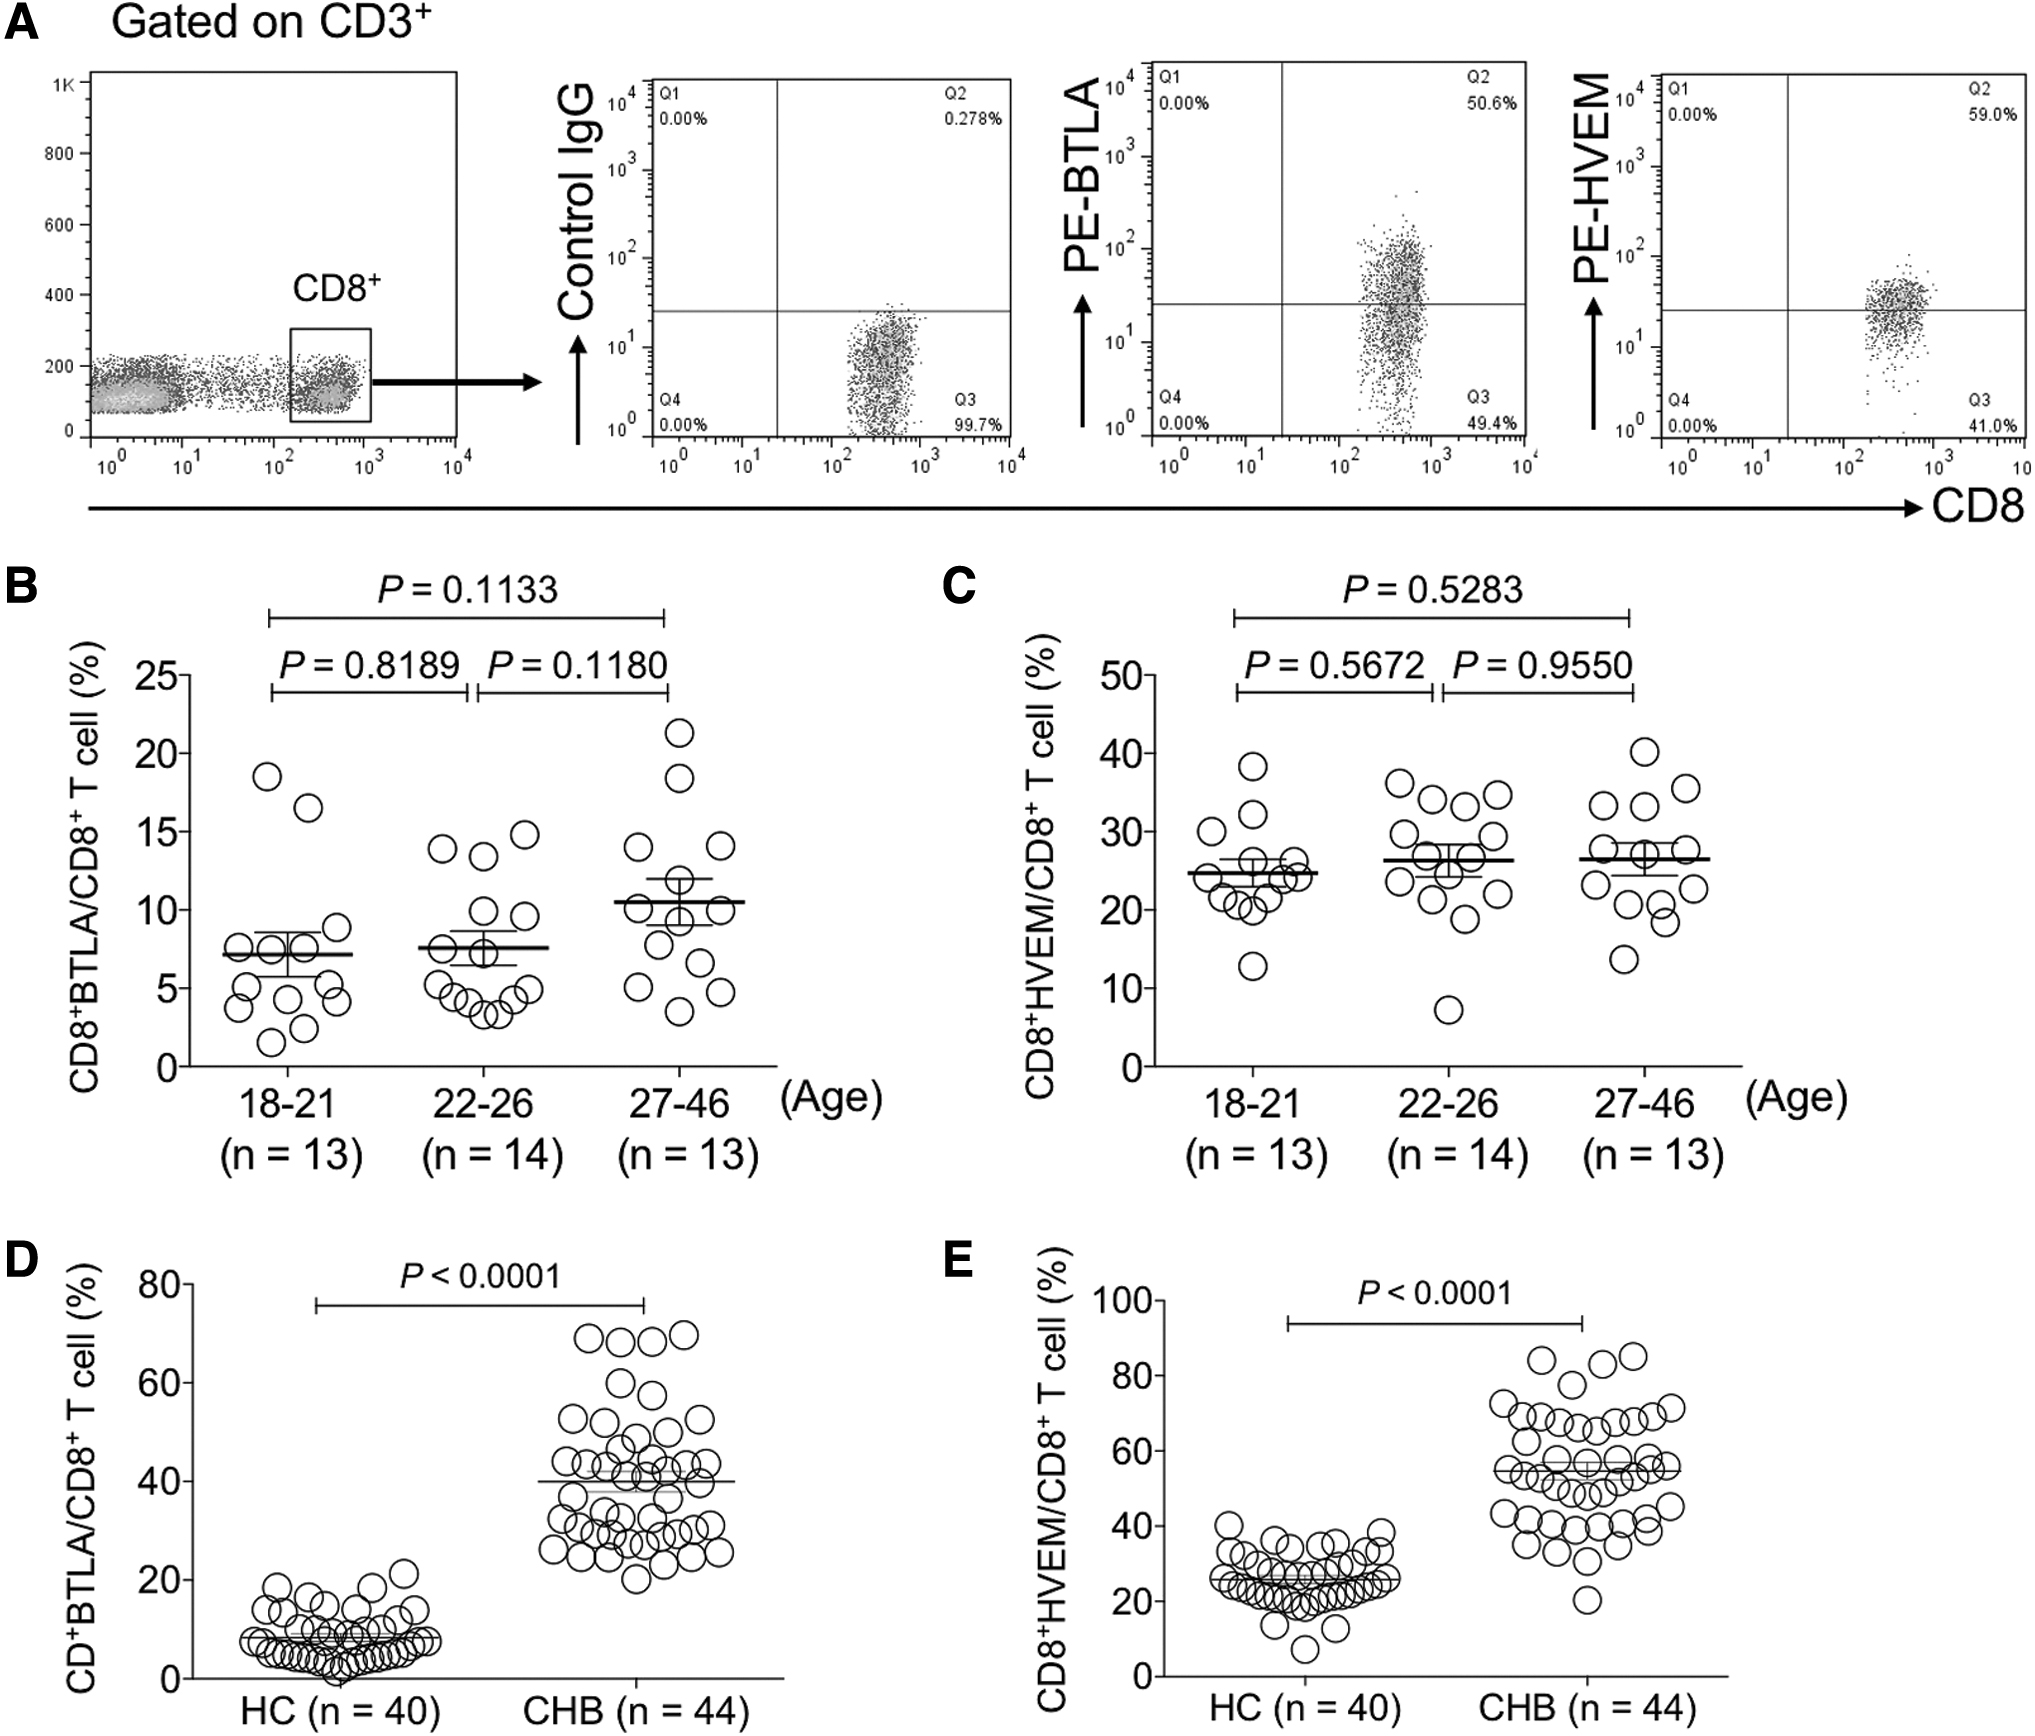
The expression levels of BTLA and HVEM were increased on circulating CD8+ T cells of CHB patients.
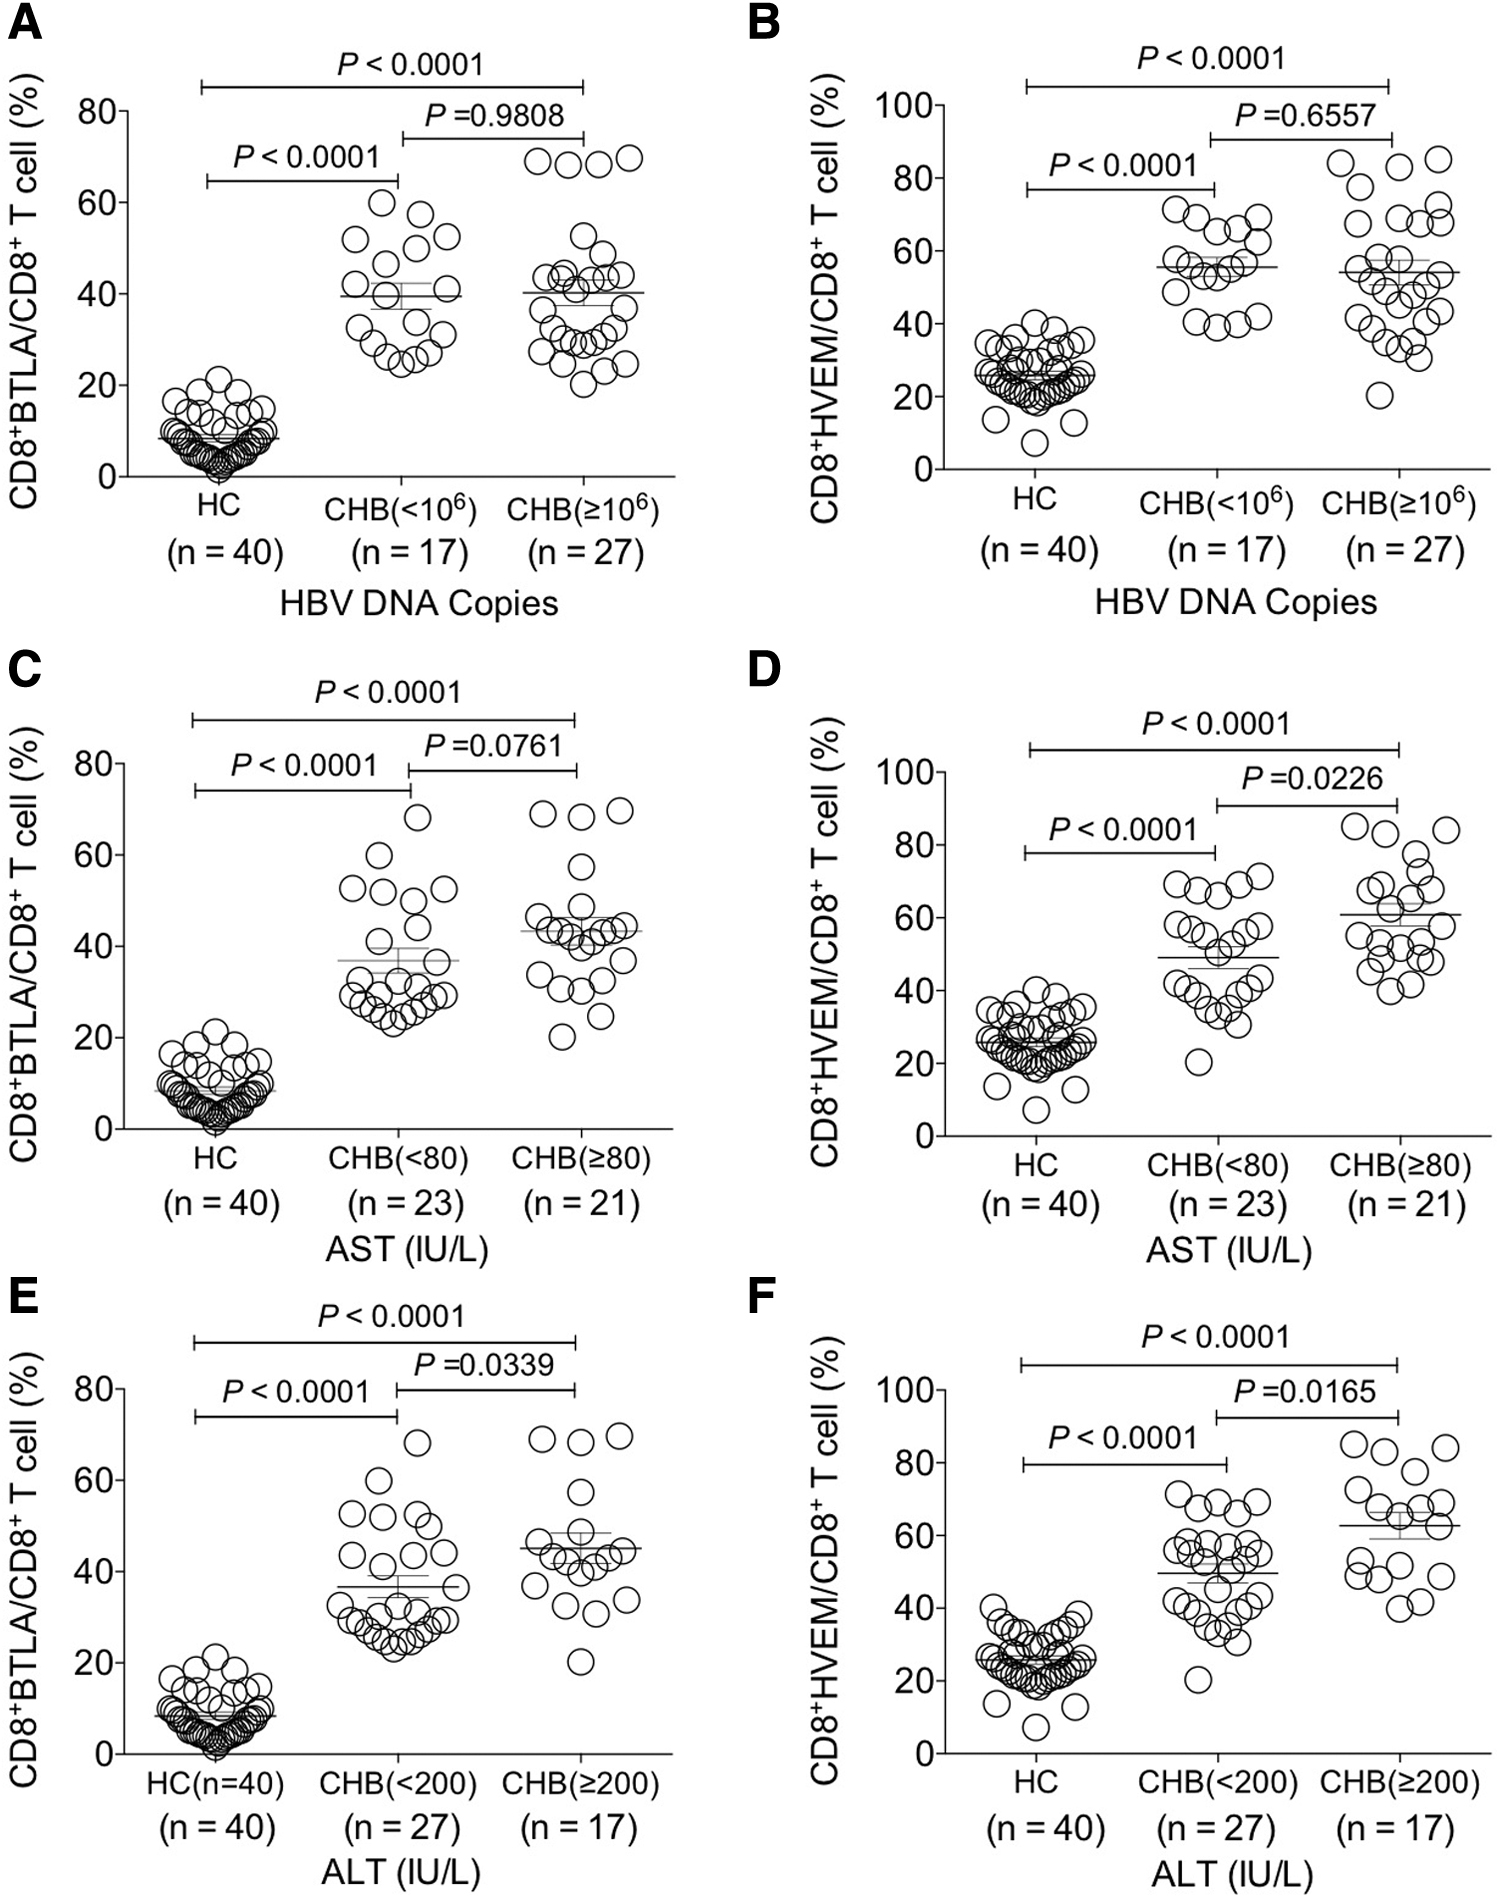
Investigation of the change of BTLA and HVEM expression on circulating CD8+ T cells of CHB patients with different clinical parameters. The comparative analysis of the expression levels of BTLA and HVEM on CD8+ T cells between HBV DNA load
Further analysis revealed that the expression levels of HVEM were significantly higher on CD8+ T cells of the CHB group with AST ≥80 IU/L than those with AST ˂80 IU/L (p < 0.05), but such significant difference was not found for BTLA on CD8+ T cells (p > 0.05) (Fig. 4C, D). Interestingly, the expression levels of BTLA and HVEM on CD8+ T cells of the CHB group with ALT ≥200 IU/L were both higher than that with ALT ˂200 IU/L (p < 0.05) (Fig. 4E, F).
Taken together, the expression levels of both BTLA and HVEM on CD8+ T cells were significantly increased in CHB patients and those with more liver injury presented higher expression levels of BTLA and HVEM.
BTLA expression was positively correlated with HVEM expression on both CD4+ and CD8+ T cells of CHB patients
Since BTLA and HVEM are co-expressed on T cells (25) and they were both upregulated on CD4+ and CD8+ T cells of CHB patients, we sought to investigate the correlation of BTLA and HVEM expression levels. The results demonstrated that there was a strong positive correlation between BTLA and HVEM expression on both CD4+ T and CD8+ T cells (CD4+ T cells: r = 0.5461, p < 0.001 and CD8+ T cells: r = 0.4206, p < 0.01) (Fig. 5A, B), indicating that BTLA/HVEM signaling might play a role in regulating T cell function in manner of synchronous upregulation of receptor/ligand.
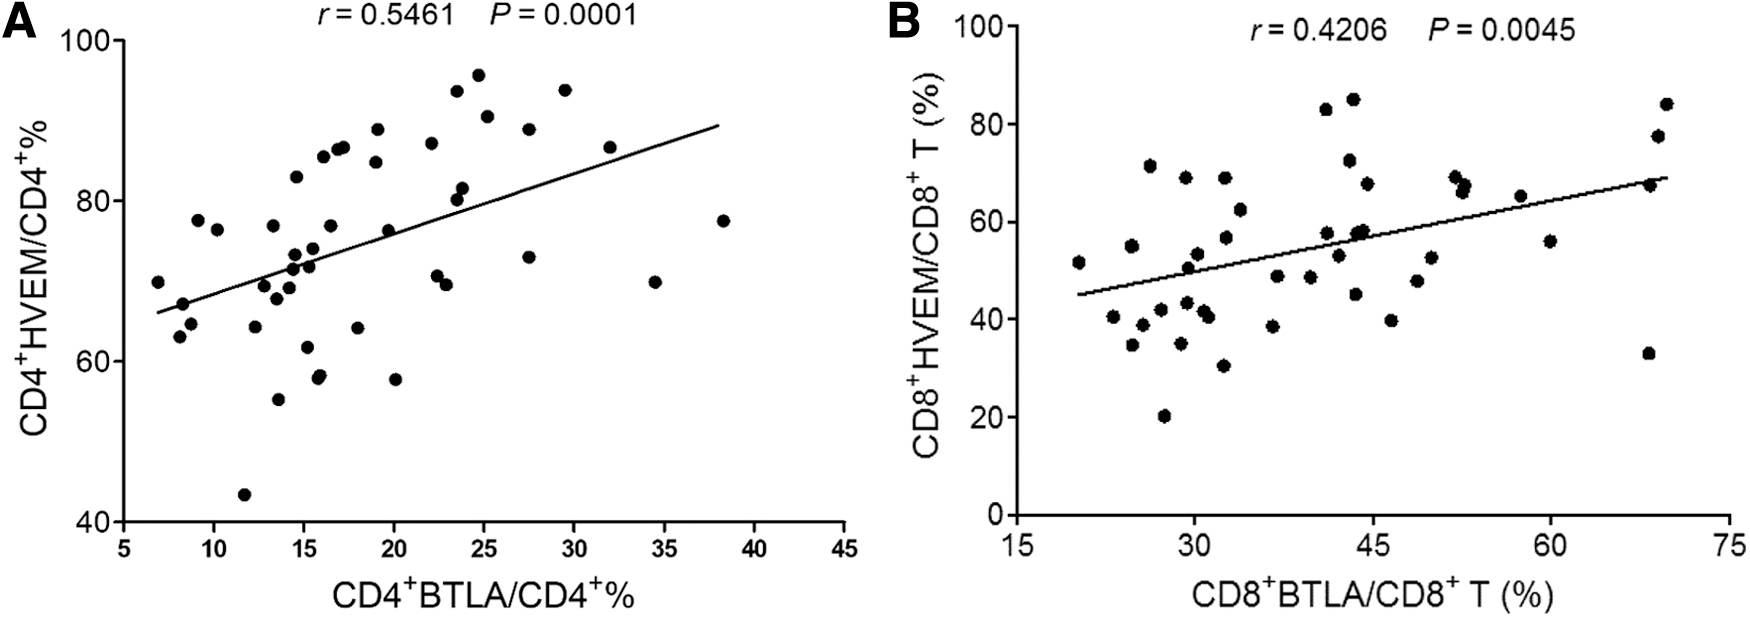
Examination of the correlation between expression levels of BTLA and HVEM on circulated T cells of CHB patients.
BTLA and HVEM were upregulated on activated CD4+ and CD8+ T cells
The immune checkpoints generally keep quiescence or low expression levels in naive T cells and are upregulated after T cell activation to prevent excessive inflammation from damaging normal tissues. Hence, we sought to investigate whether the expression levels of BTLA and HVEM on activated T cells are distinct from that on naive T cells in vitro. Our data demonstrated that BTLA presented a low expression level on naive CD4+ T and CD8+ T cells, but was remarkably increased after T cell activation by plate-bound anti-CD3 and anti-CD28 antibodies (Fig. 6A, B).

Determination of the expression of BTLA and HVEM on naive and activated CD4+ T and CD8+ T cells in vitro. Purified T cells were stimulated with plate-bound anti-CD3 mAb (1.0 μg/mL) and anti-CD28 mAb (2.0 μg/mL). After the T cells were cultured for 3 days, BTLA and HVEM expression were determined on activated CD4+ and CD8+ T cells by flow cytometry. Before T cell activation, BTLA and HVEM expression were measured on naive CD4+ T and CD8+ T cells by flow cytometry.
At the same time, HVEM was also greatly upregulated on activated CD8+ T cells (Fig. 6A, B). Although naive CD4+ T cells constitutively expressed HVEM, the activated CD4+ T cells significantly increased HVEM expression (Fig. 6A). These results indicate that upregulation of BTLA and HVEM on T cell surface of CHB patients might be due to persistent antigen stimulation during CHB infection. However, the underlying mechanism requires further study.
The expression levels of BTLA and HVEM on CD4+ and CD8+ T cells were positively correlated with ALT and AST levels
HBV viral load reflects CHB progression and ALT and AST levels characterize the extent of liver injury. Thereby, we further explored whether the expression levels of BTLA and HVEM were associated with these clinical parameters.
It was found that there was no significant correlation between HBV DNA copies and the expression levels of BTLA on both CD4+ T and CD8+ T cells (CD4+ T cells: r = 0.05753, p > 0.05 and CD8+ T cells: r = −0.1789, p > 0.05) (Fig. 7A, B). Intriguingly, we found that BTLA expression levels on both CD4+ T and CD8+ T cells were positively correlated with ALT (CD4+ T cells: r = 0.3177, p < 0.05 and CD8+ T cells: r = 0.3311, p < 0.05) and AST (CD4+ T cells: r = 0.3136, p < 0.05 and CD8+ T cells: r = 0.3159, p < 0.05), respectively (Fig. 7C–F).
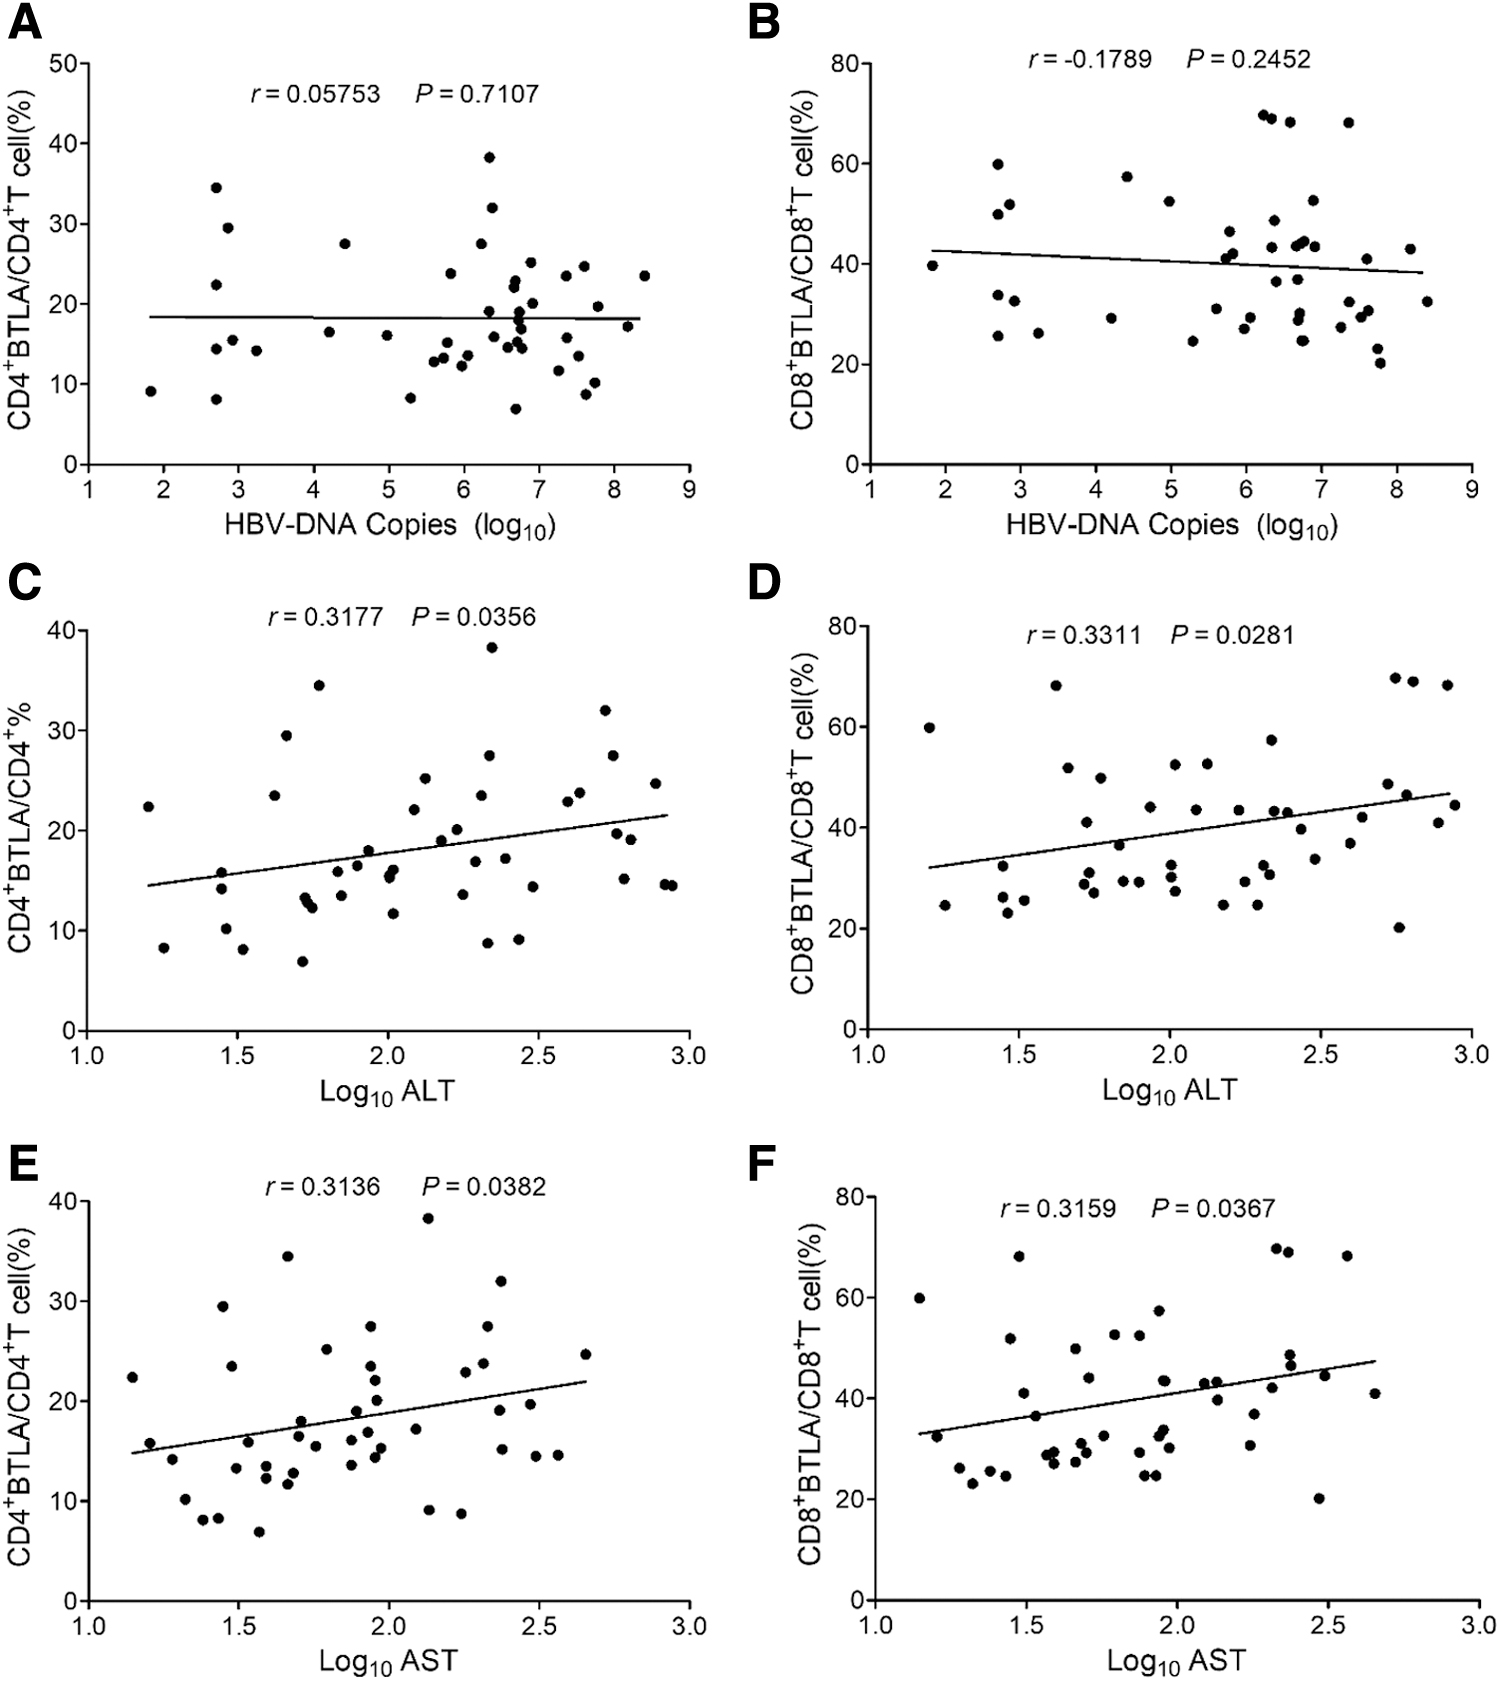
Analysis of the correlation of expression levels of BTLA on the circulated CD4+ T and CD8+ T cells of CHB patients with HBV DNA load and ALT and AST levels from CHB patients.
HBV DNA copies were also not correlated with either HVEM+ CD4+ or HVEM+ CD8+ frequency (CD4+ T cells: r = 0.09628, p > 0.05 and CD8+ T cells: r = −0.1371, p > 0.05) (Fig. 8A, B). However, the expression levels of HVEM on both CD4+ and CD8+ T cells were positively correlated with the levels of ALT (CD4+ T cells: r = 0.3689, p < 0.05 and CD8+ T cells: r = 0.3476, p < 0.05) and AST (CD4+ T cells: r = 0.3721, p < 0.05 and CD8+ T cells: r = 0.3325, p < 0.05), respectively (Fig. 8C–F).
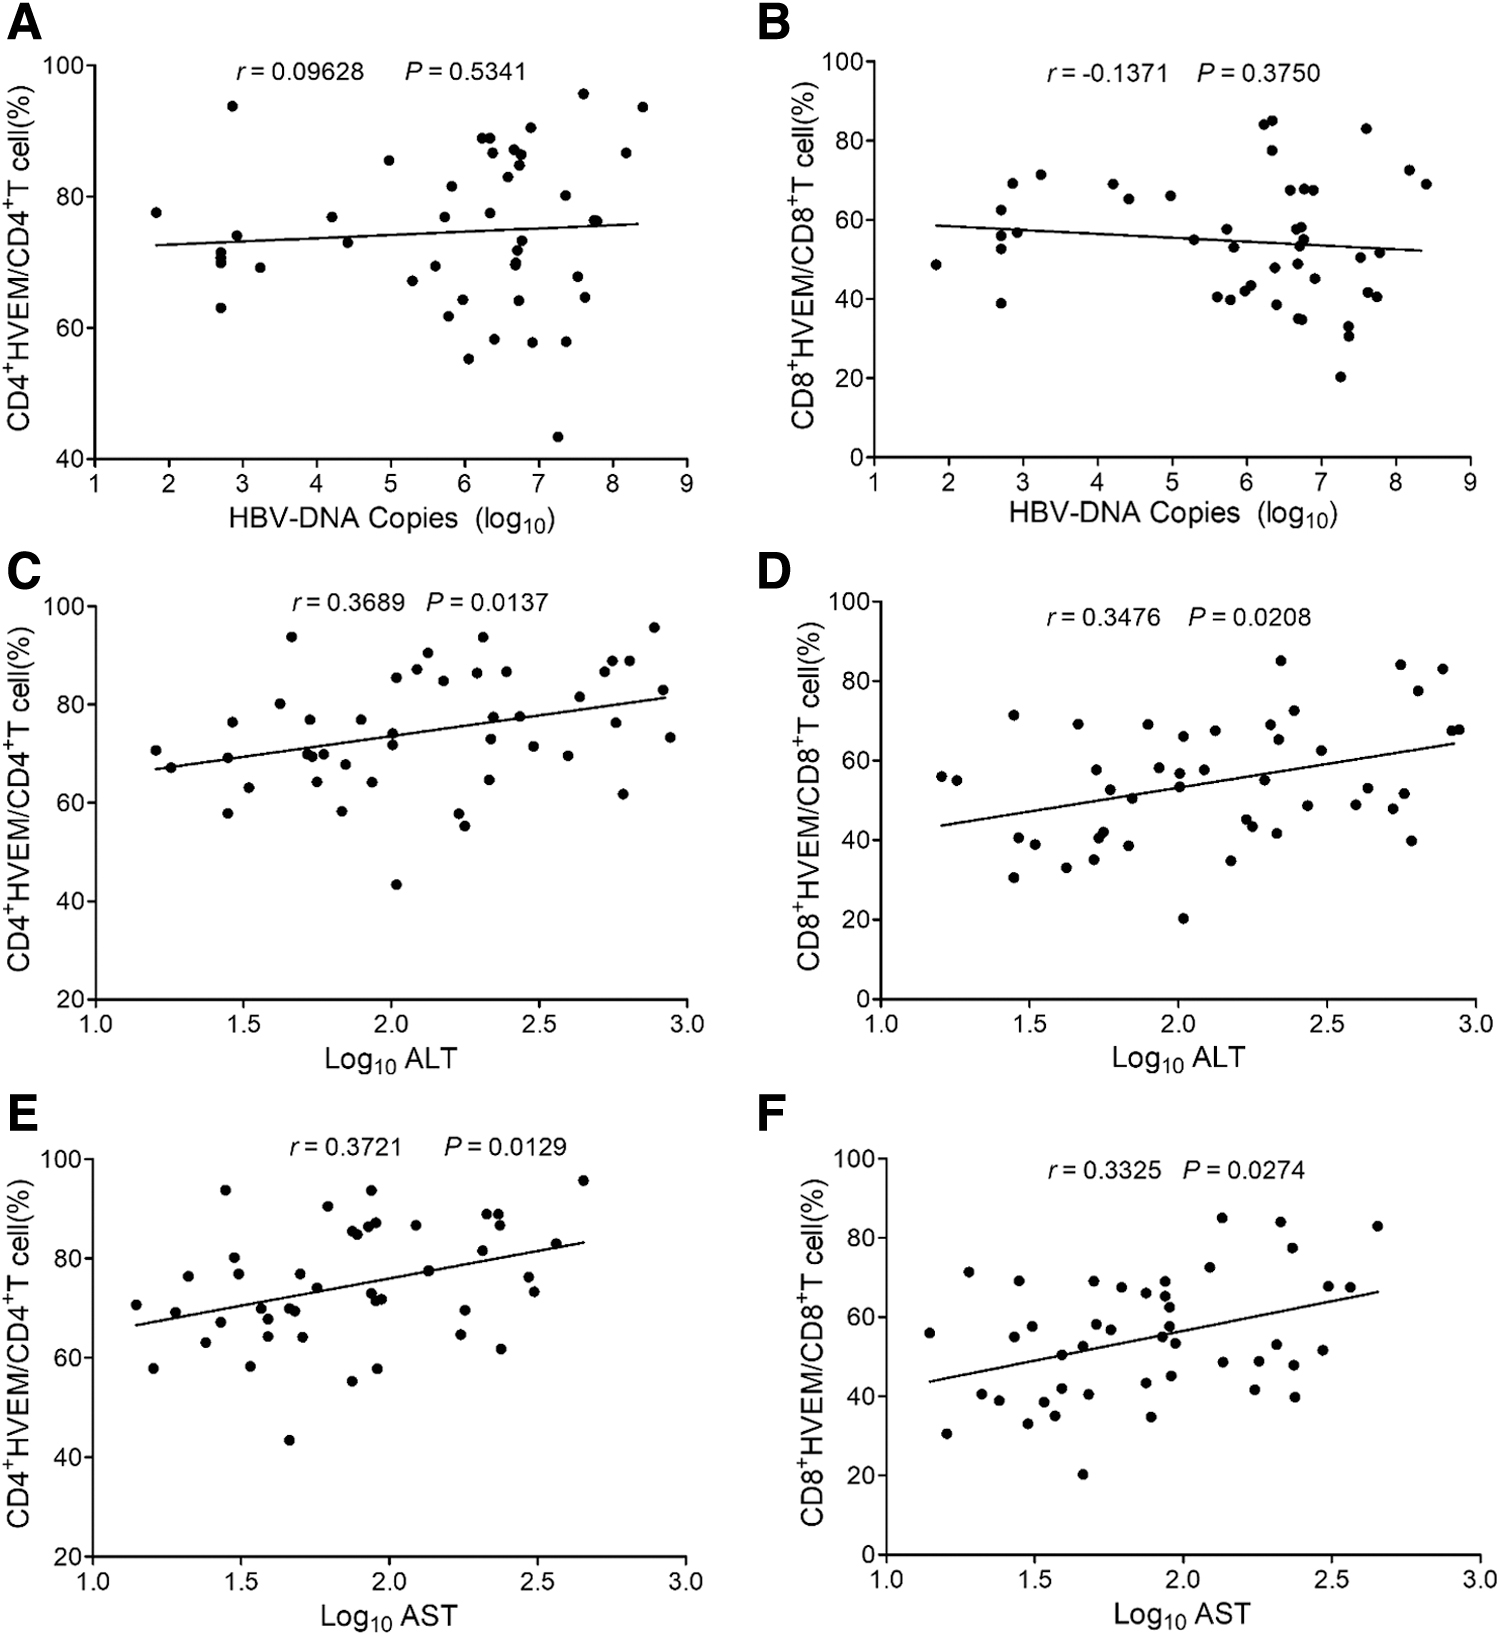
Analysis of the correlation of expression levels of HVEM on the circulated CD4+ T and CD8+ T cells of CHB patients with HBV DNA load and ALT and AST levels from CHB patients.
Taken together, the expression levels of BTLA and HVEM on both CD4+ T and CD8+ T cells were positively correlated with liver injury extent in CHB infection, but not relevant to HBV copies.
BTLA inhibitory signaling suppressed T cell proliferation, activation, and effector cytokine production
In addition, we examined the effect of BTLA signaling on suppressing T cell activation under different T cell receptor (TCR) signaling strength in the presence of CD28 co-stimulatory signaling by using an agonistic antibody to trigger BTLA signaling (28).
The results showed that T cell proliferation was profoundly suppressed by BTLA agonist under optimal TCR intensity, although in the presence of CD28 co-stimulatory signaling (p < 0.05) (Fig. 9A). However, when the strength of TCR signaling increased, the inhibition of T cell proliferation by BTLA agonist vanished (Fig. 9A). These results indicated that BTLA inhibitory signaling could antagonize optimal intensity of TCR signaling as well as CD28 co-stimulatory signaling, but could not play an effective inhibitory role in T cell proliferation under strong TCR signaling.
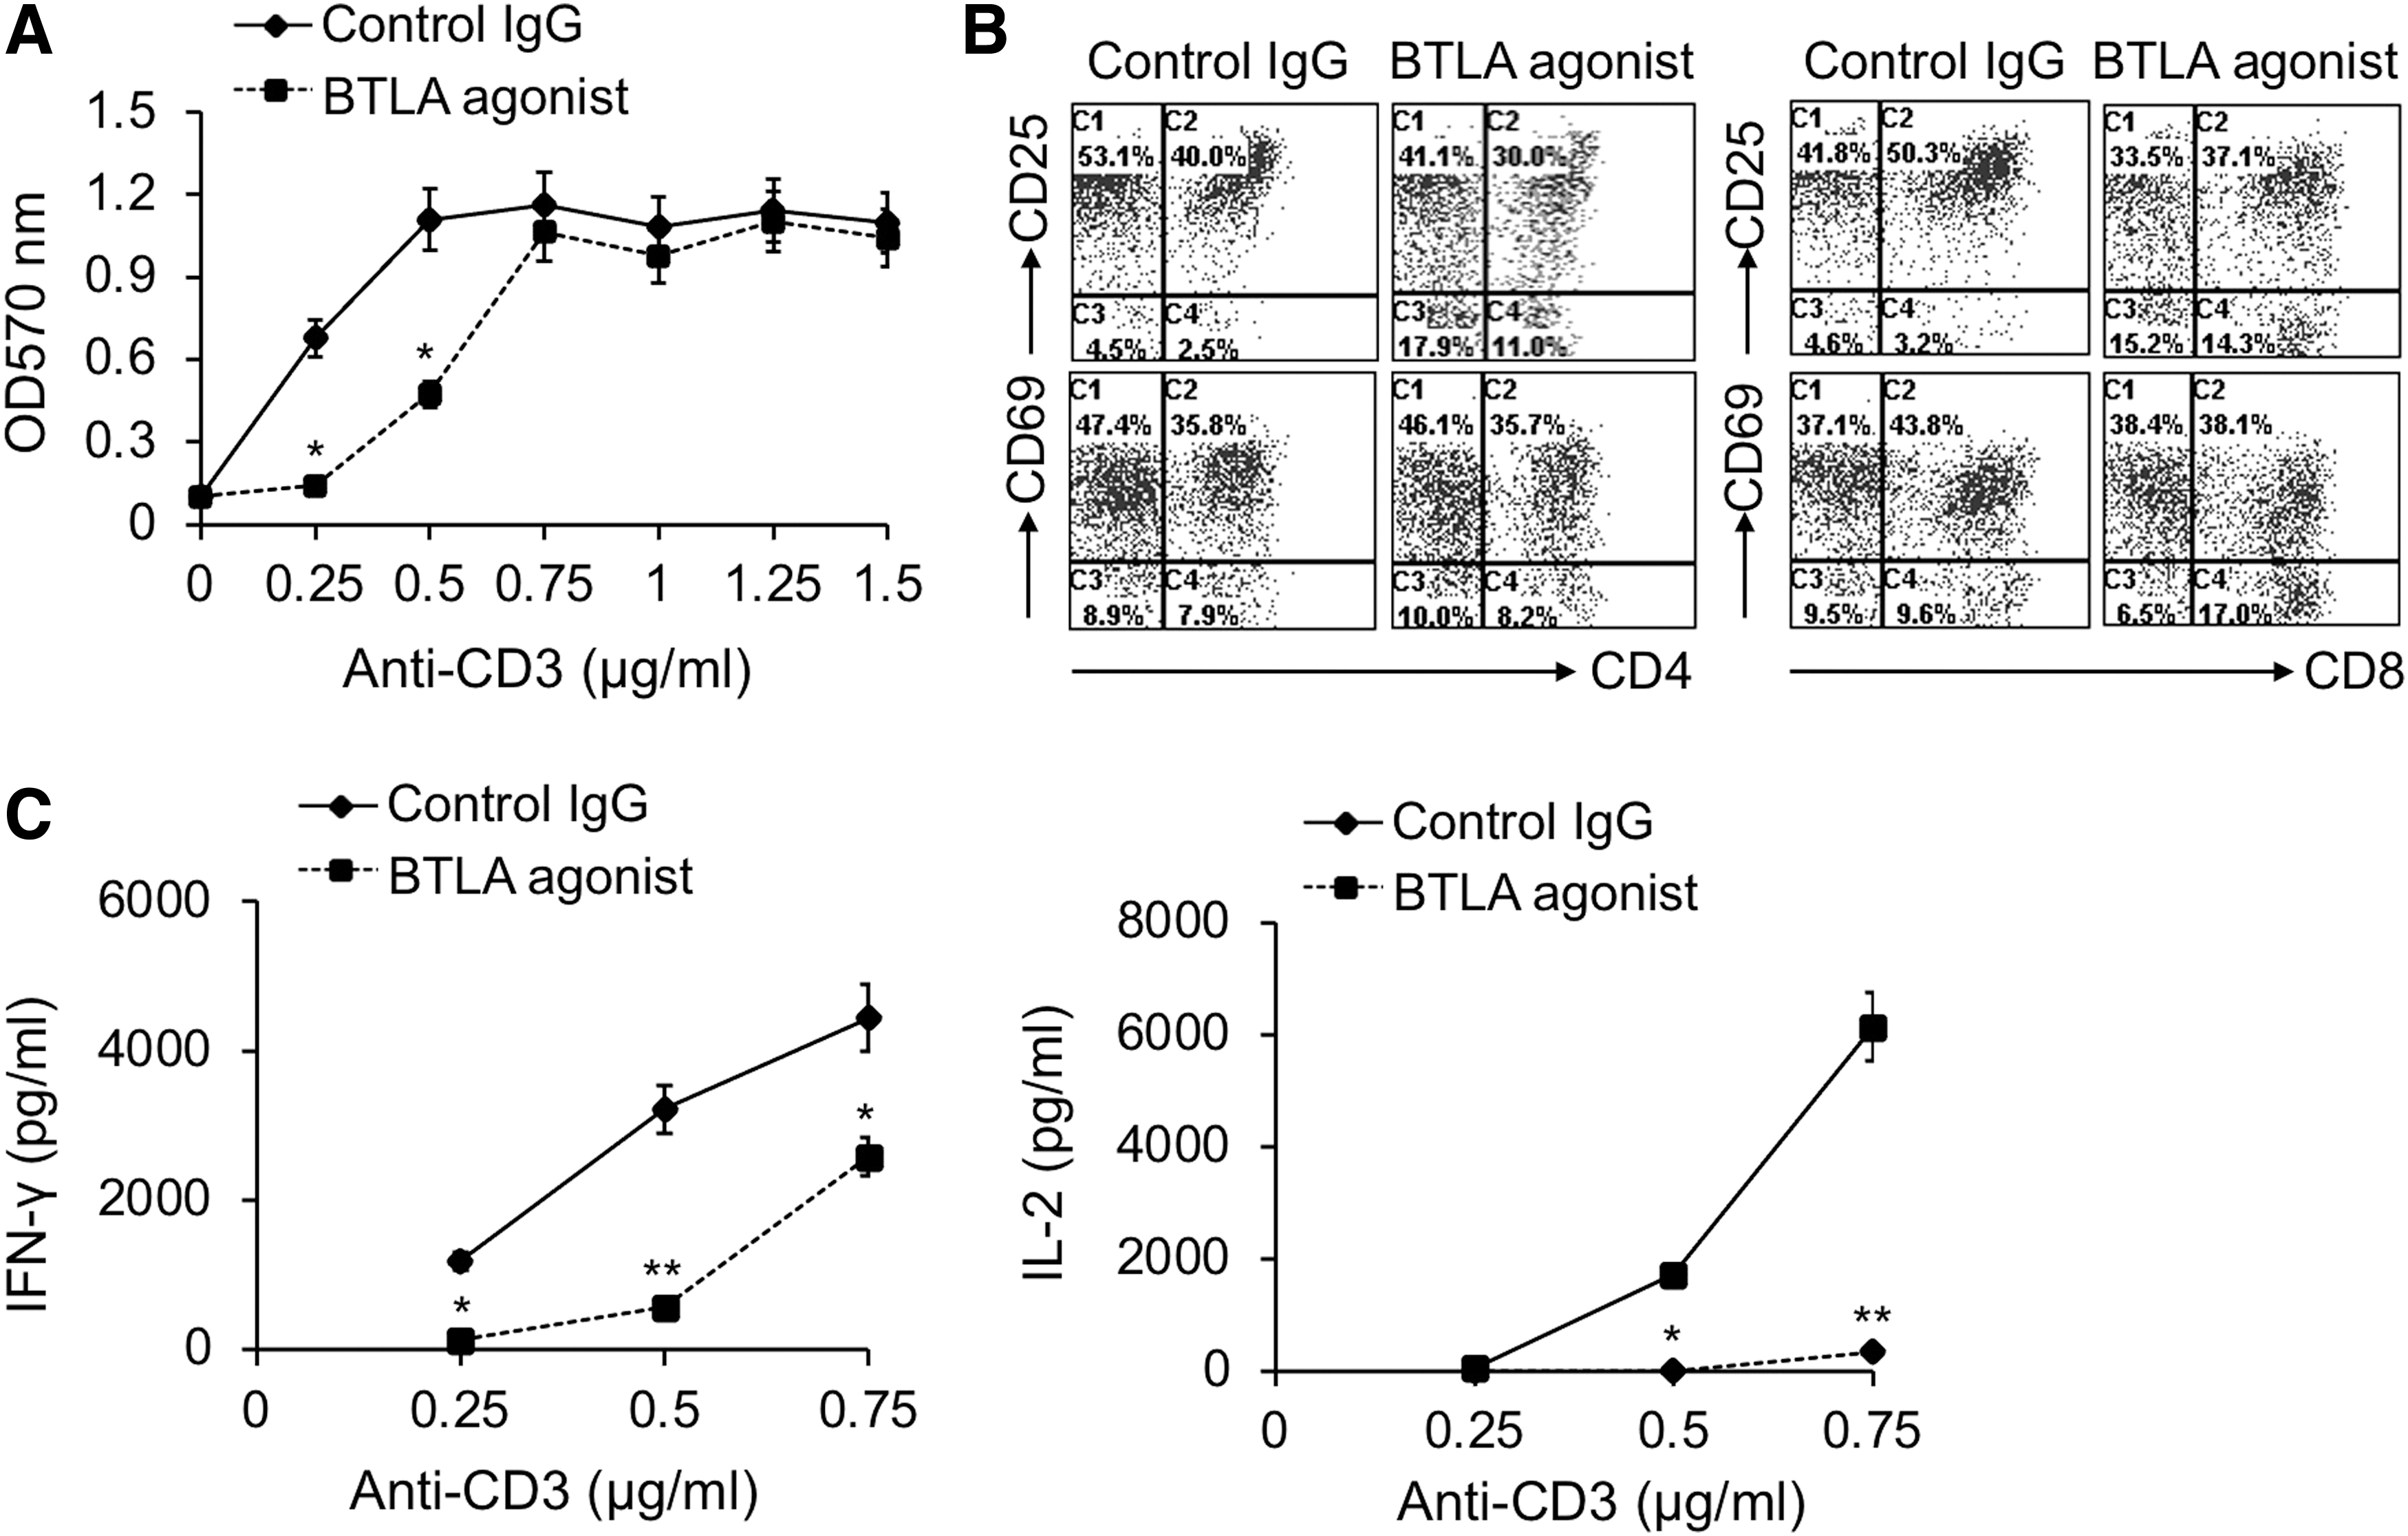
The agonistic antibody-triggered BTLA signaling suppressed T cell proliferation, activation, and effector cytokine production. Purified T cells were stimulated with plate-bound anti-CD3 mAb with a series of concentrations as indicated in
At the same time, we found that BTLA agonist evidently inhibited the expression levels of CD25, a marker reflecting T cell activation, on both CD4+ and CD8+ T cells (Fig. 9B). However, CD69, another early T cell activation marker, was not obviously inhibited on CD4+ T cells by BTLA agonist, although it was slightly downregulated on CD8+ T cells (Fig. 9B). Moreover, IFN-γ and IL-2 production were also greatly inhibited by BTLA agonist (p < 0.05) (Fig. 9C).
Taken together, agonistic antibody-triggered BTLA signaling could significantly inhibit T cell proliferation, activation, and cytokine production. These data indicated that BTLA co-inhibitory signaling might be involved in suppressing T cell function in CHB infection.
Discussion
HBV infection is a major global health problem, affecting more than 2 billion people in the world. Untreated HBV carriers have a chance to progress to cirrhosis, liver failure, and liver cancer (27). Aged patients with such infection increased the risk for hepatitis-related mortality (17). In the process of HBV infection, CD4+ T helper cells (Th) and CD8+ cytotoxic T lymphocyte cells (CTLs) inhibit viral replication by secreting IFN-γ, TNF-α, and other cytokines (13). CTLs are the main factors leading to liver damage. Persistent HBV infection will consequently dampen T cell-mediated immune response by promoting T cell exhaustion. Such depletion or functional impairment of HBV-specific T cells in chronic hepatitis B infection is generally characterized by a high expression of multiple immune checkpoints (4,5).
Among those immune checkpoints expressed on exhausted T cells, PD-1 was considered to correlate with virus-specific T cell dysfunction. BTLA, also known as a negative immune regulator with similar structure and function to PD-1, interacts with its ligand HVEM.
Emerging evidence indicates two models of interaction between BTLA and HVEM. The trans-interaction between BTLA in T cells and HVEM in B cell lymphoma directly activates the HVEM-dependent nuclear factor kappa B (NF-κB) RelA transcriptional complex (7). BTLA/HVEM cis-complex in T cells, however, limits receptivity to signaling from cells in the surrounding microenvironment and provides a mechanism maintaining T cells in a resting state (7). Engagement of BTLA by HVEM negatively regulated expansion of virus-specific T cells in chronic HBV infection (33). However, the changes of BTLA and HVEM expression on T cells of CHB patients and the correlation between their expression levels and clinical parameters were unclear.
In this study, we clarified that BTLA and HVEM expression on CD4+ T and CD8+ T cells of CHB patients were evidently increased. This can be explained by the fact that stimulation of HBV antigens in CHB patients persistently activated T cells since BTLA and HVEM expression were increased on activated T cells. However, this research confirmed that the expression of BTLA and HVEM did not show a significant correlation with HBV-DNA load. Interestingly, our previous studies revealed that the high expression of PD-1 on T cells from CHB was positively correlated with HBV-DNA load (30). Such difference might have contributed to the factor that the characteristics and mechanism of BTLA and HVEM expression regulation are not similar to that of PD-1 upon HBV antigen stimulation.
Further analysis revealed that BTLA and HVEM expression were closely and positively correlated with clinical indicators such as ALT and AST. This relevance may be interpreted as follows: during CHB infection, T cells were persistently activated by failure of clearing HBV antigens and caused damage to liver tissue, leading to ALT and AST release. At the same time, BTLA and HVEM were upregulated by HBV antigen-activated T cells. Hence, these two enzymes and BTLA and HVEM were synchronously increased and might have some relevance between them.
According to evidence that BTLA/HVEM interaction exerts an inhibitory effect, we deduce that upregulation of BTLA and HVEM on CD4+ T and CD8+ T cells of CHB patients might be conducted as a feedback mechanism for suppressing T cell function to prevent patient's liver from excessive immune injury. Actually, it was reported in our previous study that PD-1 expression was also increased on T cells of CHB patients and positively correlated with ALT and AST levels (30). These data indicated that the upregulation of these immune checkpoints not only contributed to T cell functional exhaustion leading to CHB progression but also might be beneficial for avoiding excessive immune injury to patient's liver. Notably, under T cell activation, the internalization of HVEM may lead to trans-interaction mode.
Although we revealed the clinical significance of BTLA and HVEM expression on T cell surface, investigation of intracellular HVEM expression in T cells of CHB patients might also be clinically important. Moreover, due to the complex of BTLA/HVEM interaction model and effect, it may be more valuable to further dissect BTLA and HVEM expression on multiple subsets of CD4+ T and CD8+ T cells such as naive, effector, progenitor, exhausted, and terminally exhausted T cells of CHB patients since the expression levels of immune checkpoints are different on these T cells subsets during chronic viral infection as well as tumorigenesis (12,18).
In addition to our current data, other research also confirmed that BTLA/HVEM signaling was closely associated with CHB infection. For example, Tang et al. reported the polymorphisms of BTLA were correlated with CHB infection (26). As we investigated the overall BTLA and HVEM expression levels on circulating CD4+ and CD8+ T cells from CHB patients, future studies are needed to view the distinct changes of BTLA and HVEM at different phases of HBV (immune tolerance, immune clearance, inactive carrier state, and reactivation). Understanding the change of BTLA and HVEM expression associated with HBV clinic parameters according to severities of CHB will be supplementary to design effective antiviral therapy for chronic HBV infection.
Moreover, we investigated the characteristics of BTLA signaling suppressing T cell activation. An agonistic antibody-triggered BTLA signaling obviously inhibited T cell proliferation under moderate TCR signaling, but could not exert an inhibitory effect under high strength of TCR signaling. It implied that BTLA coinhibitory signal might suppress T cell proliferation only under optimal HBV antigen load. This result is consistent with the finding that the inhibitory effect of antigen presenting cell-expressing HVEM on activated T cell was dependent on the concentration of antigenic peptide (23).
At the same time, CD25, an activation marker of T cells, on CD4+ T and CD8+ T cells was downregulated. In contrast, the early activation marker CD69 on T cells was not affected, indicating that extrinsic factor-triggered BTLA signaling might not have an impact on T cell priming. The decreased IFN-γ and IL-2 production demonstrated that BTLA inhibitory signal also dampened effector function of T cells.
In conclusion, our findings revealed that BTLA and HVEM expression were upregulated on the surface of CD4+ and CD8+ T cells and positively correlated with ALT and AST levels in CHB infection, implying that the variation of BTLA and HVEM expression might represent a certain clinical significance. Moreover, the increased BTLA and HVEM on T cells might be involved in CHB progression through driving T cell exhaustion since BTLA/HVEM interaction-triggered inhibitory signaling is dominant over HVEM-mediated stimulatory signaling (25).
Footnotes
Author Disclosure Statement
No competing financial interests exist.
Funding Information
The project was supported by National Natural Science Foundation of China (NSFC) grants (31970833, 91642103, 31570889), Six talent peaks project of Jiangsu Province (2017-SWYY-065) and a project funded by the Priority Academic Program Development of Jiangsu Higher Education Institutions, Science and Technology Plan of Suzhou of China (SS201880, SYS2018096, SS2019010, SS2019074), Social Development Project of Jiangsu Provincial Department of Science and Technology (BE2019673), High-level Health Talents in Jiangsu Province (LGY2019014), Suzhou City Key Clinical Disease Diagnosis and Treatment Technology Special Project, project number (LCZX201819, LCZX201918), Gusu Health Talents Project (GSWS2020092), and Young health Talents Program of Suzhou (Qngg2021028).