
Abstract
Intraepithelial lymphocytes (IELs) provide the first line of immunological defense after the invasion of the intestine by a pathogen. To understand the changes of IEL response in chickens, we measured the population of different subsets of avian IELs at different time points after primary inoculation of Newcastle disease virus (NDV) lentogenic strain (LaSota) and subsequent challenge with NDV velogenic strain- genotypes VII and VIII. Furthermore, NDV shed after each treatment was quantified. Specific-pathogen-free chickens were randomly divided into six groups of chickens, one to six, inoculated with phosphate buffered saline; NDV lentogenic strain (LaSota); genotype VII (GVII); LaSota and challenged with GVII (LSGVII); genotype VIII (GVIII); and group of LaSota and challenged with GVIII (LSGVIII). The chickens were euthanized at 12, 36, and 60 h postchallenge. Immunophenotyping of CD25+ IEL, CD3+ cells, CD4+ cells, and CD8+ cells was conducted using flow cytometer. Furthermore, virus shedding was measured using reverse transcriptase–quantitative polymerase chain reaction. Data were analyzed using a two-way analysis of variance (ANOVA). The results showed that the percentage population of IEL subsets was generally lower in the chickens inoculated with GVII or GVIII when compared with LaSota, LSGVII and LSGVIII inoculated groups. The NDV copy number was significantly higher in chickens challenged with NDV GVII or GVIII when compared with chickens inoculated with LaSota, LSGVII or LSGVIII. Taking together, NDV velogenic strain caused decrease in the population of subsets of chickens' IEL. However, inoculation of NDV LaSota may increase the population of avian IEL subsets and decrease shedding of virulent NDV.
Introduction
Interest in avian intraepithelial lymphocytes (IELs) is fast developing in recent years due to, partly their strategic location in gut-associated lymphoid tissue, which may define their viral clearance function, and in part, the importance of each primary component of IEL in immunity, that is, the T lymphocytes, Natural Killer cells, and B lymphocytes.
Newcastle disease (ND) has continued to cripple many poultry industries globally, with severe economic impacts spanning from decreased productivity and subsequent high mortality rate of birds through severe global trade restrictions due to the “fear” of the disease spread (5). To date, effective treatment against ND is largely lacking; however, farmers and poultry industries depend primarily on biosecurity measures and vaccination as preventive tools (2,22,30). However, virulent Newcastle disease virus (vNDV), which is the causative agent of ND remains endemic, and report from many countries suggested that the virus continue to spread even in vaccinated flocks (31).
The ease of the virus transmission to susceptible birds is therefore facilitated by the presence of the virus in the environment. Consequently, there is renewed interest in the amount of NDV shed in the environment in an experimentally vaccinated-challenge setting (17).
Previous study has reported that the use of ND vaccine to stimulate high systemic antibody levels has been shown to prevent clinical symptoms against vNDV challenge, yet, virus shedding continues to occur (23). One of the existing knowledge attributable to this failure is the mismatch between ND vaccine and challenge vNDV genotypes (18,31). Contrastingly, other findings reported cross-protection among different genotypes since all NDV strains belong to the same serotype (10,15).
Regardless, it is important to note that many infections, including ND occur on or through mucosal surfaces, it is therefore imperative to study the mucosal immune response, which is often the key to the initial prevention and control of ND (33). However, there is a general lack of corroborating data on the effect of NDV strains on the population of various components of IELs. This is important so as to understand the changes of IEL response after infection with NDV and the probable resultant virus shedding.
Our preexisting knowledge of the ability of NDV of virulent strain to cause a reduction in the population of avian IEL NK cells (1), and the knowledge of severe depletion in the population of splenic CD4+ and CD8+ T cells after inoculation of genotypes VII and VIII (19), led to the hypothesis that vNDV cause reduction in the population of the subsets of IEL in chickens. However, we hypothesized that inoculation of lentogenic NDV strain LaSota before subsequent challenge with either genotypes would increase the population of IEL subtypes. This was based on a previous finding that reported an early detection of cell-mediated immunity (CMI) after inoculation of NDV lentogenic strain B1 (23).
Therefore, the objective of this research is to understand the changes in the response of different subsets of chickens' IEL after infection with different NDV strains. In addition, virus shedding was measured at different time points after infection with lentogenic and velogenic strains.
Materials and Methods
Virus specimens, propagation and determination of ELD50
The virus isolates were obtained from the Laboratory of Vaccine and Biomolecules, Institute of Bioscience (IBS), Universiti Putra Malaysia (UPM) (Table 1). The viruses were propagated in 9-day old specific-pathogen-free (SPF) chicken's eggs, and titrated to determine the virus ELD50 using a standard protocol (21).
Newcastle Disease Virus Isolates Used in This Study
Ethical consideration and experimental designs
Ethics statement
The experiment was conducted based on the approval of the Institutional Animal Care and Use Committee (IACUC), Faculty of Veterinary Medicine, UPM, under the reference number UPM/IACUC/AUP-R005/2019.
Virus inoculation into SPF chickens
SPF embryonated chicken's eggs were hatched in the hatchery unit of IBS, UPM. The SPF chickens were randomly divided into six groups,1–6, at 24 days posthatch. Each group consists of 21 chickens except group 1, which has 15 chickens. The chickens were inoculated with either 1 × phosphate buffered saline (PBS) (Cat. No.: BR0014G) or virus inoculum via intraocular route.
Chickens in group 1 were uninfected control and hence were inoculated with 0.1 mL sterile PBS; chickens in group 2 were inoculated with 0.1 mL 106.5 ELD50 NDV LaSota; chickens in group 3 were inoculated with 0.1 mL 106.5 ELD50 GVII; chickens in group 4 were inoculated with 0.1 mL 106.5 ELD50 NDV LaSota and challenged with 0.1 mL 106.5 ELD50 GVII at 36 h postinoculation; chickens in group 5 were inoculated with 0.1 mL 106.5 ELD50 GVIII; and chickens in group 6 were inoculated with 0.1 mL 106.5 ELD50 NDV LaSota and challenged with 0.1 mL 106.5 ELD50 GVIII at 36 h postinoculation. Seven chickens were euthanized at 12, 36, and 60 h postchallenge from each of group 2–6, while five chickens were simultaneously sacrificed from group 1 at 12, 36, and 60 h.
The experiment was conducted in three replicates. At each time point, duodenal loop samples from five or seven chickens were pooled, and then proceeded for isolation of IEL (Fig. 1).
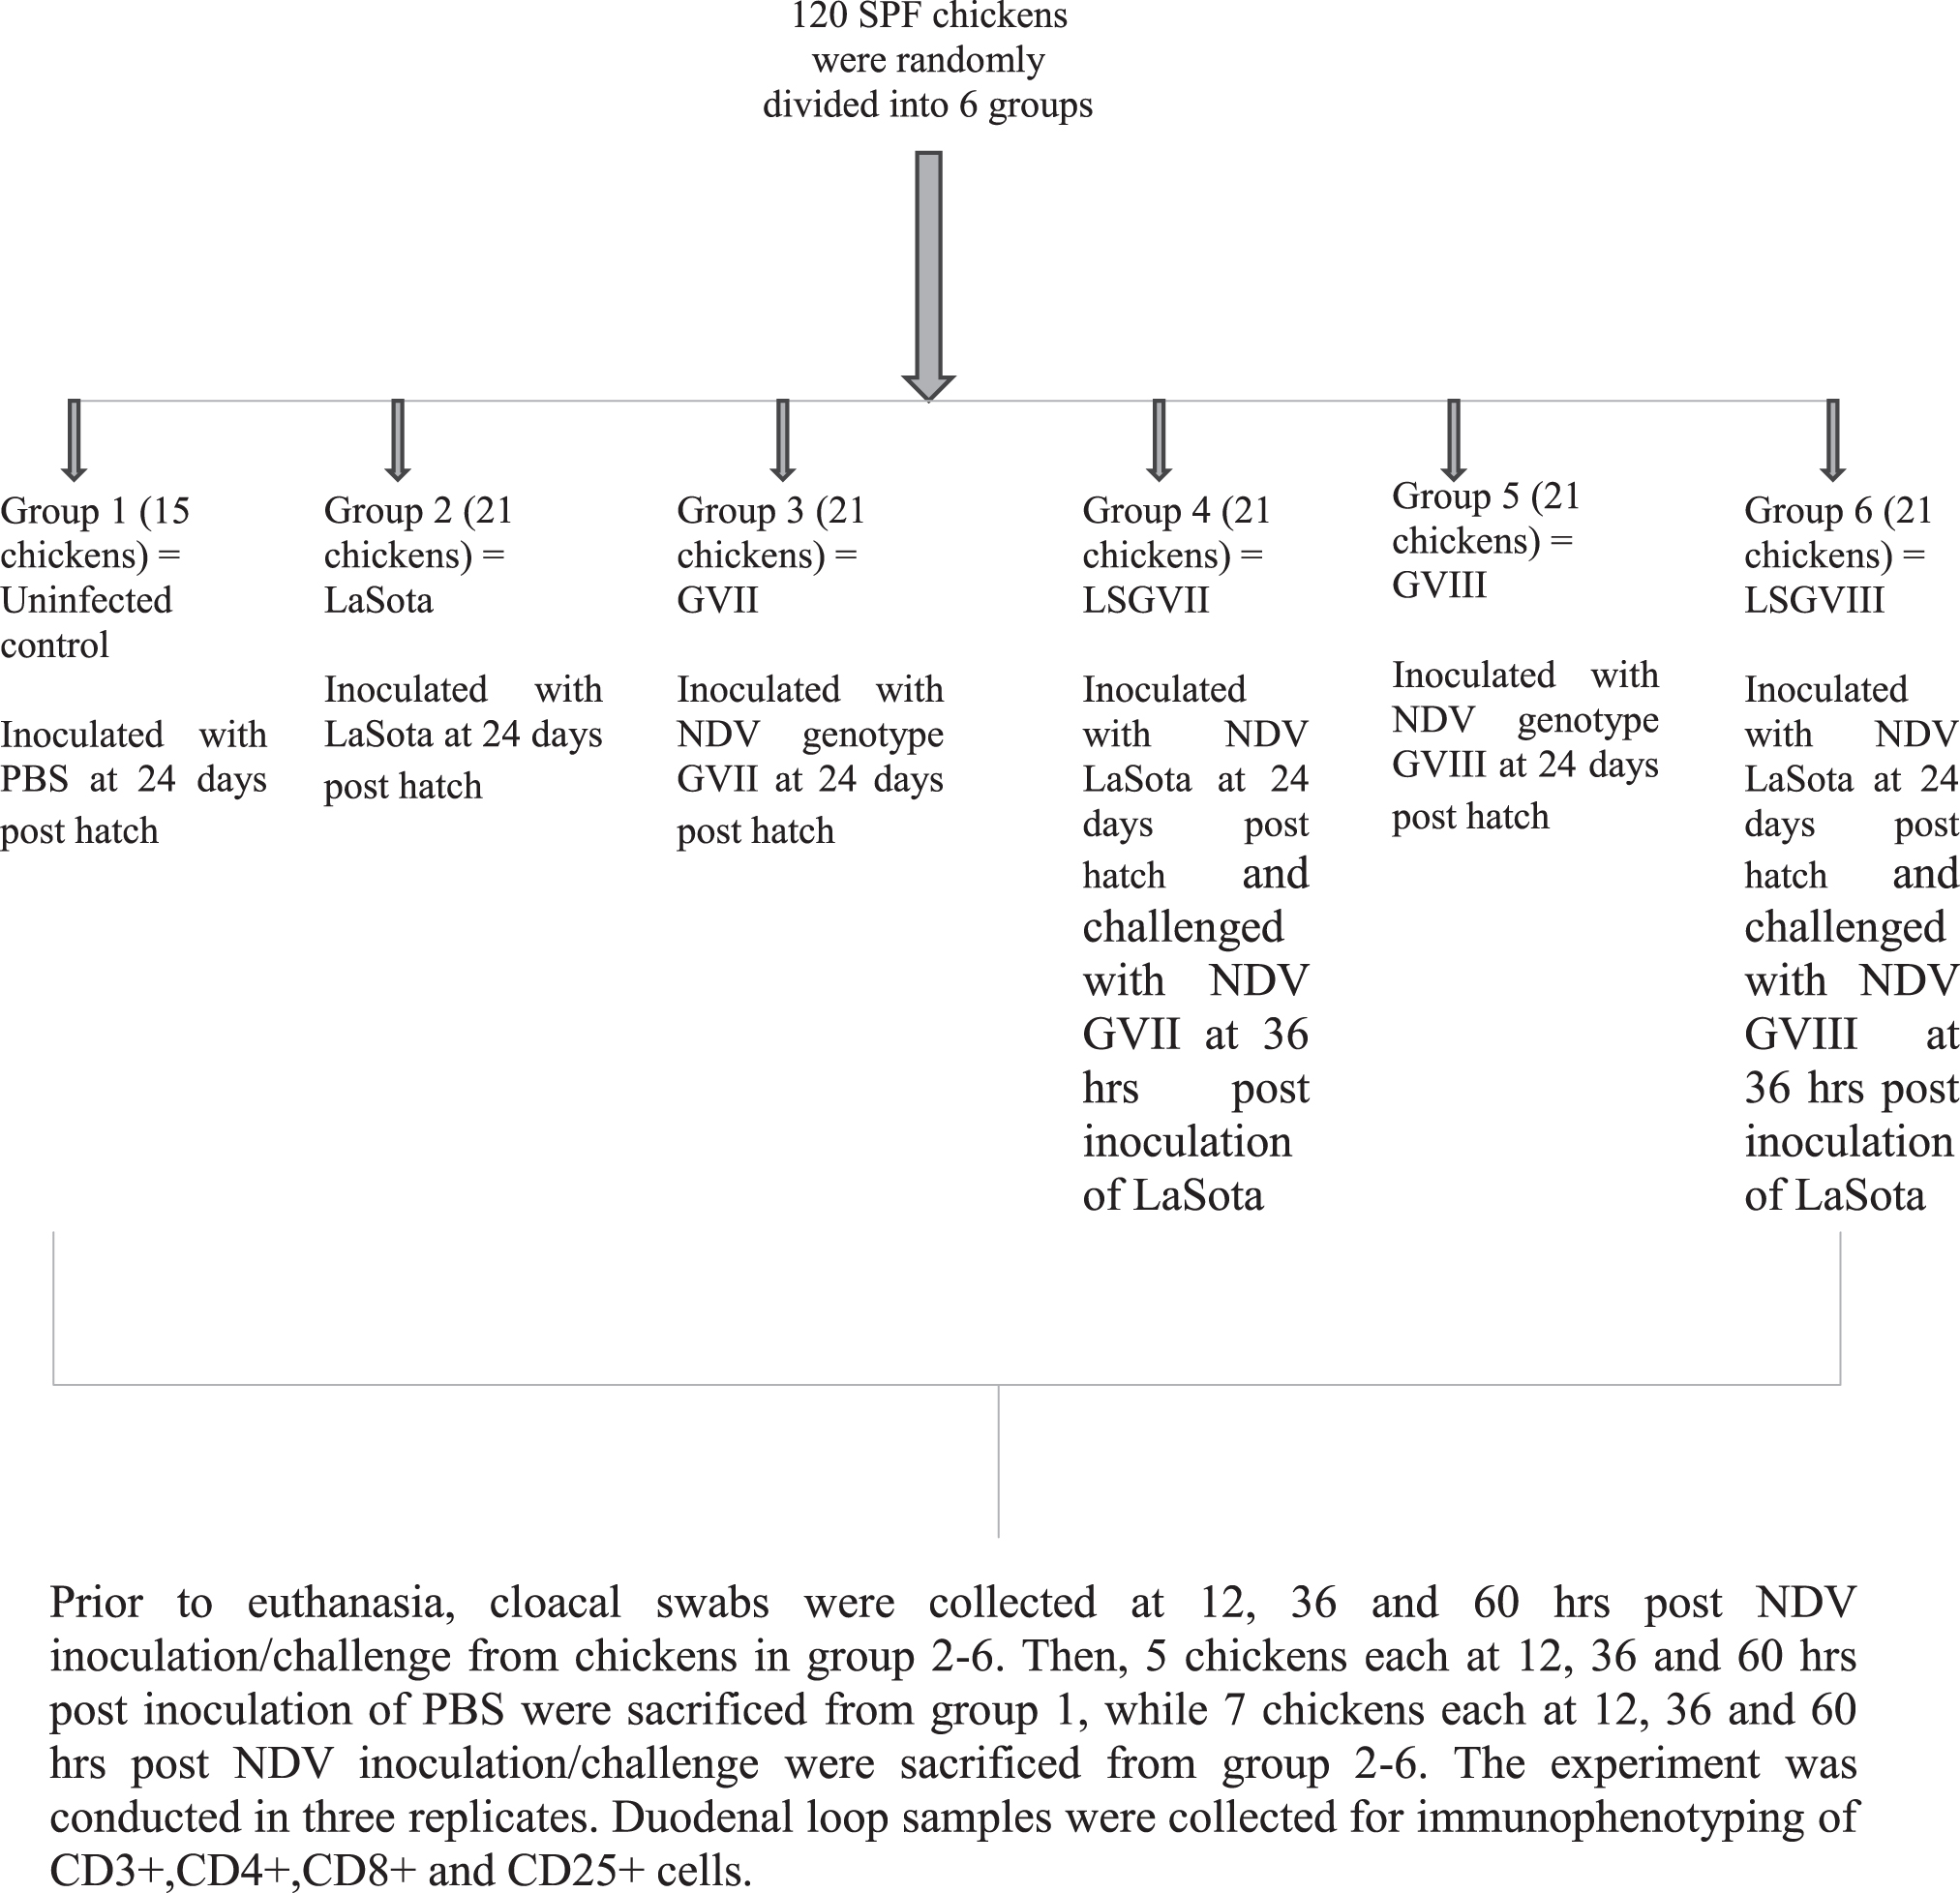
Group chart of the research methodology showing the number and age of chickens used, the type of NDV strains, time of inoculation and euthanasia. NDV, Newcastle disease virus.
Isolation of chicken IEL
The duodenal loops of the chickens were gently removed, and all pancreatic tissues and other remaining fats were similarly removed and then submerged in sterile PBS for the isolation of IEL. The isolation was carried out as previously described (8). Briefly, the duodenal loops were thoroughly washed with PBS, sliced up into ∼1-cm pieces and then transferred into prewarmed 1 × PBS-0.1 mM ethylenediaminetetraacetic acid (EDTA) (Cat. No.: E7889)- 10 mM dithiothreitol (DTT) (Cat. No.: 3154; Sigma-Aldrich), shaken at 130 rpm for 30 min in a water bath, at 37°C. The supernatants were collected and centrifuged three times at 350 g for 10 min at 4°C, in a 15 mL falcon tube (Cat. No.: 50015; SPL Life Science, Korea). The pellets were resuspended and passed through prewet 70 μL cell strainer (Cat. No.: B17-LAB352350; SPL Life Science).
The filtrates were collected and then triple washed for 10 min each at 350 g, 4°C. The pellets were resuspended with fresh 1 × PBS, and 7.5 mL of the cell suspension was gently dispensed over an underlay of 7.5 mL Histopaque-1119 (Cat. No.: 11191-100ML; Sigma-Aldrich). It was centrifuged at 600 g for 40 min, at 4°C, and the interphase was collected. The pellets in the interphase, containing IEL subsets were triple washed with PBS at 350 g, 4°C for 10 min each, and the supernatant was discarded. The pellets were resuspended in PBS and then counted using Scepter™ 2.0 (Millipore Sigma) as previously reported by Abdolmaleki et al. (1) with slight modifications. The cells were prepared for immunophenotyping of CD3+ cells, CD4+ cells, CD8+ cells, and CD25+ IEL cells.
Immunophenotyping of IEL subsets
The IEL was counted (1), and the cells were resuspended in 1 mL cold 1 × PBS-5 mM EDTA-0.5% bovine serum albumin (BSA) (Cat. No.: 11500496), centrifuged at 400 g for 10 min at 4°C. The supernatant was removed, and the pellets were resuspended in 100 μL cold 1 × PBS-5 mM EDTA-0.5% BSA.
Then, the cells were labeled in dark with 10 μL human anti-chicken CD25 (chCD25) conjugated with fluorescein isothiocyanate (FITC) (Clone ID: HCA173F; Bio-Rad Lab.), and allophycocyanin (APC)-conjugated mouse monoclonal anti-chicken CD45 (Clone ID: SB8270-11; Southern Biotech) in one tube, then 5 μL phycoerythrin (PE)-conjugated mouse monoclonal anti-chicken CD3 (Clone I.D: SB8200-09; Southern Biotech), mouse monoclonal anti-chicken CD4 conjugated with FITC (Clone I.D: 100405; Southern Biotech), and APC-conjugated mouse monoclonal anti-chicken CD8α (Clone I.D: SB8220-11; Southern Biotech) in another tube.
The mixtures were vortexed vigorously. They were wrapped with aluminium foil and incubated on ice for 1 h in a magnetic shaker at 100 rpm. Afterward, 1 mL cold 1 × PBS-5 mM EDTA-0.5% BSA was added and the cells were centrifuged at 400 g for 10 min, +4°C. The supernatants were removed, and the pellets were resuspended in 500 μL 1 × PBS. The cells were briefly kept in +4°C chiller before flow cytometric analysis.
Flow cytometric analysis
Samples were measured using a double-laser bench-top flow cytometry (Becton Dickinson Biosciences) and analyzed with FACSDiva Software (Becton Dickinson Biosciences). Excitation was performed with a 488 nm argon-ion laser, and the emission was collected using a 530/30 nm bandpass (BP) filter for FITC conjugates, a 585/42 nm BP filter for PE conjugates and a 660/20 nm BP filter for APC conjugates. Side scatter (SSC) and forward scatter lights, two basic parameters proportional to the cellular granularity and cell size, respectively, were used for gating. In addition, unstained cells were used for gating (Supplementary Data S2 and S3).
One-step reverse transcriptase–quantitative polymerase chain reaction for quantification of NDV shedding
Collection of cloacal swab samples
Cloacal swabs were collected as previously described (3). The samples were transported in 1 × PBS to the laboratory on ice, where they were kept at −20°C until extraction of RNA.
RNA extraction
The viral RNA from the swab samples was extracted using innuPREP Virus RNA Kit (Cat. No.: AJG#845-KS-4700250; Analytikjena, Germany). Briefly, 400 μL mixture of Lysis Solution RL and Carrier Mix was dispensed into 1.5 mL reaction tube containing 300 μL of the swab sample. The mixture was vortexed after adding 20 μL Proteinase K, and incubated at room temperature for 10 min. Then, 700 μL Binding Solution VL was added to the samples and was mixed. Spin Filter was then placed on a 2.0 mL Receiver Tube, and 650 μL of the sample was applied. It was centrifuged, and the tube with the filtrate was discarded while the Spin Filter was placed into a new 2.0 mL Receiver Tube, and the residual sample was loaded and similarly centrifuged. The Spin Filter was placed on a new Receiver Tube, then 500 μL Washing Solution HS and 650 μL Washing Solution LS, were respectively added after a centrifugation step.
All traces of ethanol were removed through maximum speed of centrifugation for 3 min. The Spin Filter was placed into an Elution Tube, and 60 μL prewarmed RNase-free water was added, incubated at room temperature for 2 min and then centrifuged.
Evaluation of RNA concentration and purity
Spectrophotometer (Eppendorf) was used to evaluate the concentration and the purity of RNA, and measured in ng/μL. Their optical densities were determined based on A260/A230 nm (ratio 2.0–2.2) and A260/A280 nm (ratio 1.8–2.1).
Generation of standard curves
A tenfold serial dilution of viral stocks of each NDV strain was used to generate standard curves for the respective NDV strains. The efficiencies and other parameters of the curves were evaluated and noted for further analysis (Table 2).
Performance of the Standard Curves of Newcastle Disease Virus Lentogenic and Velogenic Strains Using Real-Time Polymerase Chain Reaction
Multiplex reverse transcriptase–quantitative polymerase chain reaction for quantification of NDV strains from swab samples
Multiplex reverse transcriptase–quantitative polymerase chain reaction was performed using SensiFAST™ Probe No-ROX One-Step Kit (Cat. No.: BLN#BIO-76005; Bioline, Meridian Life Science® Company). Primers and their corresponding TaqMan probes that are specific to each of the NDV strain were used. Their specificity was confirmed using conventional PCR. For the velogenic strain, the forward primer, 5′ TCCGCAAGATCCAAGGGTCT 3′, and the reverse primer, 5′ CGCTGTTGCAACCCCAAG3′ and their corresponding Probe, 5′ (6FAM) AAGCGTTTCTGTCTCCTTCCTCCA-(BHQ1) 3′ targeted on the Fusion (F) gene were used in the TaqMan real-time PCR assay, whereas for the lentogenic strain, the Forward and Reverse primers with their Probe are 5′ TCC GTA GGA TAC AAG AGT CT 3′, 5′ GGC AGT TGC AAC CCC AAG 3′, and 5′ (HEX) CC TAT AAG GCG CCC CTG TCT CCC (BHQ) 3′ respectively.
The reaction mixture consists of 10 μL 2 × SensiFAST Probe No-ROX One-Step Mix, 0.8 μL 10 μM Forward Primer, 0.8 μL 10 μM Reverse Primer, 0.2 μL 10 μM Probe, 0.2 μL Reverse transcriptase, 0.4 μL RiboSafe RNase Inhibitor, 4 μL RNA Templates, and 3.6 μL RNase-free water, which constituted the standard final concentration of 20 μL mix. The cycling conditions that were used include 45°C for 10 min, 95°C for 2 min followed by 40 cycles of 95°C for 5 sec and 60°C for 20 sec.
Statistical analysis
Data from immunophenotyping (Supplementary Data S1) were analyzed for normality using Shapiro Wilk's test (p > 0.5), and subjected to two-way analysis of variance (ANOVA) using IBM SPSS v.25 (IBM SPSS 25). Statistical significance between variables of IEL subsets was obtained using the Tukey HD Posthoc test. The efficiencies of the standard curves of the virus strains, their corresponding slopes and y-intercepts (Table 2) were used to calculate the virus copy number using Excel. The amount of viral shed was expressed as the number of viral RNA copies (Supplementary Data S4). Absolute quantification of the number of viral RNA copies in the swabs was based on Cq values for each sample and the standard curve method for qPCR.
The number of viral RNA copies was calculated using the following formula: (concentration in g) × (6.023 × 10²³) 330 × total amplicon length (24). Data obtained from virus shedding were similarly subjected to two-way ANOVA, and significance level between groups and within groups was analyzed.
Results
Immunophenotyping of intestinal CD25+ IEL
Generally, the population of CD25+ IEL was significantly higher in the uninfected control group 1 than in all other groups. There was a significantly higher number of CD25+ IEL cells within the uninfected control group at 60 h Postinfection (p.i) of PBS, compared with the other time points within the group. Group comparison further showed that chickens in group 3 inoculated with NDV GVII showed a significant decrease of CD25+ IEL compared with their corresponding chickens in group 4 that were challenged with LSGVII. The highest reduction of CD25+ IEL was at 60 h p.i of GVII. Similarly, there was a significant decrease in the population of CD25+ IEL from chickens in group 5 that were inoculated with GVIII when compared with chickens in group 6 that were challenged with LSGVIII (Fig. 2).
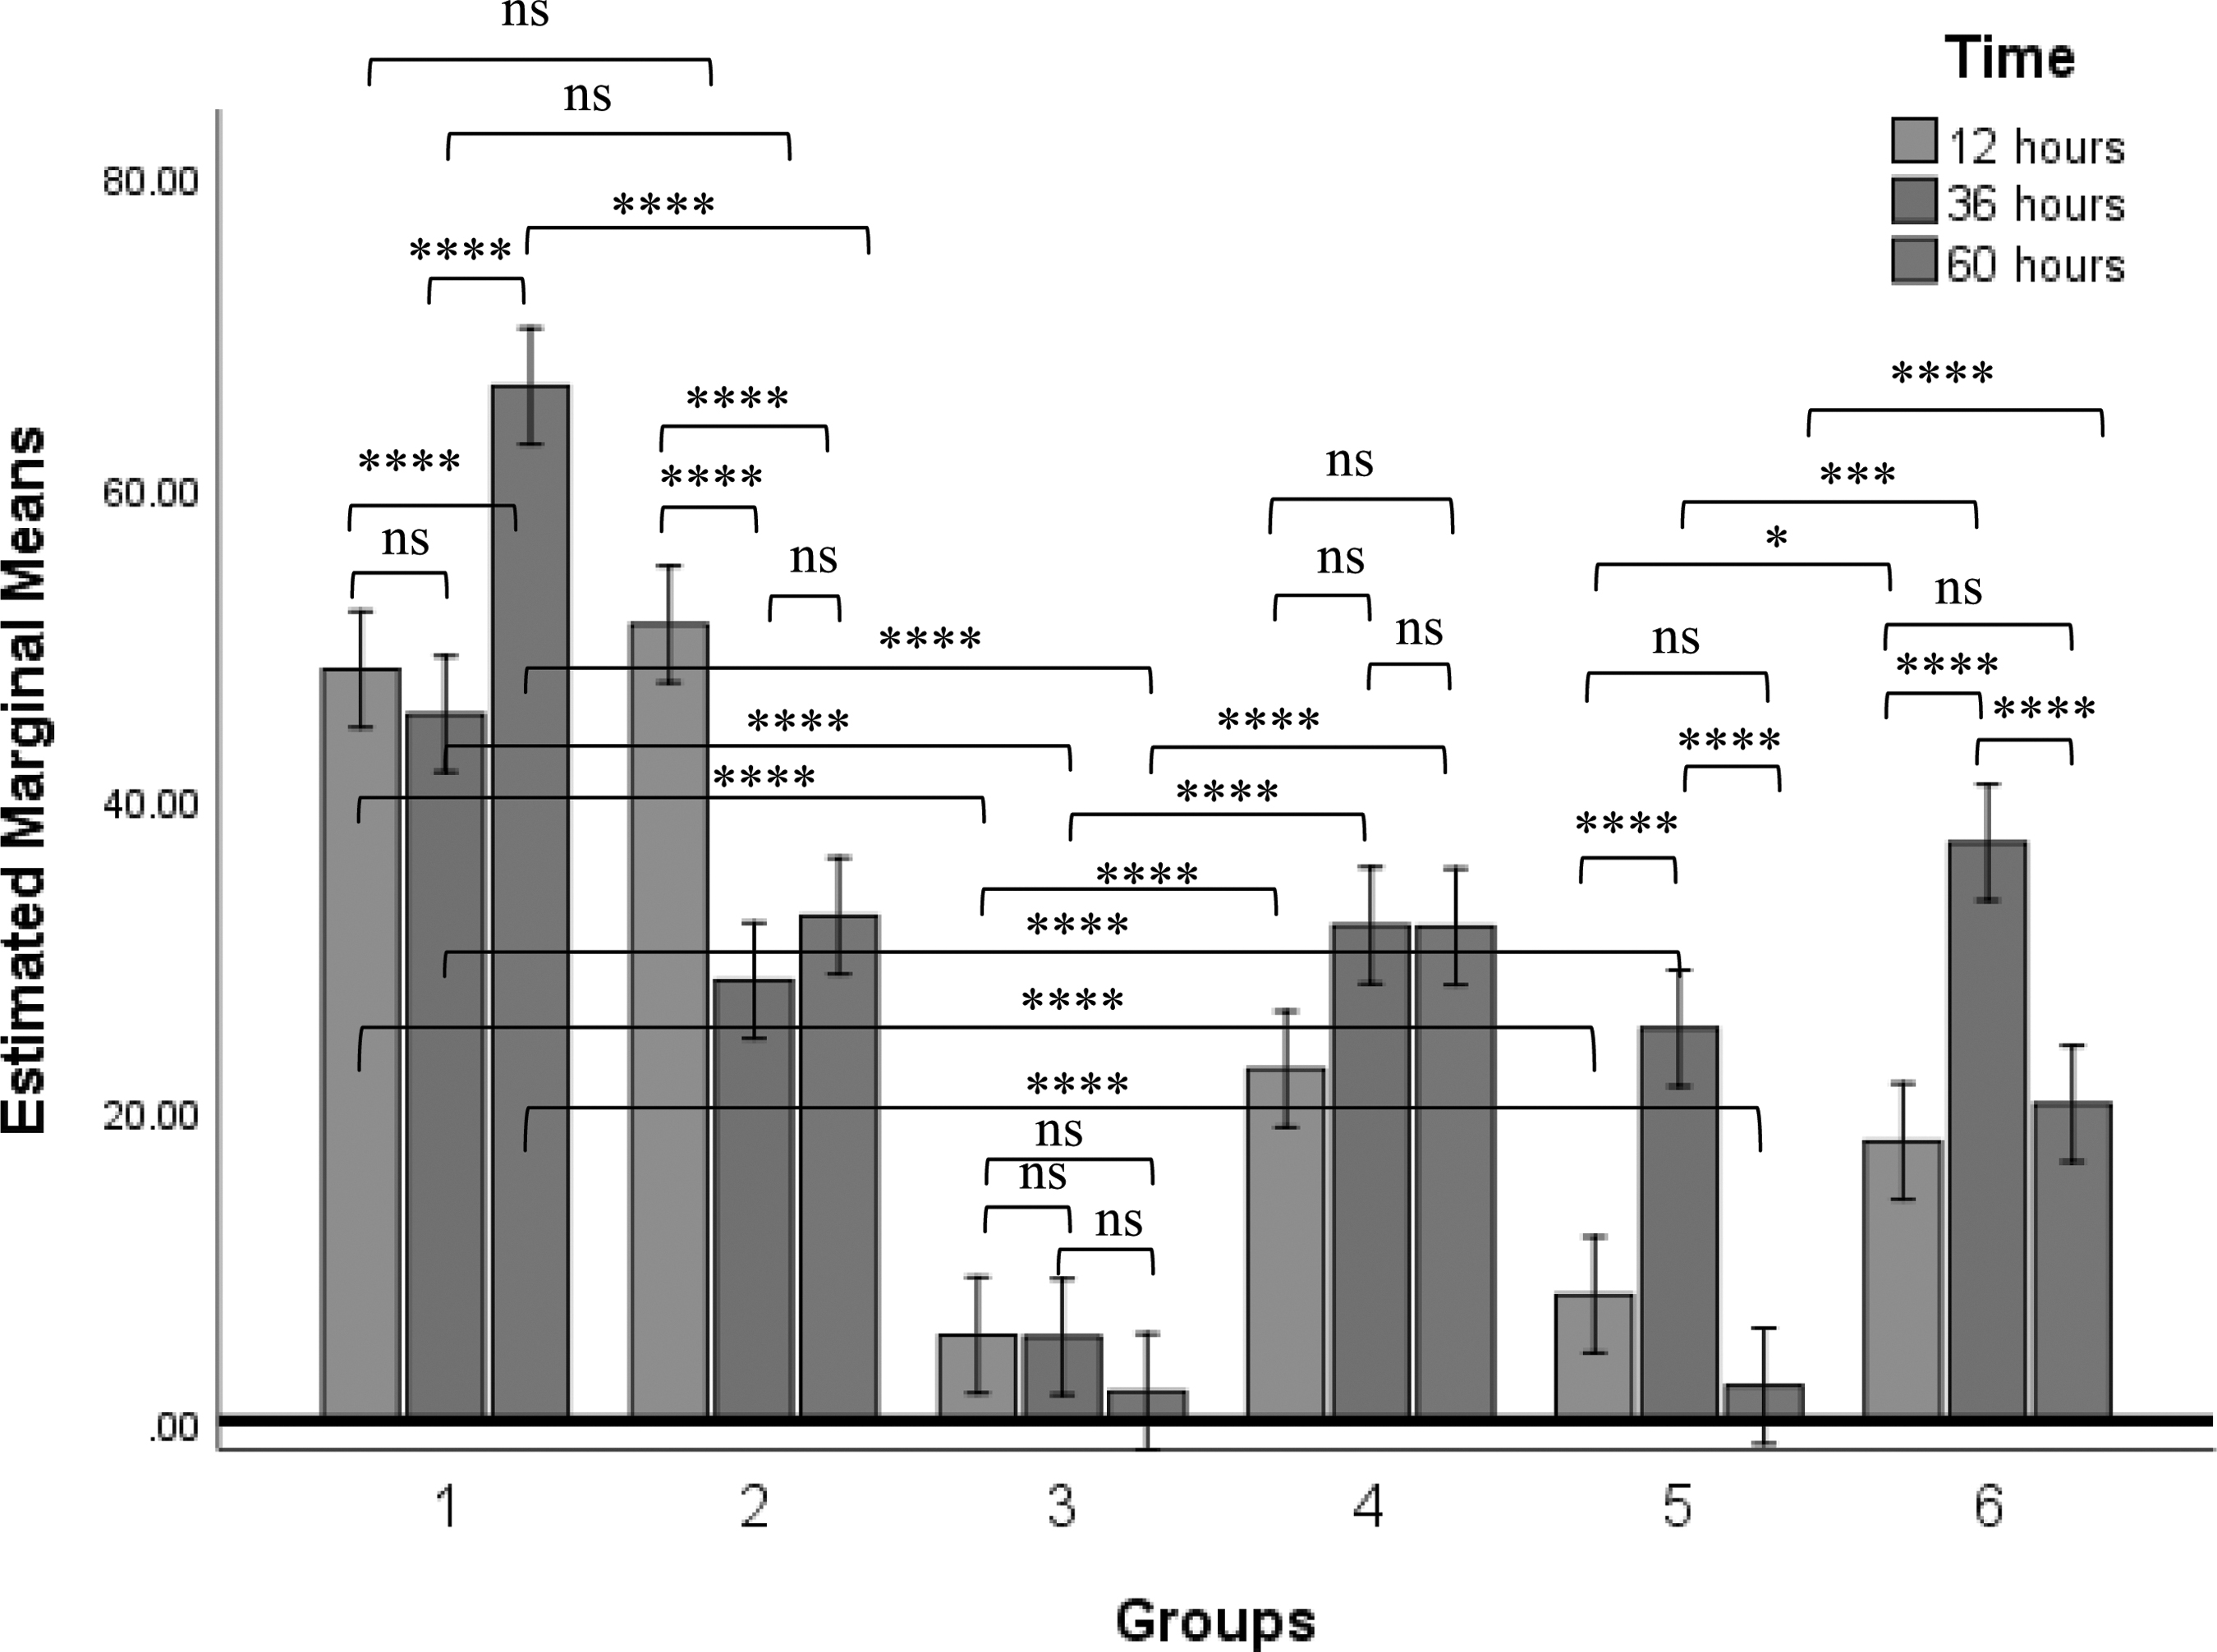
Percentage population of chickens' CD25+ cells at different time points after inoculation of PBS, LaSota, GVII, GVIII, LSGVII, and LSGVIII to chickens in group 1, 2, 3, 4, 5, and 6 respectively. Values with asterisks are statistically significant when two time points are compared. Analyses was carried out using two-way ANOVA (p ≤ 0.05). The value is the means ± SEM of three experiments. *p value between 0.01 to 0.05; ***p value between 0.0001 to 0.001; ****p value < 0.0001. ANOVA, analysis of variance; ns, not significant; SEM, standard error of the mean.
Immunophenotyping of CD3+ cells
There was a significant increase of CD3+ cells in chickens inoculated with LaSota, LSGVII and LSGVIII compared with the control group. However, there was a decrease in the population of CD3+ cells in chickens inoculated with GVII or GVIII when compared with control group. Similarly, there was a statistically significant reduction in the population of CD3+ cells after challenge with either GVII or GVIII when compared with their corresponding LSGVII or LSGVIII inoculated chickens respectively. In relation to time points, the highest reduction of CD3+ cells was at 60 h after inoculation of GVII NDV, although this is not statistically different with the other time points within the group (Fig. 3).
Percentage population of chickens' CD3+ cells at different time points after inoculation of PBS, LaSota, GVII, GVIII, LSGVII, and LSGVIII to chickens in group 1, 2, 3, 4, 5, and 6 respectively. Values with asterisks are significantly different when two time points are compared. Analyses was carried out using two-way ANOVA (p ≤ 0.05). The value is the means ± SEM of three experiments. *p value between 0.01 to 0.05; **p value between 0.001 to 0.01; ***p value < 0.0001 to 0.001; ****p value < 0.0001.
Immunophenotyping of CD4+ cells
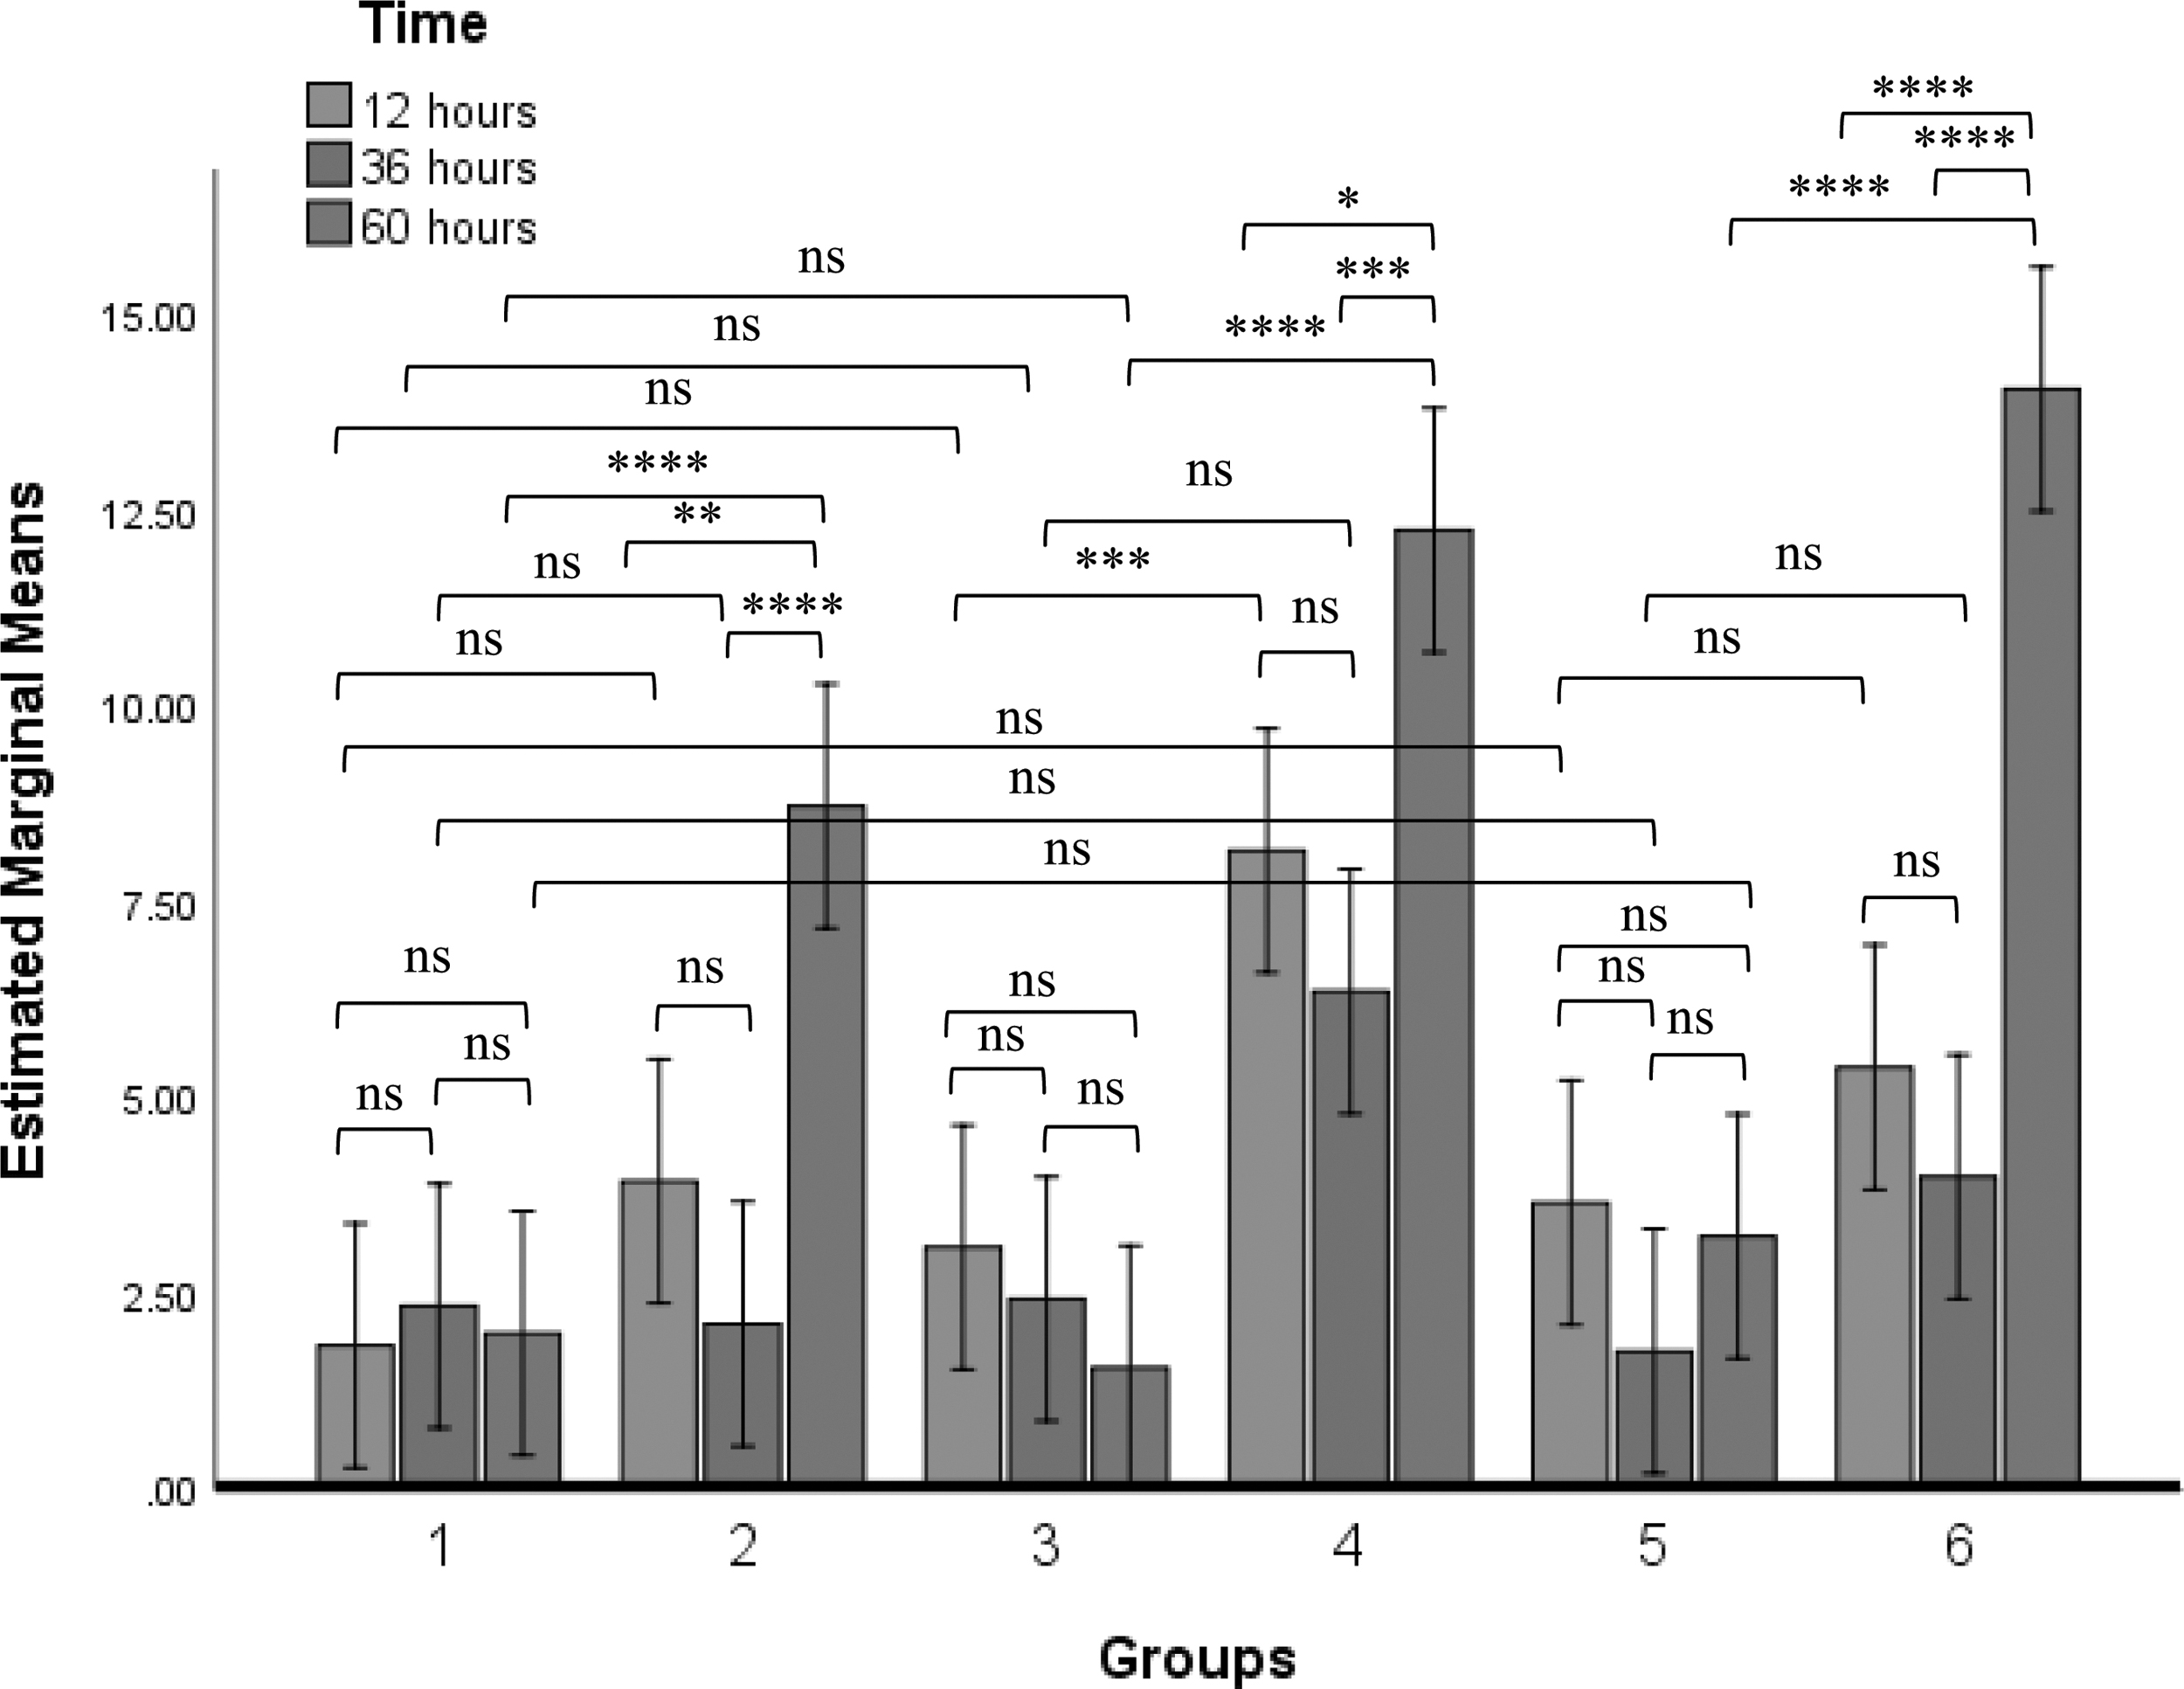
There was a significant decrease in the number of CD4+ cells at 60 h p.i of LaSota, GVII and GVIII when compared with control at 60 h p.i of PBS. In addition, chickens inoculated with NDV GVII or GVIII showed a significant reduction of CD4+ cells at 60 h p.i when compared with the population of the cells in their corresponding chickens inoculated with LSGVII or LSGVIII respectively at 60 h p.i (Fig. 4).
Percentage population of chickens' CD4+ cells at different time points after inoculation of PBS, LaSota, GVII, GVIII, LSGVII, and LSGVIII to chickens in group 1, 2, 3, 4, 5, and 6 respectively. Values with asterisks are significantly different when two time points are compared. Analyses was carried out using two-way ANOVA (p ≤ 0.05). The value is the means ± SEM of three experiments. ***p value between 0.0001 to 0.001; ****p value <0.0001.
Immunophenotyping of CD8+ cells
The percentage population of CD8+ cells in chickens inoculated with GVII or GVIII decreased significantly compared with the control group. In contrast, the LaSota inoculated group showed a significant increase in the population of CD8+ cells compared with the control group. Chickens inoculated with LSGVII or LSGVIII showed a significant increase of CD8+ cells when compared with chickens inoculated with GVII or GVIII respectively, and with control group (Fig. 5).

Percentage population of chickens' CD8+ cells at different time points after inoculation of PBS, LaSota, GVII, GVIII, LSGVII, and LSGVIII to chickens in group 1, 2, 3, 4, 5, and 6 respectively. Values with asterisks are significantly different when two time points are compared. Analyses was carried out using two-way ANOVA (p ≤ 0.05). The value is the means ± SEM of three experiments. *p value between 0.01 to 0.05; ***p value between 0.0001 to 0.001; ****p value < 0.0001.
There was no statistically significant difference among the time points in the control group. Similarly, although the highest decrease of CD8+ cells after inoculation of GVII was at 60 h p.i, there was no significant difference with the other time points in the group. Contrastingly, the highest decrease of CD8+ cell was at 12 h p.i of GVIII, but the cell increased significantly at 36 and 60 h p.i.
Virus shedding
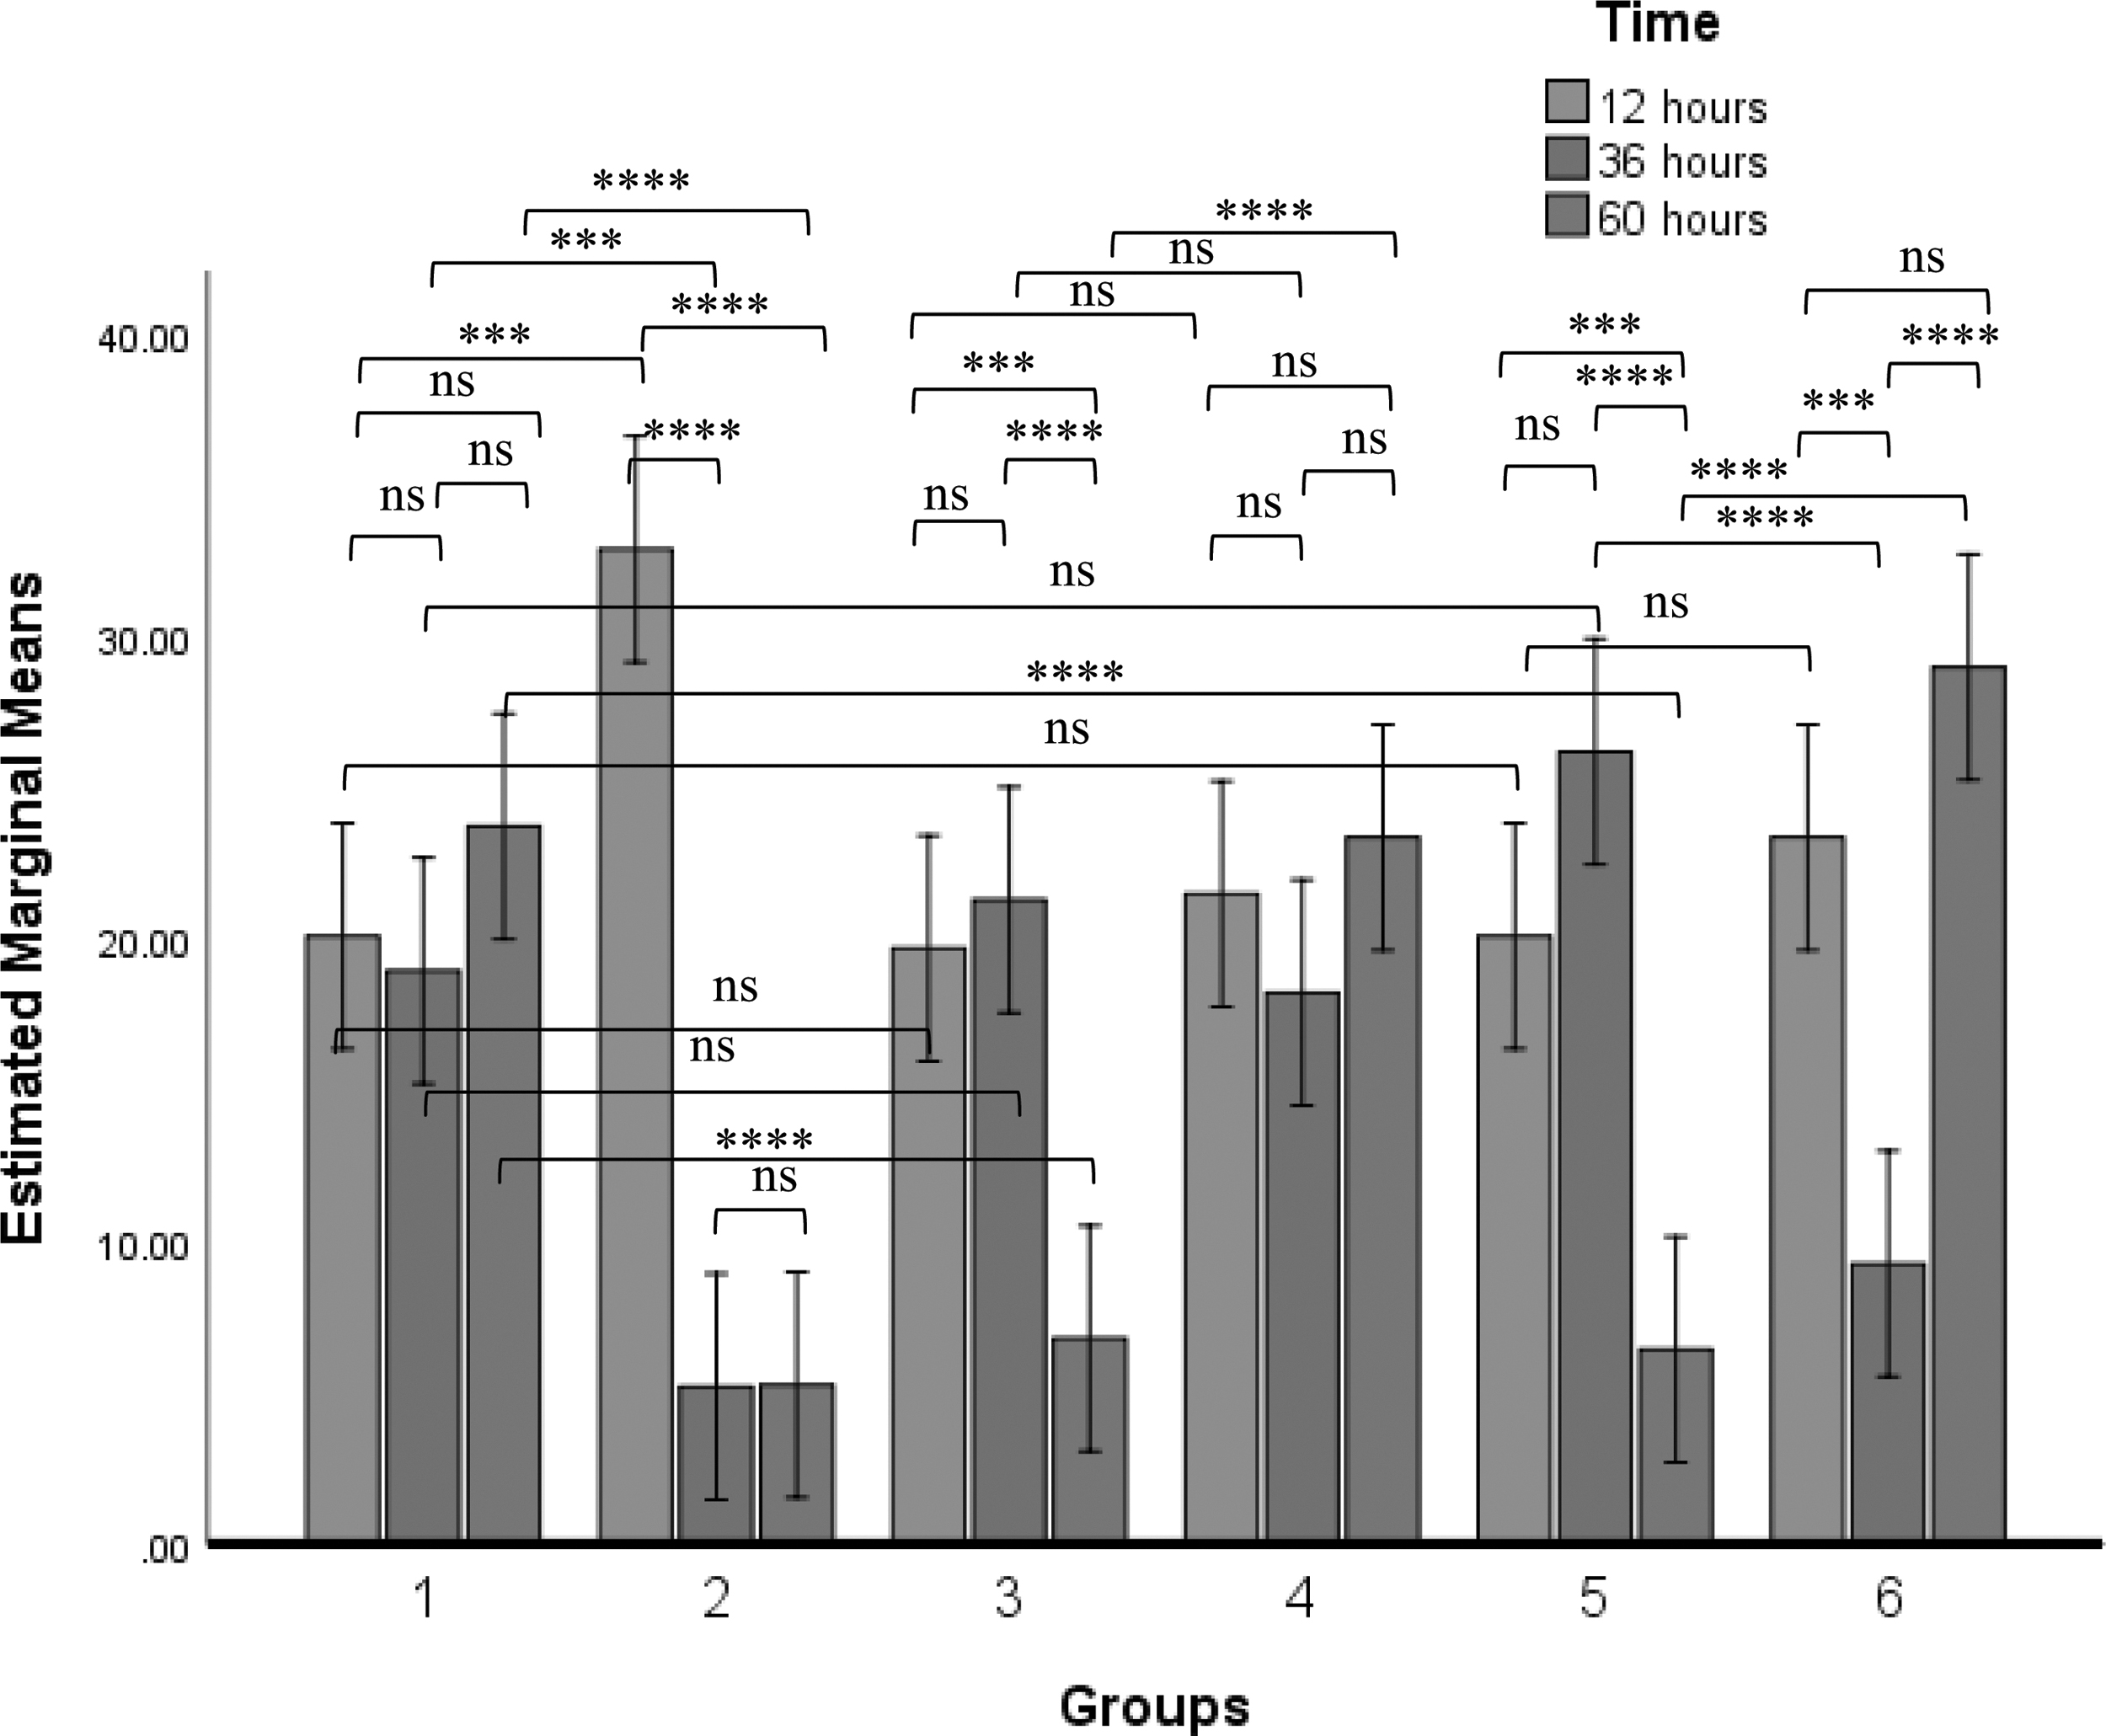
The virus copy number in group 2 chickens inoculated with NDV LaSota was significantly lower compared with the copy number obtained in all the other groups. However, the NDV copy number was significantly higher in chickens inoculated with NDV GVII or GVIII when compared with chickens challenged with LSGVII or LSGVIII respectively. There was no statistically significant difference between the time points of LaSota inoculated group. The highest virus copy number was obtained at 60 h postchallenge with GVII, and was statistically different from all other time points in the group. However, in the LSGVII challenged group, there was a significant decrease in the virus copy number in all the time points compared with their corresponding time points in the GVII challenged group.
There was no statistical difference between the time points in chickens inoculated with NDV GVIII. However, there was higher GVIII shedding at different time points in chickens inoculated with GVIII when compared with chickens challenged with LSGVIII. No statistical difference between the time points in the LSGVIII inoculated chickens (Fig. 6).
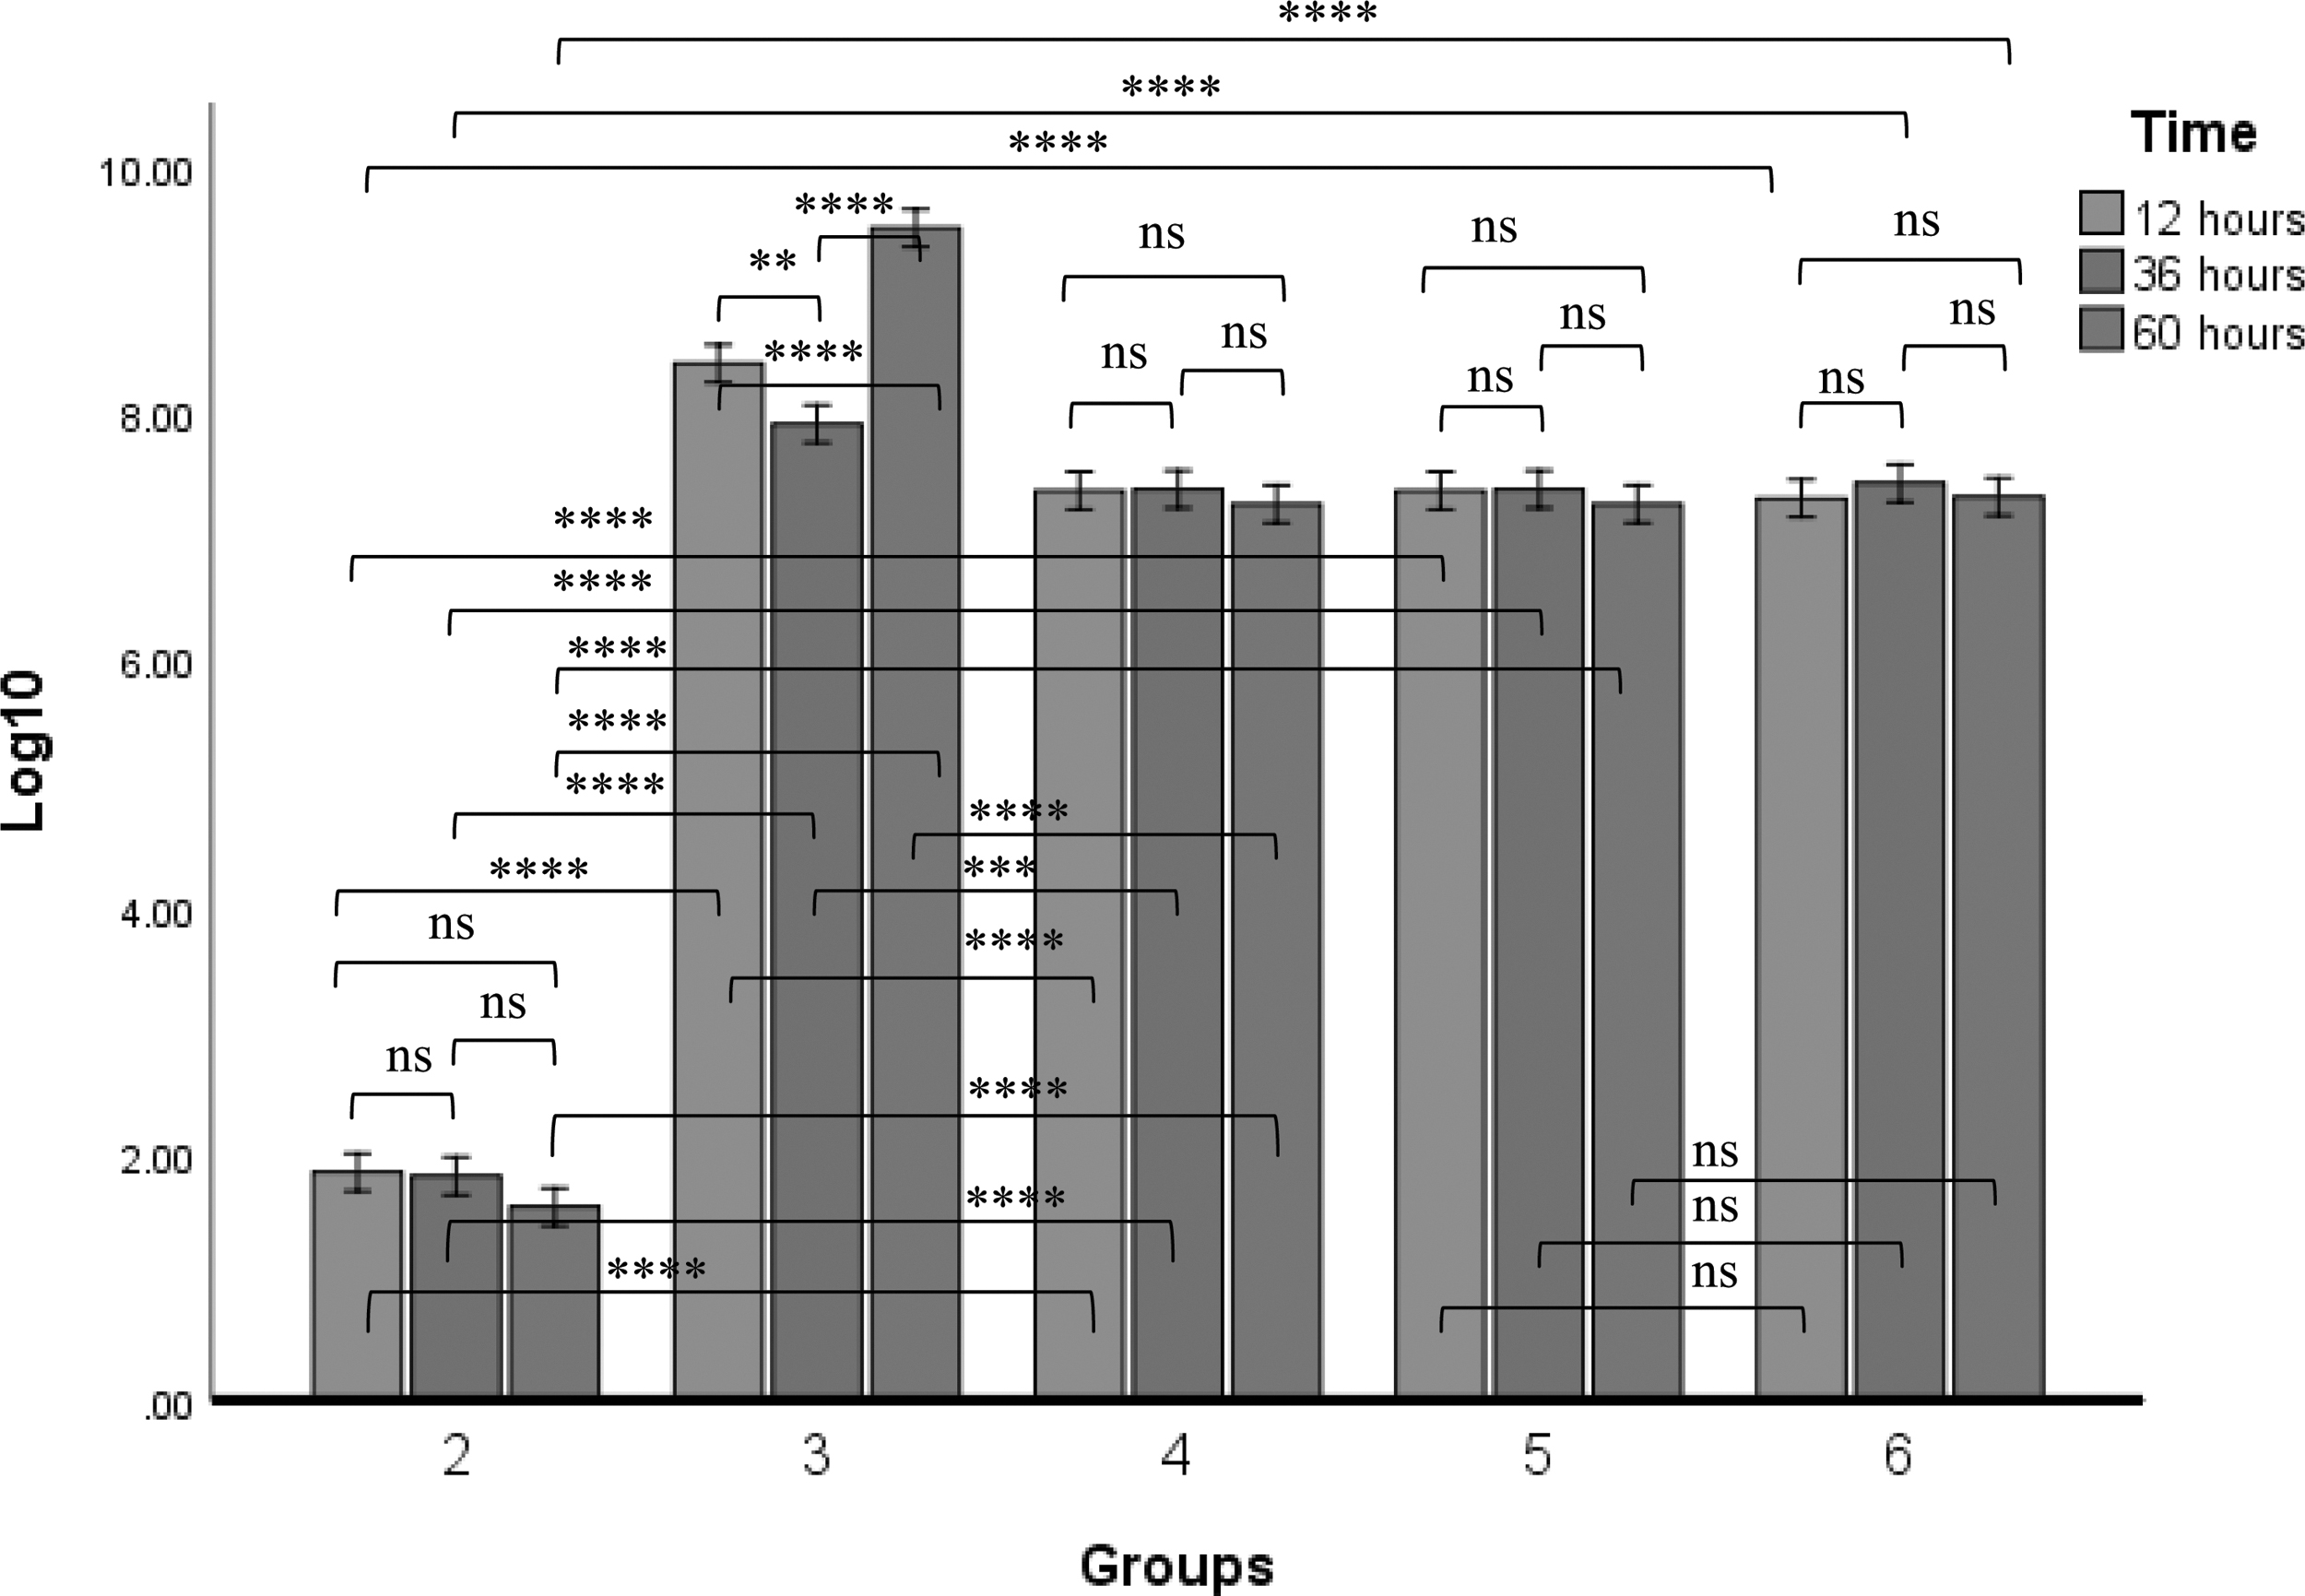
NDV copy number from cloacal swabs of chickens at different time points after inoculation of LaSota, GVII, GVIII, LSGVII, and LSGVIII to chickens in group 2, 3, 4, 5, and 6 respectively. Values with asterisks are significantly different when two time points are compared. The numbers are expressed in log10. Analyses was carried out using two-way ANOVA (p ≤ 0.05). The value is the means ± SEM of three experiments. **p value between 0.001 to 0.01; ***p value between 0.0001 to 0.001; ****p value < 0.0001.
Discussion
One of the important physical barriers against invading pathogens is the mucosa. Its surface serves as the initial site of replication of viruses, including NDV. However, the innate response of immune-gut-associated cells include the collaborative function of secretory IgA (sIgA)-positive cells, mast cells, intestinal IELs, and goblet cells that prevent pathogen invasion and protect the animals from various infectious pathogens (7,11). The contributions of the IEL in defense against invading pathogens were investigated. Studies have shown that IEL contributes significantly to mucosal immunity through the production of cytokines, induction of apoptosis in intestinal epithelial cells and producing cytotoxic activity (9,27,29).
A recent study has reported a reduction in the number of IEL NK cells in SPF chickens infected with genotypes VII and VIII NDVs (1). Furthermore, it was reported that there was a significant reduction in the population of splenic T lymphocytes at 1 and 3 days after infection with NDV genotypes VII and VIII (19). However, the population of various components of avian IEL cells after infection with NDV genotype VII and VIII has not been reported. In addition, the alteration in the population of the various components of avian IEL after inoculation of NDV lentogenic strain LaSota and subsequent challenge with either genotype VII or genotype VIII has not been determined.
In this research, in addition to investigating the effect of NDV strains on the population of various components of chickens' IEL subsets, we equally measured NDV shedding at various time points after treatment with lentogenic strain LaSota and NDV velogenic strains, genotypes VII and VIII. The roles of live NDV LaSota in this experiment have been investigated.
The percentage population of CD25+ IEL showed a statistically significant decrease in chickens infected with GVII or GVIII compared with control and their corresponding group of chickens inoculated with LSGVII or LSGVIII. Interestingly, chickens inoculated with NDV LaSota have shown a significant increase in the population of CD25+ IEL. Studies have shown that chCD25 molecules can be expressed on the surface of CD4+ T cells, CD8+ T cells, monocytes/macrophages, and thrombocytes (28). Furthermore, chCD25 can be expressed by avian IEL-NK cells (25). However, because our experiment lasted for less than 3 days-from inoculation of antigens to euthanasia, we assumed that majority of IELs that expressed CD25 molecule were innate, and NK cells constitute majority of innate immune cells in the chickens' IEL (8).
In addition, anti-CD25 mAb have been reported to reacts identically with 28-4 mAb, even block each other (T.W. Göbel, pers. comm.), and the 28-4 was reported to bind specifically to chickens IEL-NK cells (8). Despite these evidences, we have chosen to used nonspecific name for this cell type- CD25+ IEL, because the purity of NK cell was not determined in this article. The decrease in the number of CD25+ IEL after infection with vNDV may be due to the ability of NDV to cause apoptosis of these cells. A recent study has shown that vNDV can cause a decrease in the population of one of the IEL cells that expresses CD25 molecules, the NK cells.
Furthermore, ultrastructural analysis of the NK cells showed the presence of small apoptotic bodies (1). Interestingly, the findings of this study showed the role of primary inoculation of NDV LaSota toward increasing the population of CD25+ IEL despite challenge with vNDV. Report on stronger and long-lasting NDV specific CMI shortly after LaSota inoculation had since been documented (20). Similarly, the role of LaSota vaccine against genotype VII and VIII challenge was previously reported. However, our findings provide baseline information on the role of live NDV LaSota in chickens inoculated with either LSGVII or LSGVIII through immunophenotyping of chCD25+ IEL and other subsets of IEL.
As shown from the results of this study, there was a significant increase in the population of CD3+ cells in chickens inoculated with LaSota, LSGVII and LSGVIII when compared with chickens inoculated with PBS, GVII and GVIII. The avian CD3 molecule is expressed on the surface of T cells, an important cellular component of adaptive immunity. Although T cells formed a critical cellular component of adaptive immunity, it is interesting to note that this study demonstrated an early detection of CD3+ cells. The result further suggests that despite challenge with vNDV, NDV LaSota was able to cause an increase in the population of CD3+ cells when compared with chickens inoculated with vNDV only.
These findings were corroborated by some previous researches. Reynolds and Maraqa (22) reported early detection of CMI at second-day postinoculation of NDV vaccine strain. Furthermore, CMI stimulation with NDV was detected between 2–3 days postinfection. Martinez et al. (16) also reported an early reduction in CD3+ cells at 7 days postinoculation of live NDV LaSota in spleen and in circulation; however, the cells increased at 24 days postinoculation.
There was a significant reduction of CD4+ cells particularly at 60 h postinoculation of GVII and GVIII when compared with control and their corresponding time point in chickens inoculated with LSGVII and LSGVIII. In addition, chickens inoculated with NDV LaSota showed a significant increase of CD4+ cells at 12 h p.i, but the population of the cells decreased significantly at 36 and 60 h p.i. The finding of this study is in agreement with Rasoli et al. (19) who also reported reduction of CD4+ cells in the spleen after inoculation of genotypes VII and GVIII. Furthermore, CD4+ cells in the spleen and in circulation were reported to be significantly low 1-week postinoculation of live NDV LaSota (16).
At 60 h p.i of LSGVII and LSGVIII however, there was a significant increase of CD4+ cells when compared with chickens inoculated with their corresponding GVII and GVIII only. It remains unclear why chickens inoculated with live NDV LaSota showed decrease in the population of CD4+ cells at 60 h p.i, but increased CD4+ cells in chickens inoculated with LSGVII or LSGVIII at 60 h p.i. Although primary inoculation of NDV LaSota may be attributed to the increase in CD4+ cells in LSGVII and LSGVIII inoculated groups, further investigation is however needed on the pattern of the increase and it functional significance.
In this study, we have seen a significant increase in the population of CD8+ cells in chickens inoculated with LaSota, LSGVII or LSGVIII when compared with chickens inoculated with GVII or GVIII. T cells that express CD8 molecule (4) function as cytotoxic cells (14). The increase in the population of CD8+ cells is not surprising, as the response of CD8+ cells is assisted by cytokines produced by polarized Th-1 such as IFN-γ (6), and live NDV LaSota had since been reported to induce Th1 response (6). The decrease in the population of CD8+ cells in chickens inoculated with NDV GVII or GVIII is in agreement with Rasoli et al. (19) who reported a significant depletion in splenic CD8+ cells by both genotypes VII and VIII, but more severe in chickens inoculated with NDV genotype VII.
The amount of virus shedding at different time points showed that the highest virus shedding was obtained at 60 h postinfection of GVII when compared with NDV shedding in all the other time points. Group comparison showed that the lowest virus shedding was in chickens inoculated with NDV LaSota. Similarly, chickens inoculated with LSGVII or LSGVIII showed a decrease shedding of GVII or GVIII respectively, when compared with NDV GVII or GVIII shedding in GVII or GVIII inoculated groups respectively. It was reported that an increase expression of chicken IL-2 surface receptor during replication of virulent NDV at 4–5 days postinfection causes decreased systemic viral load (26).
The IL-2 receptor is express by NK and some other immune cells. Since our finding have shown a decrease in the population of CD25+ cells, an important NK cell marker, the increase in shedding of NDV GVII in this study may be attributed to the reduction in the expression of IL-2 after inoculation of GVII. In this study, we have shown a decrease in shedding of NDV GVIII in chickens inoculated with NDV GVIII when compared with shedding of NDV GVII in GVII inoculated group. A study has reported that infection with NDV GVIII has been associated with lower IL-10 expression and lower viral load (13). The decrease in NDV GVIII shedding in GVIII inoculated group in this experiment therefore, may be due to the lower expression of IL-10.
In this study, there was low shedding of NDV LaSota in chickens inoculated with NDV LaSota when compared with shedding of vNDV in chickens inoculated with NDV GVII, GVIII, LSGVII, and LSGVIII. Lentogenic strain LaSota is known to have low tissue tropism in the host, hence low replication rate and a resultant low virus shedding. In addition, it was reported that NDV lentogenic strain do not inhibit TLR7 signaling and do not activate M1-/M2 of chicken macrophages as well. However, findings have shown that the enhanced replication of a virulent NDV and subsequent more shedding was because the virus activates an M1-/M2 of chicken macrophages through inhibition of TLR7 (32).
In addition, there is strong correlation between virus shedding and the critical role of proteolytic activation of Fusion glycoproteins, that is, gene that determines the virulence of NDV. Spread of NDV lentogenic strain is inhibited as soon as the virus infects cells that is nonpermissive to the virus because F glycoprotein will not be activated. In contrast, F glycoprotein of virulent virus can be cleaved in a wide spectrum of cells, resulting in rapid production of high levels infectious virus and hence more shedding (12).
Conclusions
The findings of this study showed that NDV GVII and GVIII caused a significant reduction in the population of CD25+, CD3+, CD4+, and CD8+ cells. In chickens inoculated with LaSota, LSGVII, and LSGVIII, however, there was an increase in the population of these cells. Furthermore, this study showed that the highest NDV shed was GVII at 60 h from chickens inoculated with GVII in the 3rd experimental group. However, in the corresponding LSGVII inoculated chickens of group 4 in the experiment, low GVII was shed. Therefore, NDV LaSota may increase the population of avian IEL subsets despite vNDV challenge. In addition, NDV LaSota may cause a reduction in the amount of NDV shedding. It would be interesting to investigate the mechanisms of the effect of NDV strains in the alteration of these lymphocytes and their relationship with virus shedding.
Footnotes
Authors' Contributions
A.I., A.R.O., and M.H.-B. designed the experiments; T.M.H. performed the experiment and drafted the article; T.M.H. and H.B.A. conducted the analyses; A.I. and A.R.O. revised the article.
Acknowledgments
We thank Dr. Abdullahi Abdullahi Raji of Veterinary Pathology, Usman Danfodio University Sokoto, Nigeria, for his technical assistance during virus propagation. Similarly, the authors wish to thank Dr. Muhammad Bashir Bello of the Department of Veterinary Microbiology, Usman Danfodio University Sokoto, Nigeria, for his guidance during virus titration and inoculation into SPF chickens.
Author Disclosure Statement
No competing financial interests exist.
Funding Information
Funding was provided by Ministry of Higher Education, Government of Malaysia, grant no.: 9589900.
Supplementary Material
Supplementary Data S1
Supplementary Data S2
Supplementary Data S3
Supplementary Data S4
References
Supplementary Material
Please find the following supplemental material available below.
For Open Access articles published under a Creative Commons License, all supplemental material carries the same license as the article it is associated with.
For non-Open Access articles published, all supplemental material carries a non-exclusive license, and permission requests for re-use of supplemental material or any part of supplemental material shall be sent directly to the copyright owner as specified in the copyright notice associated with the article.