
Abstract
Chikungunya (CHIKV) is an emerging worldwide viral threat. The immune response to infection can lead to protection and convalescence or result in long-term sequelae such as arthritis. Early innate immune events during acute infection have been characterized for some cell types, but more must be elucidated with respect to cellular responses of monocytes and other myeloid lineage cells. In addition to their roles in protection and inflammation resolution, monocytes and macrophages are sites for viral replication and may also act as viral reservoirs. These cells are also found in joints postinfection, possibly playing a role in long-term CHIKV-induced pathology. We examined kinetic and phenotypic changes in myeloid lineage cells, including monocytes, in cynomolgus macaques early after experimental infection with CHIKV. We found increased proliferation of monocytes and decreased proliferation of myeloid dendritic cells early during infection, with an accompanying decrease in absolute numbers of both cell types, as well as a simultaneous increase in plasmacytoid dendritic cell number. An increase in CD16 and CD14 was seen along with a decrease in monocyte Human Leukocyte Antigen–DR isotype expression within 3 days of infection, potentially indicating monocyte deactivation. A transient decrease in T cells, B cells, and natural killer cells correlated with lymphocytopenia observed during human infections with CHIKV. CD4+ T cell proliferation decreased in blood, indicating relocation of cells to effector sites. These data indicate CHIKV influences proliferation rates and kinetics of myeloid lineage cells early during infection and may prove useful in development of therapeutics and evaluation of infection-induced pathogenesis.
Introduction
Chikungunya is a rapidly emerging arboviral disease, with outbreaks occurring commonly in India and Southeast Asia (37), which has resulted in ∼1.9 million cases worldwide (27). Since at least 2013, autochthonous transmission has occurred in the Americas (21), with over 992,000 cases reported, including 332,000 in the United States and Canada (25a). Clinical infection leads to a rapid onset, self-limiting, febrile illness with highly debilitating arthritic sequelae sometimes lasting months or years after infection (23,30), with mortality generally resulting from neuroinvasive manifestations or severe organ dysfunction (3,11).
Immune response to early Chikungunya (CHIKV) infection has been characterized with respect to natural killer (NK) cells, known to mediate the innate response against viral infection (17). Clonal expansion of NK populations was highly correlated with viral titer in endemicallyinfected human populations (26). NK cells are not necessary for protection from CHIKV infection (28), instead displaying markedly altered expression of innate immune modulators such as interferon (IFN)-ɣ (26,34), and may instead play a role in development of chronic arthritis arising from infection (15,25).
A functional type I IFN response, important in the activation of monocytes and macrophages (31), is necessary for protective immunity to CHIKV infection (2,29). Monocytes and macrophages provide antiviral activities during infection (8,12), as well as immunoregulatory functions to resolve inflammation (16). In addition to their protective role during infection, monocytes and macrophages are likely to play a role in joint damage in CHIKV-induced arthritis, appearing in affected tissue along with mononuclear lymphocytes (10,15). CHIKV actively replicates in monocytes/macrophages (4), and persists within the cells, with macrophages serving as major viral reservoirs (19).
Dendritic cells (DCs) are an important cell type for early response to CHIKV infection (15), with abrogated DC responses associated with increased disease severity (22). Myeloid DCs (mDCs) exhibit a lowered number and delayed response in aged Rhesus macaques, coinciding with higher viral titers during infection (24). Plasmacytoid dendritic cells (pDCs) also control CHIKV infection through type I IFN responses following CHIKV-infected cell contact, although nuclear factor-ĸB responses are excluded, thus potentially avoiding damage associated with other innate inflammatory responses (38). This cascade suggests that DCs are an important cellular subset in the early control of infection.
In this study, we investigated innate immune responses by myeloid lineage cells, which include monocytes, macrophages, and DCs in acute CHIKV infection that respond before the onset of adaptive immunity. We examined the phenotypic patterns and kinetics of monocytes, mDCs, and pDCs during early Chikungunya infection in cynomolgus macaques. The data presented expand on current knowledge surrounding the innate immune responses to early CHIKV infection, which contribute to both pathogen clearance and long-term pathological consequence arising from this disease.
Materials and Methods
Animals
Age-matched cynomolgus macaques (Macaca fascicularis) weighing 3–6 kg, free of simian immunodeficiency virus (SIV), simian type D retrovirus, simian T-lymphotropic virus, and alphavirus antibodies against western, Venezuelan, and eastern equine encephalitis virus, Sindbis virus, Semliki Forest virus, and CHIKV (assayed by hemagglutination inhibition) were used. The study was approved by the Institutional Animal Care and Use Committee at Tulane University, and all animals were handled in accordance with guidance from the American Association for Accreditation of Laboratory Animal Care.
Viral challenge and assays
Anesthetized macaques were challenged with a single subcutaneous inoculation in the upper deltoid with wild-type CHIKV-LR (5.0 log10 PFU in a volume of 100 μL). Blood was collected on days 1–3, 6, 9, 13, and 35 after challenge, when the experiment was terminated. Virus titers were determined on Vero cells (ATCC) using standard methods (20).
Bromodeoxyuridine inoculation
Bromodeoxyuridine (BrdU) was dissolved in phosphate-buffered saline (PBS) at 30 mg/mL and inoculated intravenously at 60 mg/kg body weight 2 days postchallenge. Ethylenediaminetetraacetic acid (EDTA) blood was collected at 1, 4, 7, and 11 days post-BrdU administration.
Flow cytometric analysis
EDTA blood was stained for flow cytometric analysis. The following monoclonal antibodies were used in this study: anti-BrdU-FITC (3D4 BD Biosciences, San Jose, CA), CD45-PE (MB4-6D6 Miltenyi Biotec, San Jose, CA), CD20-ECD (B9E9 Beckman Coulter, Indianapolis, IN), CD123-PerCP Cy5.5 (BD), Human Leukocyte Antigen–DR isotype (HLA-DR)-PE-Cy7 (L243; BD Biosciences), CD16-APC-H7 (3G8; BD Biosciences), CD14-Pacific Blue (M5E2; BD Biosciences), CD8-AmCyan (SK1; BD Biosciences), CD4-PerCP-Cy5.5 (L200; BD Biosciences), and NKG2a-APC (Z199; Beckman Coulter). Blood was first stained with surface antibodies for 20 min.
After lysing red blood cells with 1 × fluorescence-activated cell sorting lysing solution (BD Biosciences), cells were permeabilized with Cytofix/Cytoperm (BD Biosciences) for 20 min, Permwash buffer (BD Pharmingen) supplemented with 10% dimethyl sulfoxide for 10 min, and Cytofix/Cytoperm for 5 min. The cells were incubated with DNase for 1 h at 37°C, incubated with anti-BrdU antibody for 20 min, and fixed with 1% paraformaldehyde (Electron Microscopy Systems). Cells were acquired with LSR II (BD Biosciences) and analyzed using FlowJo software (TreeStar, Inc.).
Complete blood counts and absolute counts of each cell population
The complete blood counts (CBC) were analyzed on an ADVIA 120 Hematology System (Bayer Diagnostics). The absolute counts of CD14+ monocytes, mDCs, pDCs, CD4+ T cells, CD8+ T cells, B cells, and NK cells in blood were calculated from white blood cell (WBC) counts from CBC data and flow cytometric analysis for each cell population.
Statistical analysis
The statistical analysis was performed using GraphPad Prism software (GraphPad, San Diego, CA). Analysis was performed on prechallenge and postexposure data comparisons and defined as significant by established detection thresholds (p < 0.05). The statistical differences were analyzed either through two-way analysis of variance (ANOVA) with Sidak's multiple comparison test or by the Mann–Whitney test and defined as significant.
Results
Viral kinetics and gating strategy
Following challenge, virus levels were examined each day using plaque assay. Blood levels of CHIKV fell rapidly after initial peaks of 5.0 log10 on day 2 postchallenge. By day 3 postchallenge, viremia was absent in five out of seven animals (Supplementary Table S1).
Cells were subdivided based on gating of cell markers. Monocytes, mDCs, and pDCs were identified as CD45+CD3−CD20−CD8− cells, CD45+HLA-DR+Lin (CD3, CD20, CD8, and CD14)-CD123− cells, and CD45+HLA-DR+Lin-CD123+ cells, respectively. CD14 and CD16 expression pattern were used for subdividing monocyte population within the HLA-DR+ cell population (Fig. 1).

Gating strategy and phenotypes of myeloid lineage cells in peripheral blood from naive cynomolgus macaques.
Proliferation of myeloid lineage cells during acute infection
We examined kinetics of monocyte, mDC, and pDC proliferation by using in vivo BrdU labeling and flow cytometric analysis. BrdU was administered into CHIKV-infected animals 2 days postchallenge and blood was collected 1, 4, 7, and 11 days later. We compared the kinetics of the percentages of BrdU+ cells in monocytes, mDCs, and pDCs between uninfected macaques and acutely CHIKV-infected macaques (Fig. 2). Peripheral blood was collected at indicated time points (1–11 days) after BrdU administration and the appearance of BrdU+ cells was investigated in each cell population.
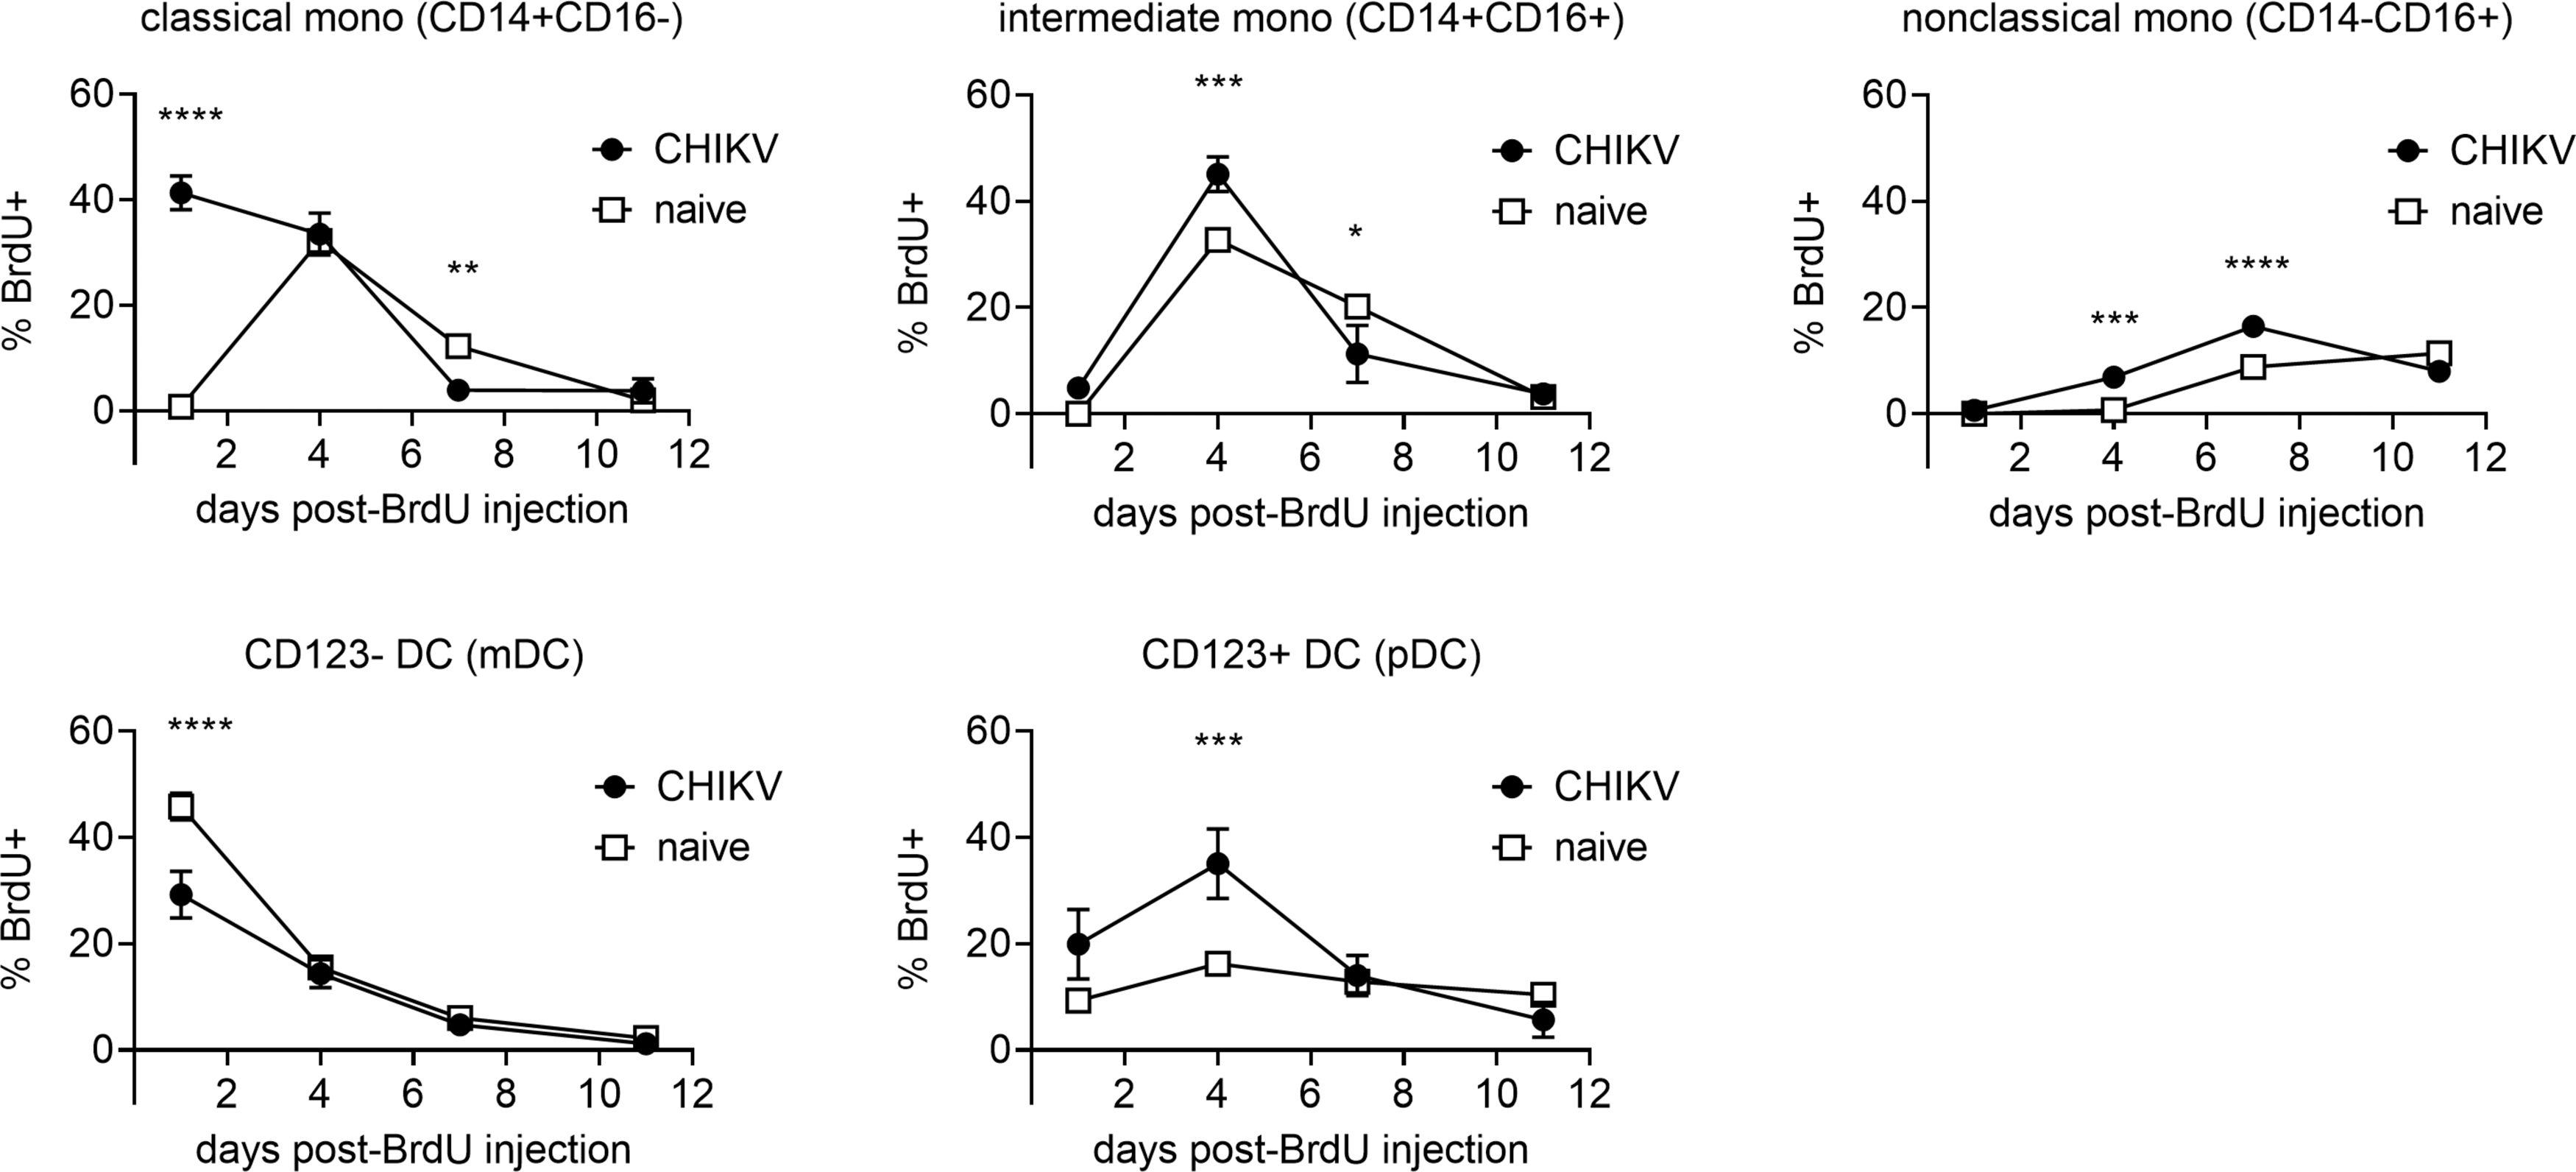
Kinetics of cell proliferation of myeloid lineage cells in acute CHIKV infection. CHIKV-infected macaques were administrated BrdU at 2 days postinfection. Blood was collected serially after BrdU administration and stained for flow cytometric analysis. Monocytes, mDCs, and pDCs were identified as described in Figure 1. The percentages of BrdU-positive cells were analyzed for each cell population. Data are represented as group means plus SEM. The statistical differences were analyzed using two-way ANOVA with Sidak's multiple comparison test. Asterisks represent significant comparisons (*p < 0.05; **p < 0.01; ***p < 0.001; ****p < 0.0001). ANOVA, analysis of variance; BrdU, Bromodeoxyuridine; CHIKV, Chikungunya; SEM, standard error of the mean.
Homogeneous kinetics of BrdU+ cells were observed in monocytes, mDCs, and pDCs obtained from eight uninfected macaques (Supplementary Fig. S1). In contrast, the peaks of BrdU+ cells in classical monocytes shifted to earlier time points in CHIKV-infected macaques, with levels of proliferation by day in intermediate and nonclassical monocyte subsets slightly altered, although the overall patterns remained similar (Fig. 2).
We analyzed the significance of increased cellular proliferation for monocyte, mDC, and pDC BrdU injection. BrdU+ monocytes in CHIKV-infected macaques were significantly higher than that from uninfected animals on days 1, 4, and 4 and 7 for classical, intermediate, and nonclassical monocyte populations, respectively. Populations fell below naive macaques on day 7 for classical and intermediate monocytes. Circulating mDCs were significantly lower in CHIKV-infected macaques day 1 postchallenge, with pDCs significantly higher on day 4 postchallenge in the CHIKV-infected cohort (Fig. 2).
Absolute cell counts of monocytes and DCs in acute CHIKV infection
Consistent with the BrdU-based findings, monocyte counts decreased rapidly after challenge, but rebounded with an increase between 2 and 6 days after infection, depending on cellular subset. Dramatic changes were observed in mDCs and pDCs, with mDCs largely disappearing from the blood rapidly after infection, with blood pDCs massively increasing at the same time (Fig. 3, Supplementary Fig. S2).
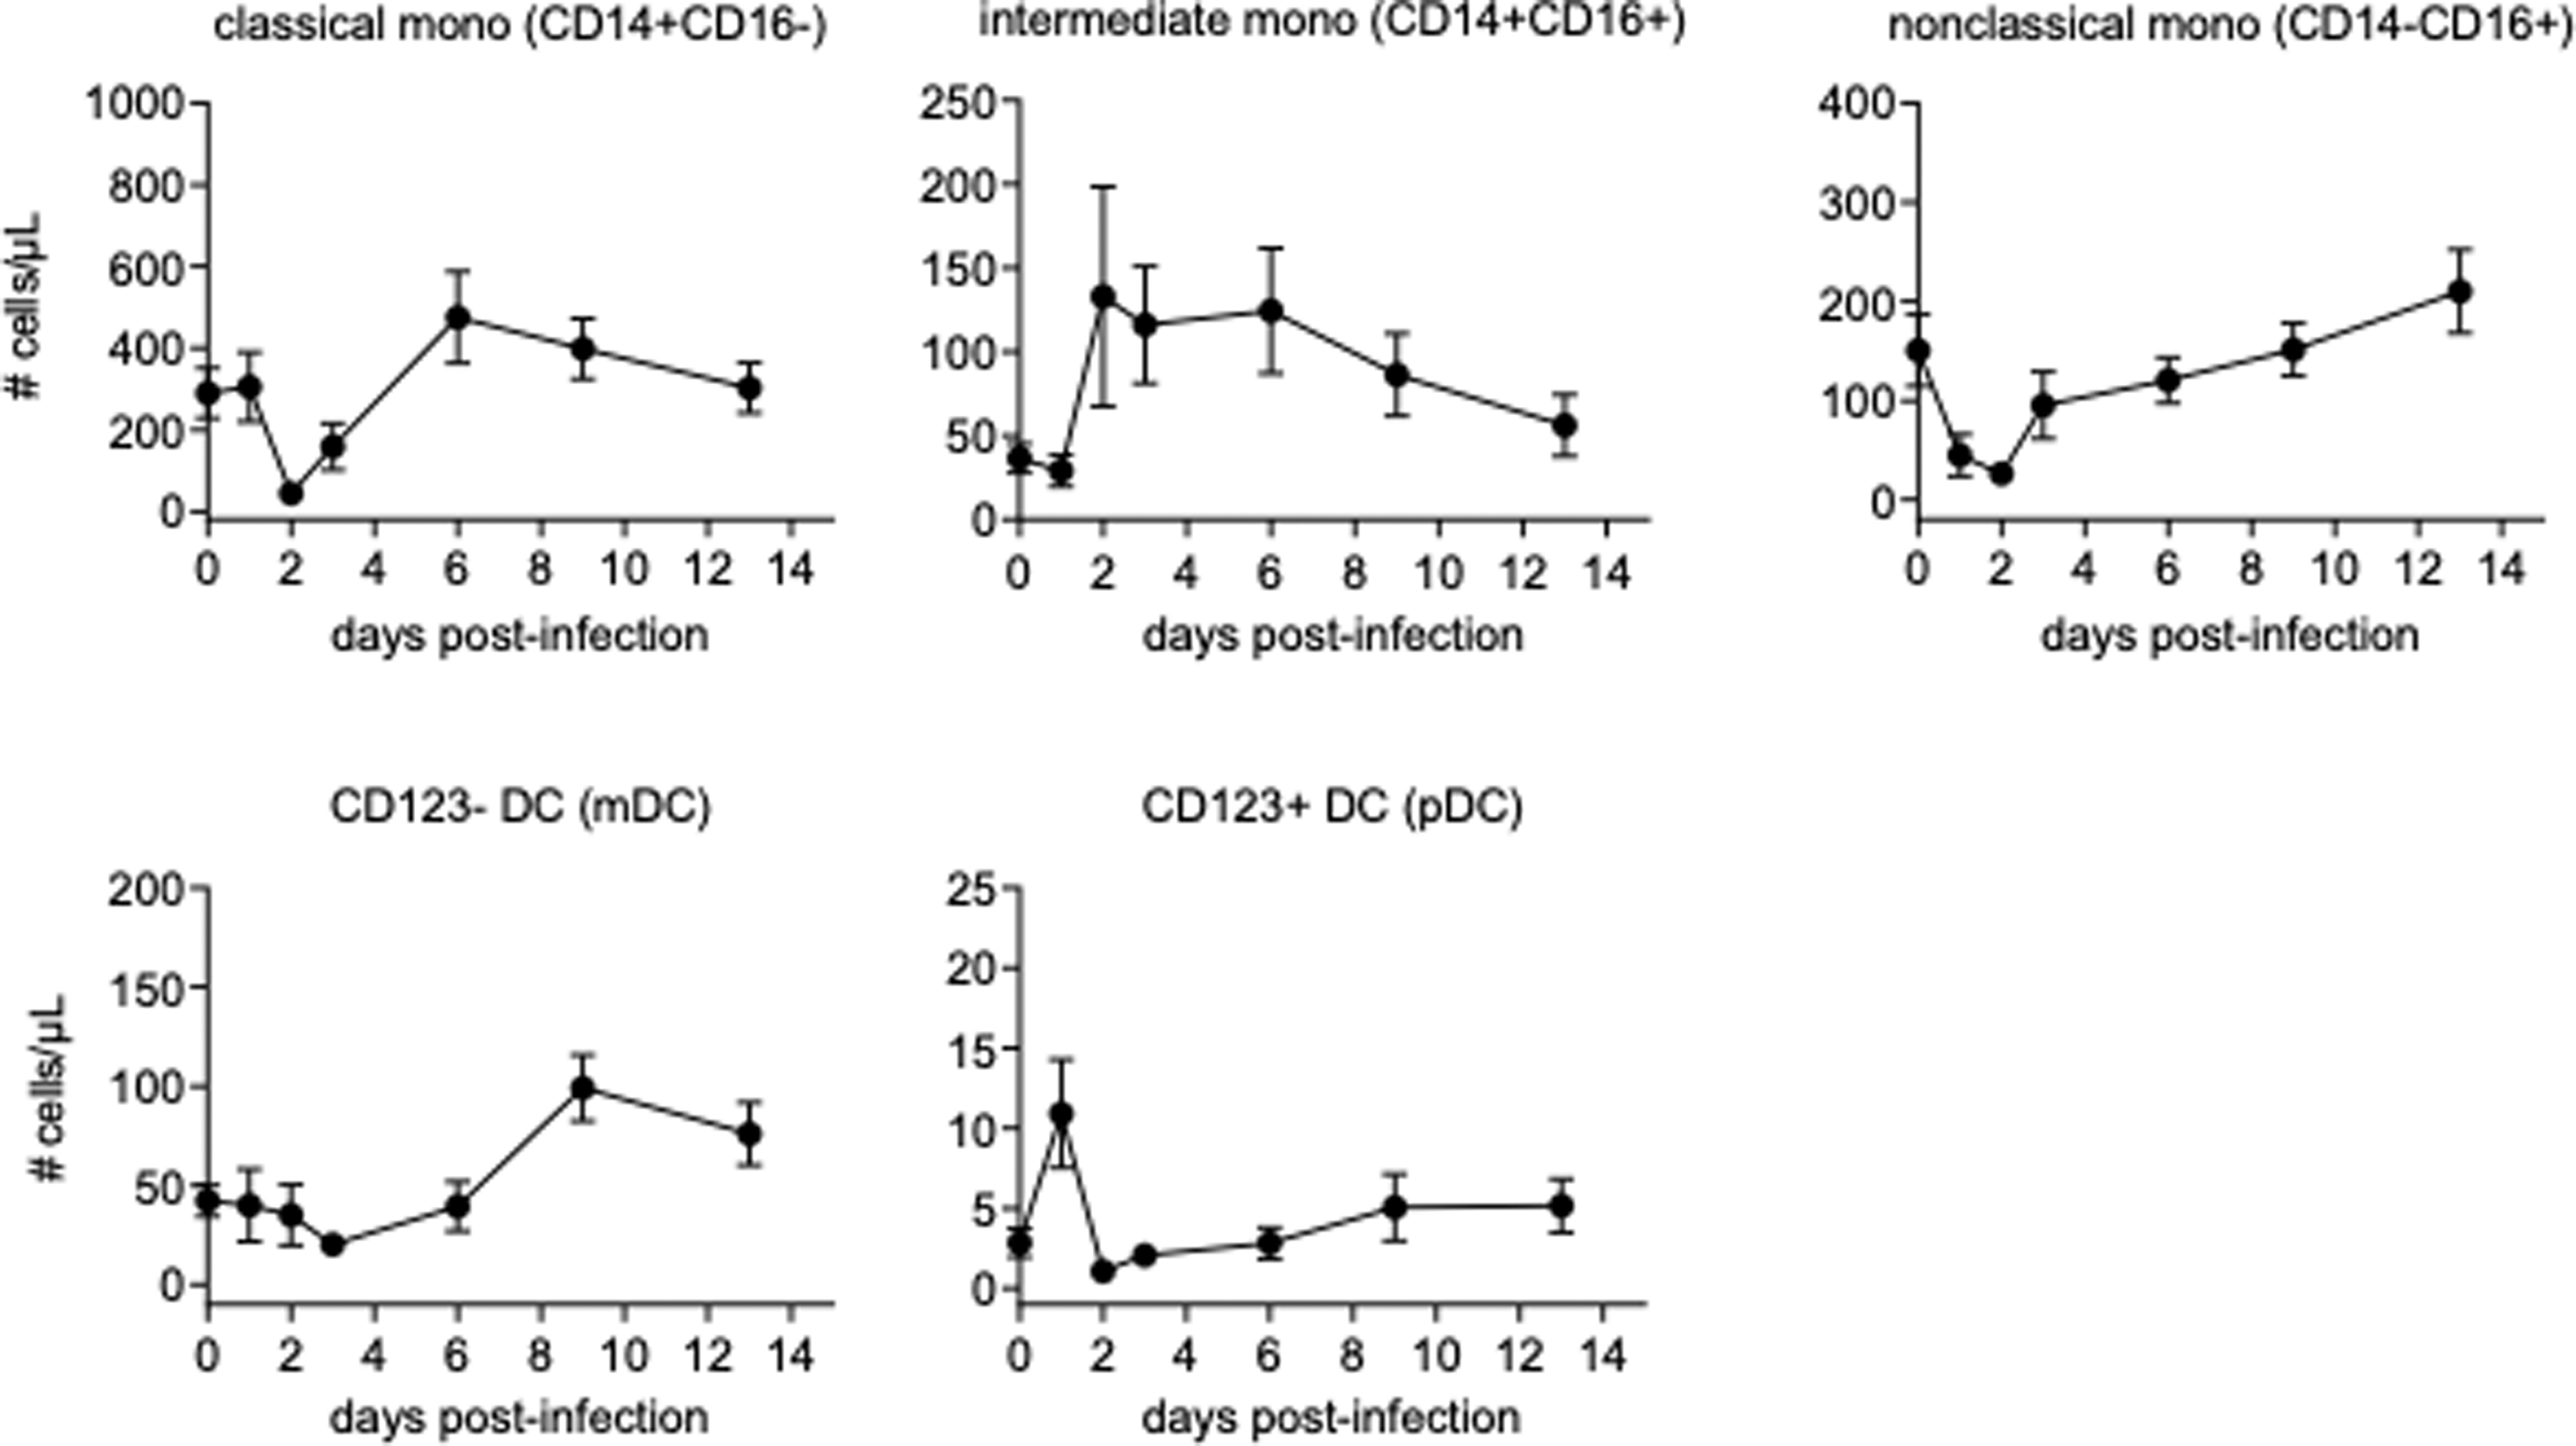
Absolute counts of monocytes, mDCs, and pDCs. Absolute counts of monocytes, mDCs, and pDCs were obtained from calculation based on flow cytometric gating and CBC. Data are represented as group means plus SEM. CBC, complete blood counts.
Phenotypic changes in monocytes from CHIKV-infected macaques
CD16 expression was significantly upregulated within 2 days after CHIKV infection and returned to the prechallenge level roughly 1 week after infection (Fig. 4A). Although we could not obtain blood samples at 2 days after infection in every animal, 2 days post-CHIKV challenge was the peak of CD16 expression in the individuals from which we were able to obtain blood (Fig. 4B). CD14 expression was significantly higher 3 days postchallenge compared to prechallenge (Fig. 4C).

Altered CD14 and CD16 expression on myeloid lineage cell populations after CHIKV infection. The CD45+CD3−CD20−CD8− population (as described in Fig. 1) was examined for CD14 and CD16 expression by using serially collected blood after CHIKV infection.
Furthermore, we determined that the HLA-DR expression on monocytes decreased in acute CHIKV infection (Fig. 5). Although DC populations were HLA-DR positive, the downregulation of HLA-DR was not observed in either mDCs or pDCs (Fig. 5A). HLA-DR-negative or low monocytes appeared 1 day after infection and returned to the uninfected level within 1 week after infection in most animals (Fig. 5B). The majority of HLA-DR-downregulated monocytes were CD16 negative (data not shown). There was no difference in the cellular proliferation between HLA-DR low/neg monocytes and HLA-DR hi monocytes (data not shown).

HLA-DR downregulation in monocytes, but not in mDCs and pDCs in acute CHIKV infection. Monocytes, mDCs, and pDCs were gated as Figure 1. The expression of HLA-DR was analyzed for each cell population.
Cellular proliferation and absolute counts of T cell, B cell, and NK cell in acute CHIK infection
We examined the cellular proliferation and the absolute counts of the cell population related to adaptive immunity such as CD4+ T cells, CD8+ T cells, and B cells in blood. We also analyzed those for NK cells, since it has been reported that a phenotypic change and a clonal expansion were observed in NK cells in acutely CHIKV-infected humans (26), although it should be noted that our analysis included only a subset of NK cells. CD4+ T cells, CD8+ T cells, B cells, and NK cells temporarily decreased in a similar manner after infection, with a decrease shortly after challenge and a rebounding observed as time passed, although CD4+ T cells were more stable than the others examined (Fig. 6, Supplementary Fig. S3).
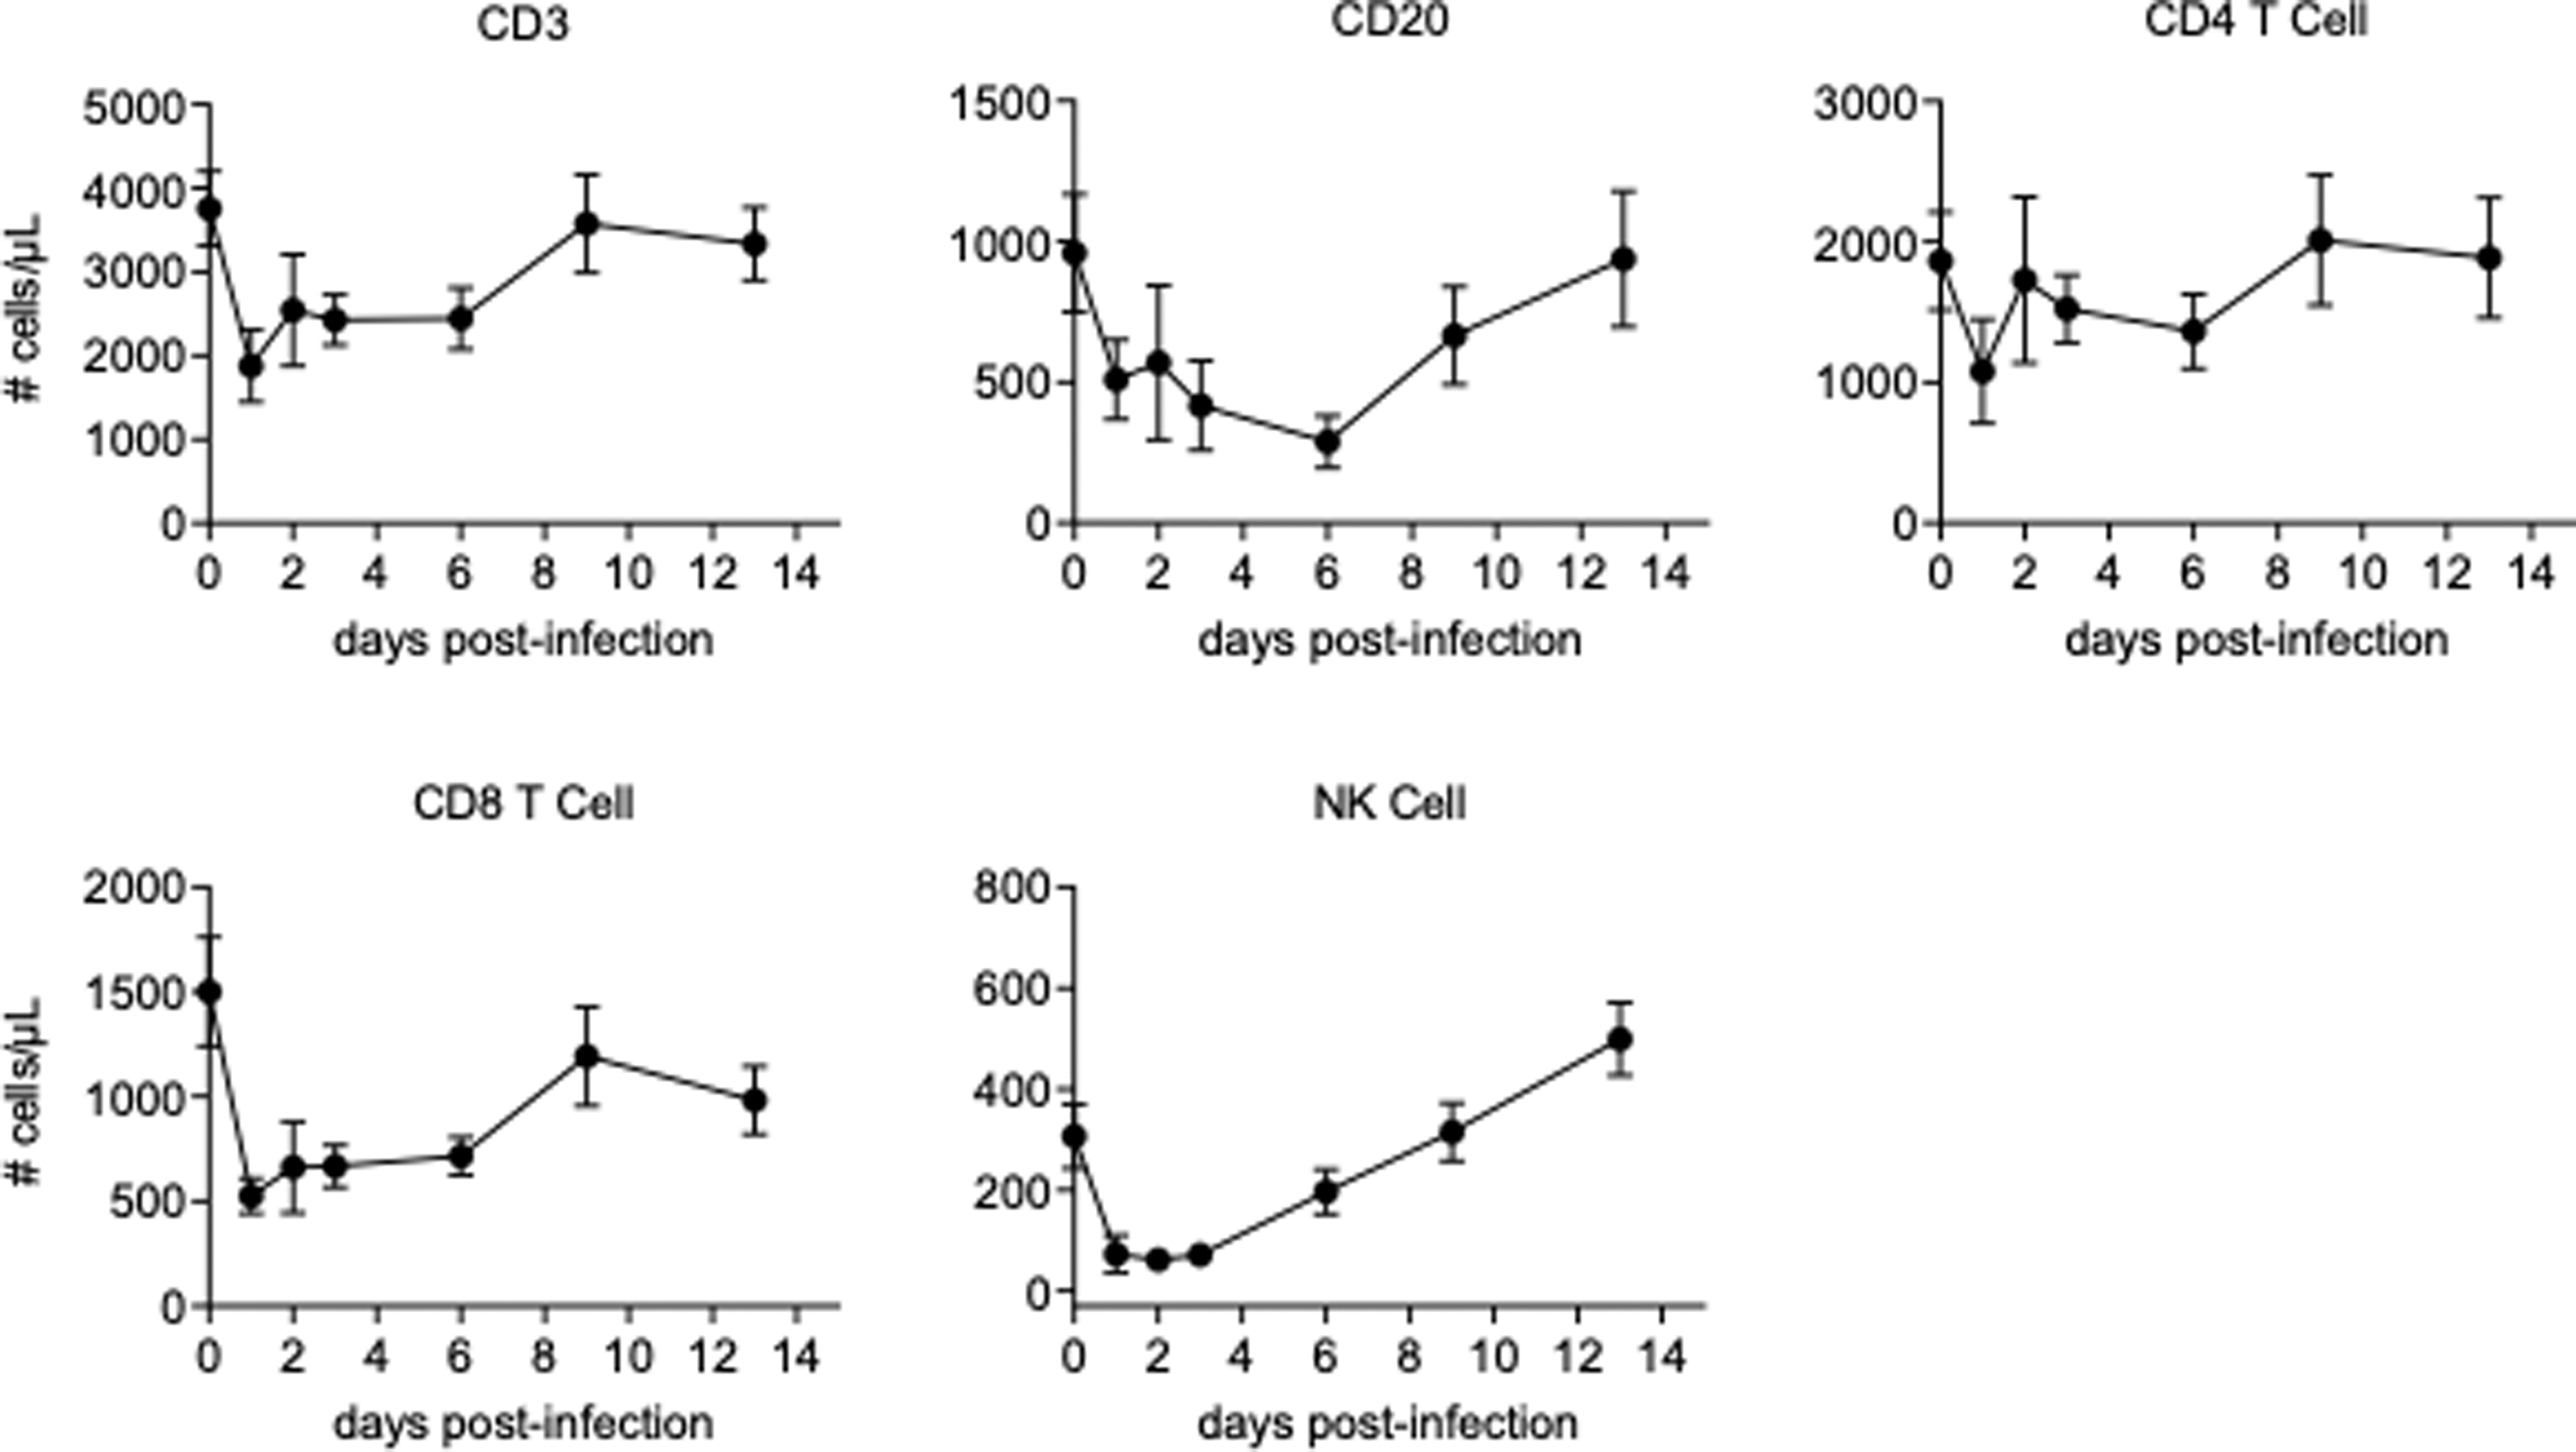
Absolute counts of CD3+ T cells, CD20+ B cells, CD4+ T cells, CD8+ T cells, and NK cells. Absolute count of each lymphocyte subset was obtained from the calculation based on flow cytometric gating and CBC-based WBC counts. Data are represented as group means plus SEM. NK, natural killer; WBC, white blood cell.
Although the kinetics of the cell counts were similar, there were differences in proliferation among the cell populations. The cellular proliferation rates of CD4+ T cells were significantly decreased in acute infection (Fig. 7A), with CD8+ T cells also trending toward significant decreases (Fig. 7B). Cellular proliferation rates of B cells and NK cells were not significantly altered by day 4 postinfection (Fig. 7C, D).

Lymphocyte proliferation in acute CHIKV infection. CHIKV-infected macaques were administered BrdU at 2 days postinfection. Blood was collected serially after BrdU administration and stained with anti-CD3, CD4, CD8, CD20 and NKG2a, and BrdU antibodies for flow cytometric analysis. The data were compared to those form uninfected macaques. The cellular proliferation of CD4+ T cells (CD3+CD20−CD8−), CD8+ T cells (CD3+CD4-CD8+), CD20+ B cells (CD3−CD20+), and NK cells (CD3−CD20− CD8+NKG2a+) is shown in
Discussion
The work presented in this study demonstrates myeloid lineage cell alteration in number, proliferation status, and phenotype during infection with CHIKV. We demonstrated increased proliferation of monocytes early during CHIKV infection, which extended to pDCs at a later time point, with an early lowered proliferative rate for mDCs that resolved quickly (Fig. 2). These changes tracked well with circulating cell counts showing an early decrease of monocytes and mDCs, with an increase over time in all cell types, but an early increase of pDCs (Fig. 3). pDCs are known as type I IFN-producing cells that rapidly secrete massive amounts of type I IFN after activation through TLR7 and/or TLR9 by sensing ssRNA or CpG motifs in DNA derived from viral and bacterial genomes (32,33).
Therefore, extremely high CHIKV viral loads might result in an increased number of pDCs, activation of pDCs, and induction of type I IFN by pDCs. The early drop in circulating mDCs may be from increased tissue distribution, or an increase in apoptosis. Both are seen in SIV-infected macaques, along with a large drop in mDC number early during infection in one species of macaque, coinciding with more pathogenic infection; only a transient depletion is characterized during less severe disease (39). We have found that the cell turnover in monocytes during SIV infection is highly correlated with progression to AIDS (14), indicating monocyte/macrophage dynamics can play a large role in disease progression.
These myeloid lineage cell changes were accompanied by alterations in the phenotype of monocytes, with CD16 expression peaking at 2 days postchallenge, and CD14 expression peaking on day 3 (Fig. 4). CD16 is a marker of activation in monocytes, and corresponds to increases in proinflammatory cytokine secretion, which are seen in early CHIKV infection (6,36). A considerable increase in the number of CD14+CD16+ monocytes had been described for a variety of systemic, infectious agents in humans, including hemolytic uremic syndrome (5), bacterial sepsis (7), HIV (13), and experimental SIV infections in nonhuman primates (18).
Monocytes expressing HLA-DR significantly dropped early during CHIKV infection, with a rebound seen by 1 week postchallenge. This effect was not seen in DCs (Fig. 5). Decreased HLA-DR expression is a hallmark of deactivated monocytes in patients with systemic inflammation, and this immune status is often referred to as compensatory anti-inflammatory response syndrome (9). In in vitro studies, IL-10, an anti-inflammatory cytokine, induces HLA-DR downregulation on monocytes (40). Plasma IL-10 levels increased with increased induction of proinflammatory cytokines in acutely CHIKV-infected humans (35).
We observed a temporary decrease in CD4+ and CD8+ T cells, as well as B cells and NK cells early during CHIKV infection (Fig. 6). This result corresponds to the lymphocytopenia observed in prior nonhuman primate models (19), as well as in humans (1). Proliferation rates were altered during acute infection, with a decrease in rates of T cells, but no change in B cells or NK cells (Fig. 7). This suggests that proliferating CD4+ T cells and CD8+ T cells might preferentially relocate from the blood circulation to the effector sites.
These findings supplement previous work characterizing macrophages as virus reservoirs in cynomolgus macaques (19). More detail regarding kinetics and phenotype of immune cells during infection with CHIKV can aid in the development of therapeutics, as well as provide more detail as to the relevance of nonhuman primate models to human infection.
Conclusion
The early responses to chikungunya infection in the cynomolgus macaque are further examined in this study. Our findings suggest that this viral infection affects the kinetics of proliferation of myeloid lineage cells, especially monocytes and DCs, as evidenced by their dramatic change in the absolute number and phenotypes early after infection. Future work should further elucidate how these phenotypic and kinetic changes contribute to pathologic mechanisms of acute CHIKV infection, as well as its pathologic sequelae.
Footnotes
Author Disclosure Statement
No competing financial interests exist.
Funding Information
This work was supported by a grant from the National Institute of Allergy and Infectious Disease (NIAID) through the Western Regional Center of Excellence for Biodefense and Emerging Infectious Disease Research, National Institutes of Health (NIH) grant U54 AIO57156. This work was also supported, in part, by NIH/NCRR grant number P51 RR000164.
Supplementary Material
Supplementary Table S1
Supplementary Figure S1
Supplementary Figure S2
Supplementary Figure S3
References
Supplementary Material
Please find the following supplemental material available below.
For Open Access articles published under a Creative Commons License, all supplemental material carries the same license as the article it is associated with.
For non-Open Access articles published, all supplemental material carries a non-exclusive license, and permission requests for re-use of supplemental material or any part of supplemental material shall be sent directly to the copyright owner as specified in the copyright notice associated with the article.