
Abstract
Understanding the development and sustainability of the virus-specific protective immune response to infection with severe acute respiratory syndrome coronavirus-2 (SARS-CoV-2) remains incomplete with respect to the appearance and disappearance of virus-specific antibody-secreting cells (ASCs) in circulation. Therefore, we performed cross-sectional and longitudinal analyses of peripheral blood mononuclear cells and plasma collected from 55 hospitalized patients up to 4 months after onset of COVID-19 symptoms. Spike (S)- and nucleocapsid (N)-specific IgM and IgG ASCs appeared within 2 weeks accompanied by flow cytometry increases in double negative plasmablasts consistent with a rapid extrafollicular B cell response. Total and virus-specific IgM and IgG ASCs peaked at 3–4 weeks and were still being produced at 3–4 months accompanied by increasing antibody avidity consistent with a slower germinal center B cell response. N-specific ASCs were produced for longer than S-specific ASCs and avidity maturation was greater for antibody to N than S. Patients with more severe disease produced more S-specific IgM and IgG ASCs than those with mild disease and had higher levels of N- and S-specific antibody. Women had more B cells in circulation than men and produced more S-specific IgA and IgG and N-specific IgG ASCs. Flow cytometry analysis of B cell phenotypes showed an increase in circulating B cells at 4–6 weeks with decreased percentages of switched and unswitched memory B cells. These data indicate ongoing antigen-specific stimulation, maturation, and production of ASCs for several months after onset of symptoms in patients hospitalized with COVID-19.
Introduction
The pandemic caused by severe acute respiratory syndrome coronavirus 2 (SARS-CoV-2), has spread worldwide with devastating personal, economic, and health care consequences (15). SARS-CoV-2 is transmitted efficiently by the respiratory route with outcomes that range from asymptomatic infection to life-threatening and fatal COVID-19 (31,37,54,90). For those who survive, illness can be prolonged, recovery slow, and long-term consequences (including immunity to reinfection) uncertain (84).
Antibody production is a critical component of the protective immune response to viral infections, but durability of this response is variable. Recovery from many systemic viral diseases leads to the induction of protective levels of antibody that are sustained for decades while antibody responses to many respiratory virus infections are short-lived and reinfection is common (2,3,26,28,35,55). SARS-CoV-2 infects the respiratory tract and most patients have detectable antibodies to the immunodominant spike (S) and nucleocapsid (N) antigens at the onset of clinical disease (58,65,73). S contains the binding domain for the ACE2 receptor and induces antibodies that neutralize virus infectivity but is prone to mutation while N encapsidates the virion RNA and is highly conserved (4,11,82,86,89).
Although antibody persists for many months in most individuals who recover (23,32,88), the long-term durability of antibody production and protection from reinfection are not yet known. Experience with related coronaviruses that cause SARS and middle east respiratory syndrome suggests that neither S-specific neutralizing antibody nor virus-specific memory B cells are present a few years after recovery, particularly in those with a history of mild disease (1,47,81,93) although T cell memory is more durable (16,94). Understanding the induction and evolution of the immune response to SARS-CoV-2 and its correlation with disease severity is integral to elucidating correlates of long-lasting protection from reinfection.
The antibody response to viral infection in secondary lymphoid tissue occurs in two phases: a rapid extrafollicular production of plasmablasts (PBs) synthesizing germ line IgM, IgA, and IgG3 and a slower germinal center response to generate memory B cells and plasma cells (PCs) synthesizing affinity-matured immunoglobulin (6). Extrafollicular antibody-secreting cells (ASCs) produce antiviral antibody important for early protection but are short lived (19,42,53,62,63).
For development of long-term humoral immunity to viral infections, this rapid response needs to be followed by the germinal center response to foster B cell proliferation, somatic hypermutation of variable region immunoglobulin genes, and B cell selection based on receptor affinity for antigen. Germinal center formation is often transient but can be prolonged after viral infection with continuing production of virus-specific ASCs for months (6,51,57,60). These ASCs can differentiate into bone marrow-resident long-lived PCs that sustain plasma antibody for decades and memory B cells that can rapidly become ASCs if reinfection occurs (8,74,78,80,85).
Studies of COVID-19 patients indicate simultaneous early appearance of antiviral IgM, IgA, and IgG in plasma with an increase in numbers of PBs detected by flow cytometry consistent with activation of the short-lived extrafollicular response (34,48,77,91). Studies have also documented production of memory B cells (27,61,75), but autopsy studies of lymph nodes from fatal cases of COVID-19 have shown defects in germinal center formation that predict a lack of durable antibody production (39). However, few studies have examined ASCs in response to SARS-CoV-2 infection. Release of ASCs producing virus-specific antibody from secondary lymphoid tissue in response to infection can be monitored with peripheral blood mononuclear cell (PBMC) enzyme-linked immunospot (ELISpot) assays.
In this study, we characterize the virus-specific immune responses to SARS-CoV-2 infection over 4 months after infection by determining the numbers of S- and N-specific ASCs, B cell subset phenotypes, and plasma antibody avidity in patients hospitalized with COVID-19.
Materials and Methods
Study participants
Adults 18 years or older admitted to Johns Hopkins Hospital with confirmed SARS-CoV-2 infection (n = 55) were enrolled into a cohort study entitled “Clinical Characterization Protocol for Severe Emerging Infections” (Table 1). Samples were collected between March 15 and June 18, 2020. Basic clinical laboratory data are presented in Supplementary Table S1. Samples from healthy controls enrolled in the Baltimore Before and After Acute Study of Hepatitis (n = 10) were collected between 2014 and 2018 (21). Peripheral blood was collected in acid citrate dextrose tubes and PBMCs were isolated using Ficoll-paque gradients, cryopreserved in fetal bovine serum (FBS) containing 10% dimethyl sulfoxide, and stored in liquid nitrogen as part of the Johns Hopkins Biospecimen Repository. Plasma was frozen at −20°C.
Demographics and Clinical Data for Peripheral Blood Mononuclear Cell Donors at the Time of Study Entry
IQR, interquartile range; LOS, Length of stay; SD, standard deviation.
SARS-CoV-2 antigen preparation, enzyme immunoassays, and avidity measurement
The HEK293F cell line Ftet2 was transfected with plasmids containing a transposon that encodes a puromycin-resistance gene and doxycycline-inducible codon-optimized SARS-CoV-2 nucleocapsid ORF (pCG144) or spike** ORF (pCG146) (33). S is the original SARS-CoV-2 S protein (96) except for proline substitutions that stabilize the trimeric prefusion conformation (986KV987–986PP987) and substitutions that eliminate basic amino acids at the S1/S2 cleavage site (682RRAR685–682GSAG685). Cells were induced with doxycycline, lysed by three freeze-thaw cycles, placed on ice for 30 min, and centrifuged at 14,000 × g for 10 min before storage at −80°C.
Antibody was quantified with enzyme immunoassays (EIAs) using clear Nunc Maxisorp 96-well plates (Thermo Fisher Scientific) coated with lysates from cells expressing S, N, or no viral protein diluted in PBS pH 7.4 (S lysate) or 50 mM bicarbonate buffer pH 9.6 (N lysate). Coating protein concentrations and conditions were optimized for sensitivity and specificity using pre-pandemic plasma as a negative control and known positive convalescent plasma as a positive control. Plates were coated overnight with 2 μg lysate/mL at 4°C, washed with PBS containing 0.05% Tween20 (PBST), and blocked at room temperature (RT) with non-fat milk in PBST (5% and 3 h for N; 3% and 1 h for S). For measurement of IgM, samples were pre-incubated with protein G agarose (Pierce) to reduce IgG competition.
Plasma was serially diluted twofold from 1:50 to 1:102,400 and 50 μL added to each well for 2 h at RT. Horseradish peroxidase-conjugated secondary antibodies were goat anti-human IgG (Abcam; 1:5,000), IgM (μ-chain-specific; Abcam), IgG1 (Southern Biotech; 1:4,000), IgG3 (Southern Biotech; 1:4,000), and IgA (α-chain-specific; Sigma-Aldrich; 1:3,000) with incubation for 1 h at 37°C. The plates were developed with 3,3′,5,5′-tetramethylbenzidine substrate (BD Biosciences) at RT in the dark for 15 min before adding 2M H2SO4 as a stop solution. Plates were read at 450 nm and titer was determined as the highest dilution with an optical density (OD) three times control.
For analysis of IgG avidity EIAs were performed as above with plasma incubation (1:50) for 2 h followed by incubation for 15 min with increasing concentrations (0.5–3.5 M) of ammonium thiocyanate (NH4SCN) to disrupt the antigen–antibody interaction (59). Plates were washed, incubated with the secondary antibody, developed, and read as above. Avidity index was calculated as the concentration of NH4SCN required to remove 50% of the bound antibody. Samples with OD values <0.3 were excluded.
ELISpot assays
MultiScreen-IP 96-well plates (Merck Millipore) were coated at 4°C overnight with 10 μg/mL N lysate, S lysate, or immunoglobulin capture antibody (Rockland). Plates were washed with PBST and blocked with Roswell Park Memorial Institute (RPMI)/10% FBS for 2 h at 37°C.
PBMCs were thawed, washed, and resuspended in RPMI-1640 supplemented with 2 mM glutamine, 100 U/mL penicillin, 100 μg/mL streptomycin, and 10% heat-inactivated FBS. Cells were added in duplicate or triplicate to blocked/coated plates and incubated 5 h at 37°C. Cells were recovered for flow cytometry, plates were washed, horseradish peroxidase-conjugated antibody to IgM, IgG, or IgA as above was added overnight at 4°C and then developed with diaminobenzidine (Vector) for 20 min. Plates were dried, spots were counted on an automated ELISpot reader and reported as spot-forming units (SFUs)/106 PBMCs (Supplementary Fig. S1).
B cell phenotypic analysis by flow cytometry
PBMCs were stained with Fixable Viability Stain 780 (BD Biosciences) to distinguish live/dead cells and blocked using the Anti-Hu Fc Receptor Binding Inhibitor (eBioscience) for 15 min. The following panel was used: anti-CD3 (SK7)/anti-CD14 (MõP9)/CD16 (3G8)—APC-Cy7 as a “dump” channel, IgD (IA6–2)—PE-Cy™7, CD20 (2H7)—BV510, CD138 (MI15)—BV421 (all BD Biosciences), CD19 (HIB19)—PE, CD27 (M-T271)—FITC, CD38 (HIT2)—PerCP/Cyanine 5.5 (all BioLegend). Cells were stained in flow cytometry (FACS) buffer (2% bovine serum albumin and 2 mM ethylenediaminetetraacetic acid in PBS) on ice for 30 min, washed three times, and fixed with 4.2% formaldehyde Cytofix/Cytoperm (BD Biosciences) for 20 min at 4°C.
Data were acquired on a FACSCanto II with FACSDiva Software (BD Biosciences) and analyzed using FlowJo (Treestar, Ashland, OR). Gating strategy was based on fluorescence minus one stain control (Supplementary Fig. S2). The percentages of B cell phenotypes were determined and numbers per microliter calculated based on the patient's absolute lymphocyte count.
Data analysis and statistics
A matrix was generated using log10 of SFU per million PBMCs for ELISpot, titer for EIA, cell number for B cell lymphocyte flow, and avidity index for antibody maturation. R (v4.0) was used to illustrate data, compute significance, and determine features of metadata that contribute to overall variance. The following packages were used: ggplot2, tidyr, dplyr, FactoMineR, cluster, factoextra, gridExtra, ggpubr, corplot, cowplot, gridBase, gtable.
For statistical analysis, data distribution normality was assessed using the Shapiro–Wilk test and Q–Q plots and data were compared using the Wilcoxon rank sum or Student's t tests for controls versus each group of COVID-19 samples and analysis of variance (ANOVA) or Kruskal–Wallis tests for global comparisons. Correspondence analysis used biplots where distance between points gives a measure of similarity/difference. The quality of the representation (squared cosine [cos2]) was examined to measure degree of association with variables and a particular axis. Confidence eclipses were added to include values >0.95. Pearson correlation coefficients were used to measure the linear dependence between two variables and a matrix generated representing experimental features that cluster above the level of 0.01 significance.
Study approval
This research was approved by the Johns Hopkins University School of Medicine Institutional Review Board and was performed in accordance with guidelines and regulations of the National Institutes of Health. Before blood collection all participants provided written informed consent.
Results
Demographics of hospitalized COVID-19 participants
PBMCs and plasma from 55 participants hospitalized with confirmed SARS-CoV-2 infection were studied (Table 1). The mean age was 57 years (standard deviation [SD] = 13) and 55% were female. Fifty-six percent of the participants were black (n = 31) and 14% were Hispanic (n = 8). Many participants had comorbidities such as hypertension (47%, n = 26), diabetes (38%, n = 21), obesity (32%, n = 18), or asthma (18%, n = 10) and 44% (n = 24) had more than one comorbidity. At study entry, the mean duration of symptoms was 19 days and median 15 days (range 3–66 days, SD = 14). The mean length of hospitalization was 16 days (range 2–96 days, SD = 19) and 61% (n = 35) received a treatment for COVID-19: hydroxychloroquine (n = 18), Remdesivir (n = 6), steroids (n = 9), Tocilizumab (n = 3, or convalescent plasma (n = 2).
Disease severity was classified as mild, moderate, or severe: 20% (n = 11) did not require supplemental oxygen (mild); 42% (n = 23) required supplemental oxygen (moderate); 39% (n = 21) required mechanical ventilation (severe) and five of these patients died. The cohort had more men with severe disease than women (13 vs. 9) and three of the five deaths were in men. Repeat samples were available on 18% (n = 10) of the participants at 3, 7, 28, or 90 days after the first sample collection. Control samples (n = 10) were collected between 2014 and 2018 from HIV and hepatitis virus uninfected participants in the Baltimore Before and After Acute Study of Hepatitis (20). These healthy donors were 25–37 years old (mean = 30 years), 50% male, 60% white and 40% black.
SARS-CoV-2 N- and S-specific IgM, IgA, and IgG
EIAs were established with lysates from cells producing native forms of S or N protein (33). Titers of IgM, IgA, and IgG binding antibody were determined in cross-sectional and longitudinal analyses of 89 plasma samples from SARS-CoV-2-infected patients with time after onset of symptoms ranging from 3 to 112 days, in comparison with 10 plasmas from healthy donors collected before 2019 (Fig. 1). In general, antiviral antibodies of all three isotypes were detected within 2 weeks of symptom onset and increased through days 22–28. Titers of IgM to both N and S then decreased (Fig. 1A, B). IgA titers showed changes over time similar to IgM with lower titers to both N and S by day 90 compared to day 22–28 (Fig. 1C, D).

Cross-sectional and longitudinal analyses of amounts of SARS-CoV-2 N- and S-specific binding antibody in plasma as measured by EIA. Data were binned into time categories based on reported date of symptom onset.
Titers of IgG remained high for longer than IgM or IgA (Fig. 1E) with most individuals maintaining levels 3 months after onset of symptoms similar to those present earlier (Fig. 1F). Because immunoglobulin function varies with isotype and may contribute to disease pathogenesis (5,50) we also measured N- and S-specific IgG3 and IgG1 (Fig. 1G–J). Overall, the amounts of IgM, IgG1, and IgG3 specific for S were greater than for N although this is not reflected in the data for total IgG perhaps due to contributions from other IgG isotypes (Fig. 2A). No differences were detected between the responses of men and women (Fig. 2B) while there were significant differences based on disease severity with lower levels of anti-N and anti-S IgG and IgA in those with mild disease (Fig. 2C).
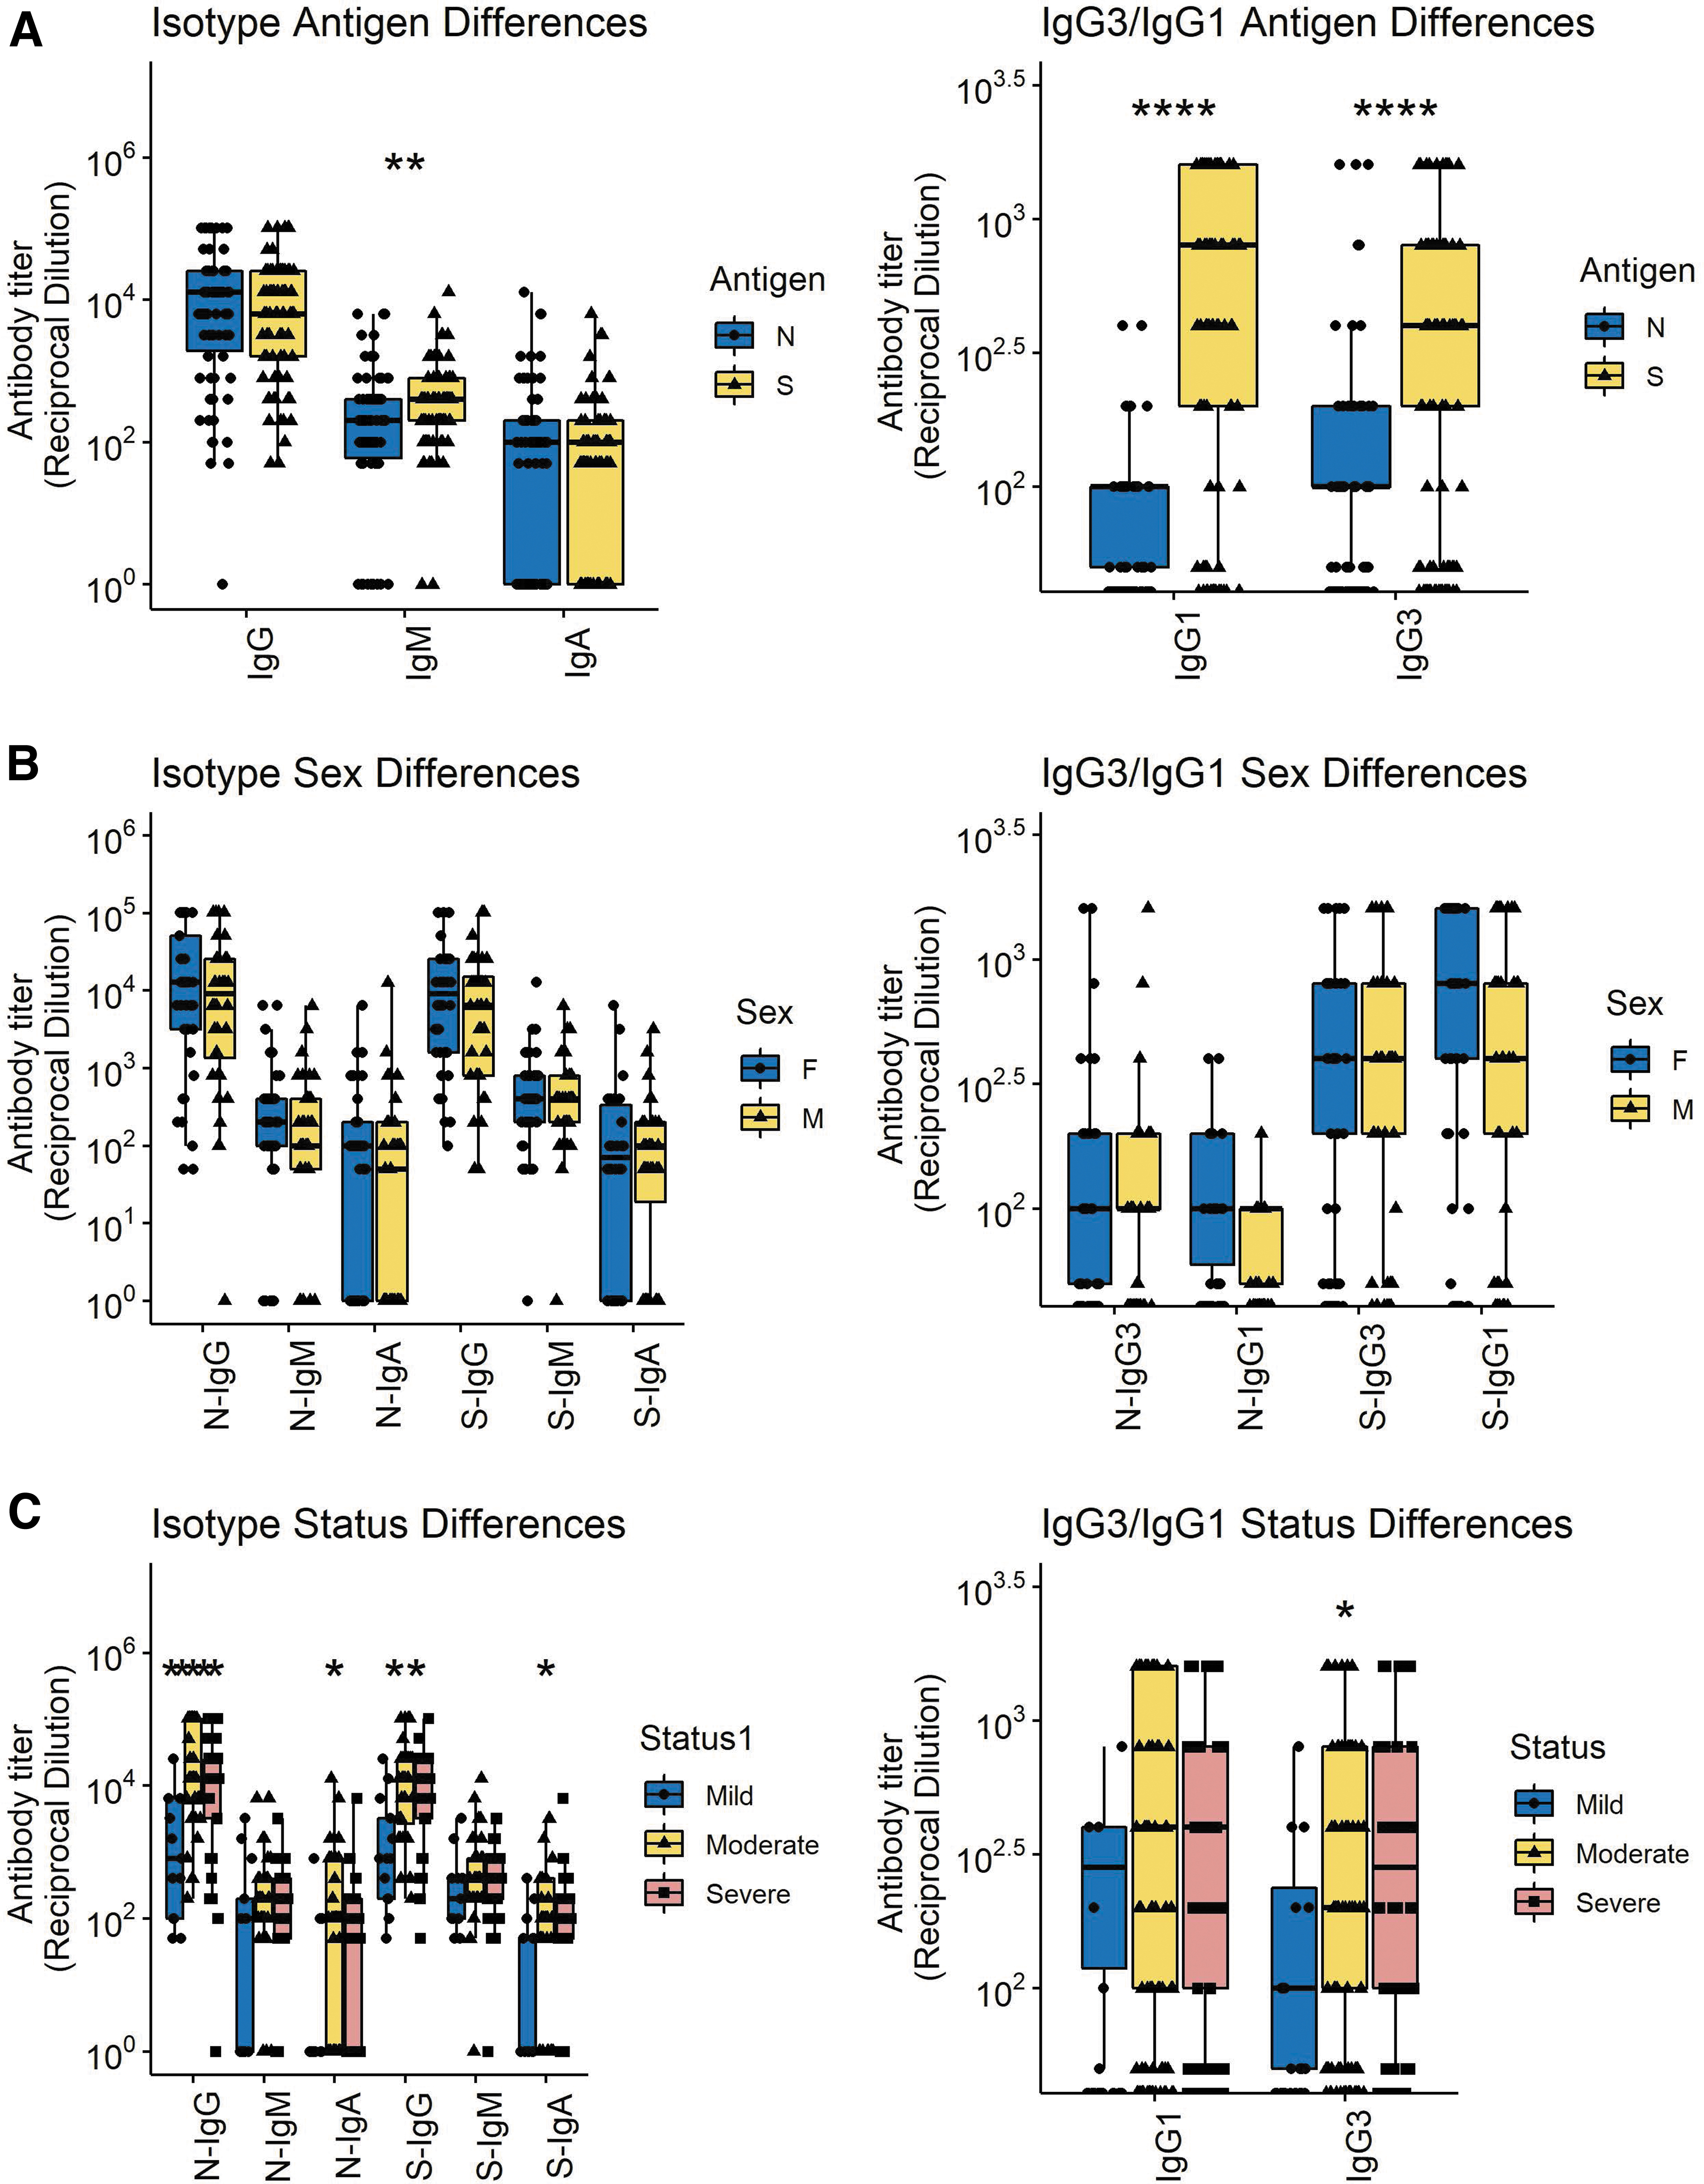
Comparisons of all N- and S-specific IgM, IgA, and IgG samples (left) and IgG1 and IgG3 samples (right) based on antigen specificity
Avidity of IgG for N and S
An important indication of B cell maturation and germinal center selection is improved affinity of antibody binding to antigen (9,40). To assess avidity the concentration of the chaotropic agent NH4SCN required to disrupt antibody binding by 50% was determined (Fig. 3).
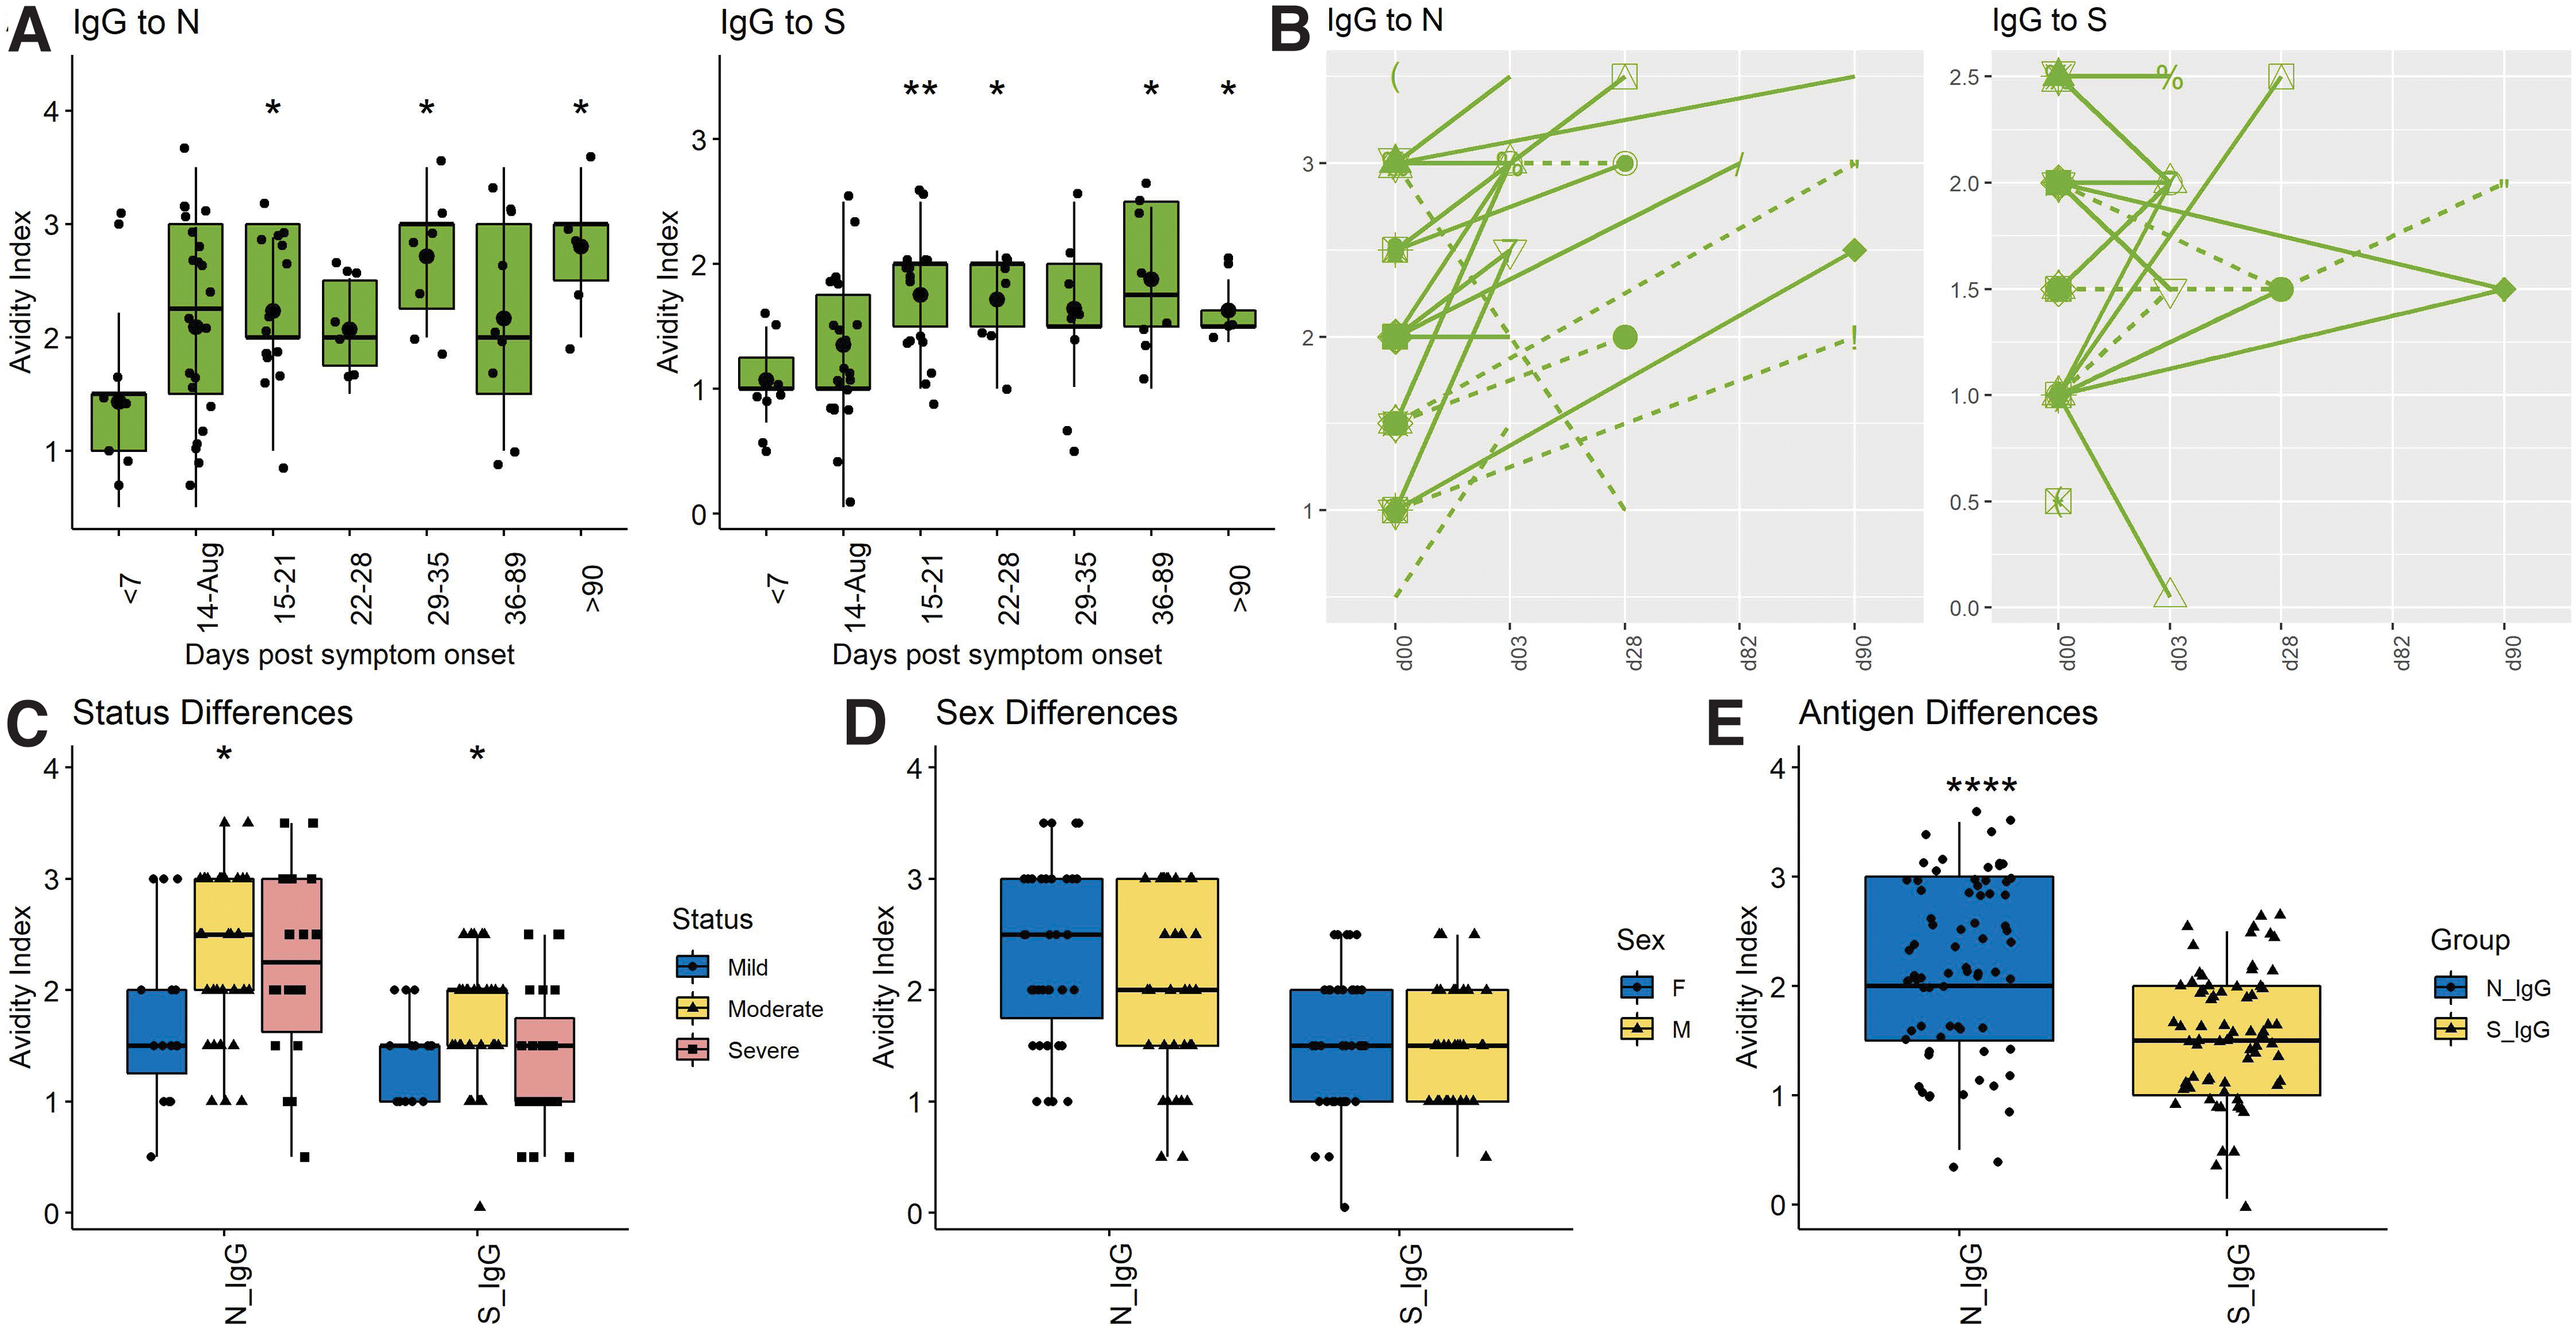
Cross-sectional and longitudinal analyses of avidity of SARS-CoV-2 N- and S-specific IgG.
Avidity of anti-S IgG rose 15–21 days after onset of symptoms with a mean of 1.81 (±0.44), and then plateaued or fell while avidity of anti-N IgG continued to increase with a mean of 2.15 (±0.7) at 15–20 days and 2.57 (±0.84) after 60 days (Fig. 3A). Nine of 10 patients with longitudinal samples showed increasing avidity of anti-N IgG, but this was less consistent for anti-S IgG with only five of 10 showing improvement (Fig. 3B). ODs were too low to accurately assess the independent contributions of IgG1 and IgG3 to IgG avidity. Overall, avidity indices were higher for antibody to N (2.12 ± 0.88) than to S (1.51 ± 0.62) (p < 0.0001) (Fig. 3E). No significant differences were detected between the responses of men and women (Fig. 3D) or between those with mild, moderate, and severe disease (Fig. 3C). Therefore, B cells producing antibody to N matured for longer and more completely than B cells producing antibody to S.
ASCs producing N- and S-specific IgM, IgA, and IgG
The secondary lymphoid tissue production of ASCs can be analyzed using ELISpot assays to quantify virus-specific ASCs entering the circulation (10,22,60,71). To determine the onset and duration of ASC production, total and virus-specific IgM, IgA, and IgG ASCs in circulation were quantified on 65 samples of PBMCs from 55 COVID-19 patients (Fig. 4). SARS-CoV-2-specific ASCs were detected in all subjects with increases in N- and S-specific IgM (Fig. 4A, B) and IgG (Fig. 4E, F) but variable IgA (Fig. 4C, D) ASCs for the first 3–4 weeks after onset of symptoms. N-specific IgM and IgG ASCs were present from day 3 after onset of symptoms (earliest sample), increased over time to peak at 2–4 weeks and then decreased gradually but were still detectable at the latest time point (day 112).
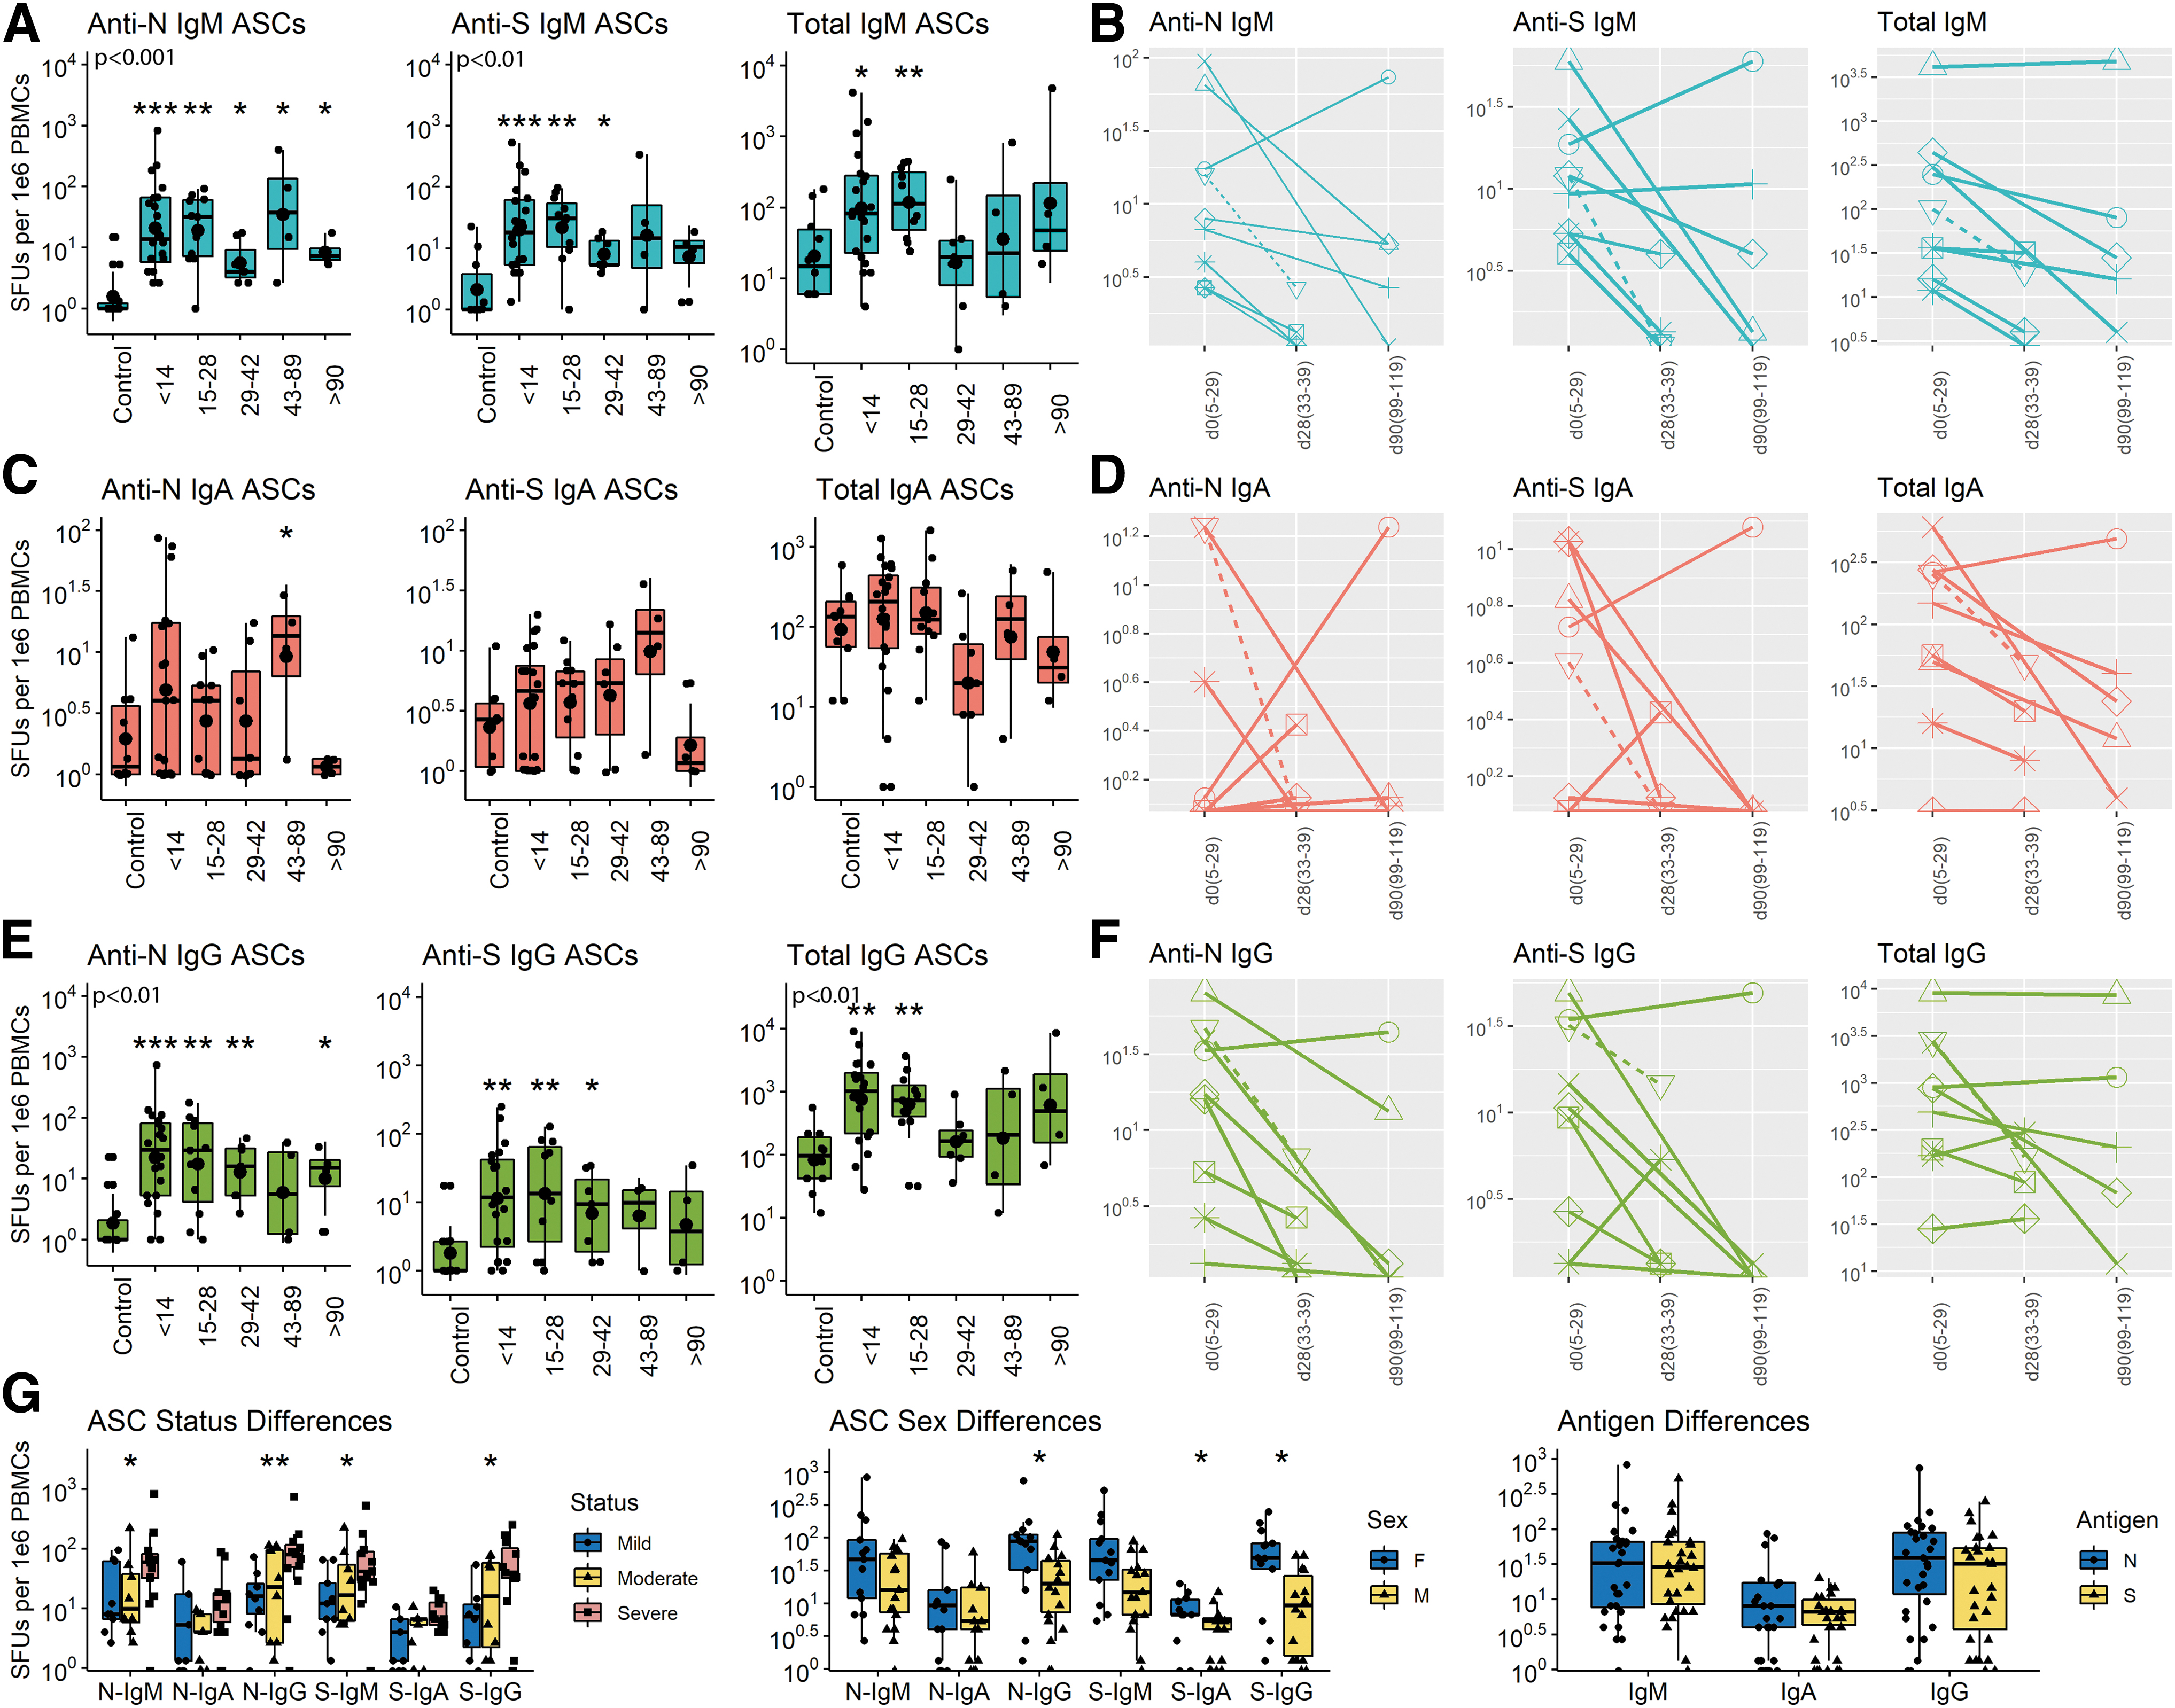
Cross-sectional and longitudinal ELISpot analyses of total and virus-specific IgM, IgA, and IgG ASCs in circulation. PBMCs were cultured on plates coated with lysates from cells expressing the N protein, the S protein or antibody to immunoglobulin, stained with antibody to IgM, IgA or IgG and spots counted. Data are expressed as SFUs/106 PBMCs. Samples are grouped based on time since symptom onset.
S-specific IgM and IgG ASCs were present from day 6, peaked at 2–4 weeks, and decreased more than N-specific ASCs but were still detectable at day 112. Total IgM and IgG ASCs in circulation increased 10–100-fold during the first 4 weeks after symptom onset and then declined to baseline levels. For most patients followed longitudinally, production of ASCs making IgG to both N and S decreased over time (9/10 for N and 8/10 for S). Women produced more S-specific IgA and both N- and S-specific IgG ASCs than men and patients with severe disease had more N- and S-specific IgM and IgG ASCs than patients with mild disease (Fig. 4G). Therefore, ASCs producing antibody to both S and N appeared in circulation early after onset of symptoms, were most numerous at 3–4 weeks and then declined but were still being produced (N > S) by most patients at 3–4 months.
Flow cytometry analysis of changes in B cell subsets in response to SARS-CoV-2 infection
To better characterize the infection-induced changes in circulating B cell populations that include ASCs as measured by ELISpots (12), PBMCs were analyzed by flow cytometry for total CD19+ B cells (CD3−CD14−CD16−CD19+), double negative (DN) extrafollicular PBs (IgD−CD27−), ASCs (CD38hiCD27hi), PBs (CD27+-CD38+CD138−), PCs (CD27+CD38hiCD138hi), unswitched memory (CD27+IgD+), switched memory (CD27+IgD−), and naïve B cells (IgD+CD27−) (Supplementary Fig. S1 and Fig. 5)(39,69,83). Although numbers of B cells were lower late (d43–89) than early (d < 14) after symptom onset, the percentages of lymphocytes that were B cells in patients were not significantly different than controls (Fig. 5A).

Flow cytometry analysis of B cell populations in circulation. Results are grouped by days since symptom onset and analyzed as the numbers (left) and percentages (middle) of B cells for each subset with percentages grouped by disease severity compared to control (right).
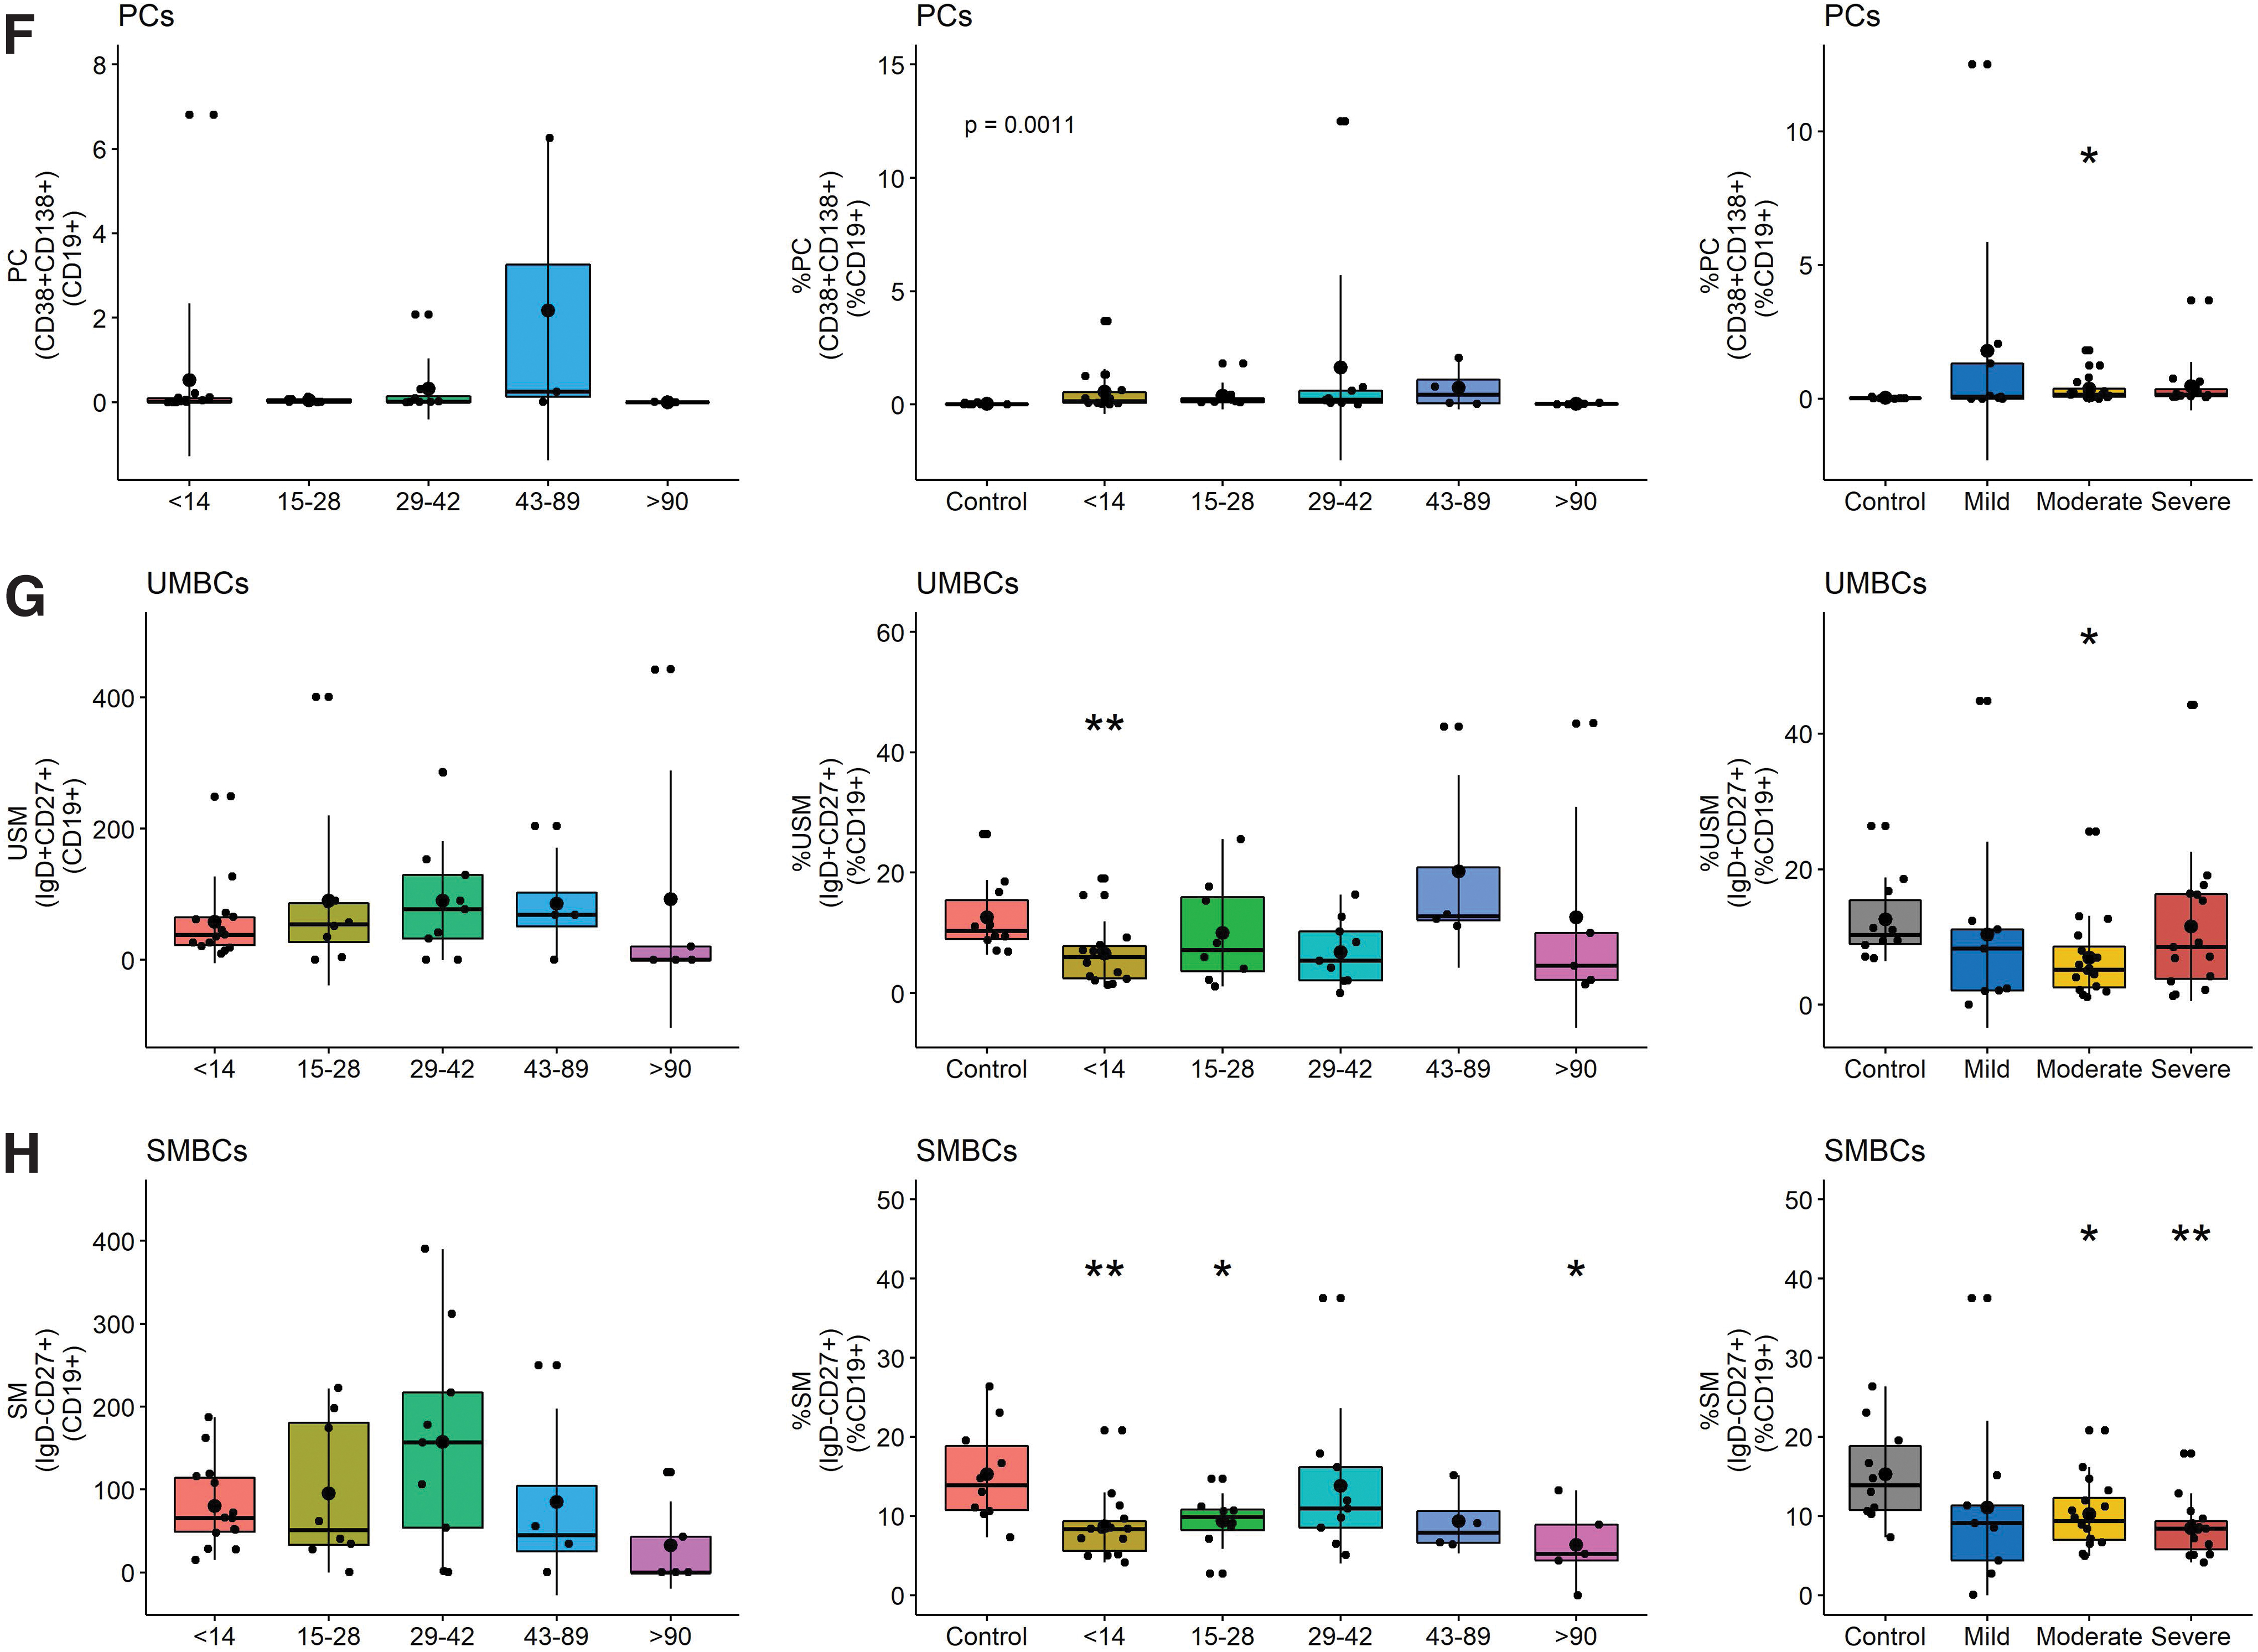
However, patients had a higher percentage of DN extrafollicular PBs early (day <14) than controls and fewer late (day >90) than early after symptom onset (Fig. 5C). This difference was observed in patients with all levels of disease severity. The proportions of B cells that were PBs increased compared to control, particularly in those with severe disease, and were the major contributors to the ASC population (Fig. 5D–F). In addition, the percentages of unswitched and switched memory B cells (SMBC) were lower in patients than controls with lower percentages of SMBC in patients with moderate and severe disease (Fig. 5G, H). Women had more total and naïve B cells than men, but other subsets were not significantly different (Fig. 6B).
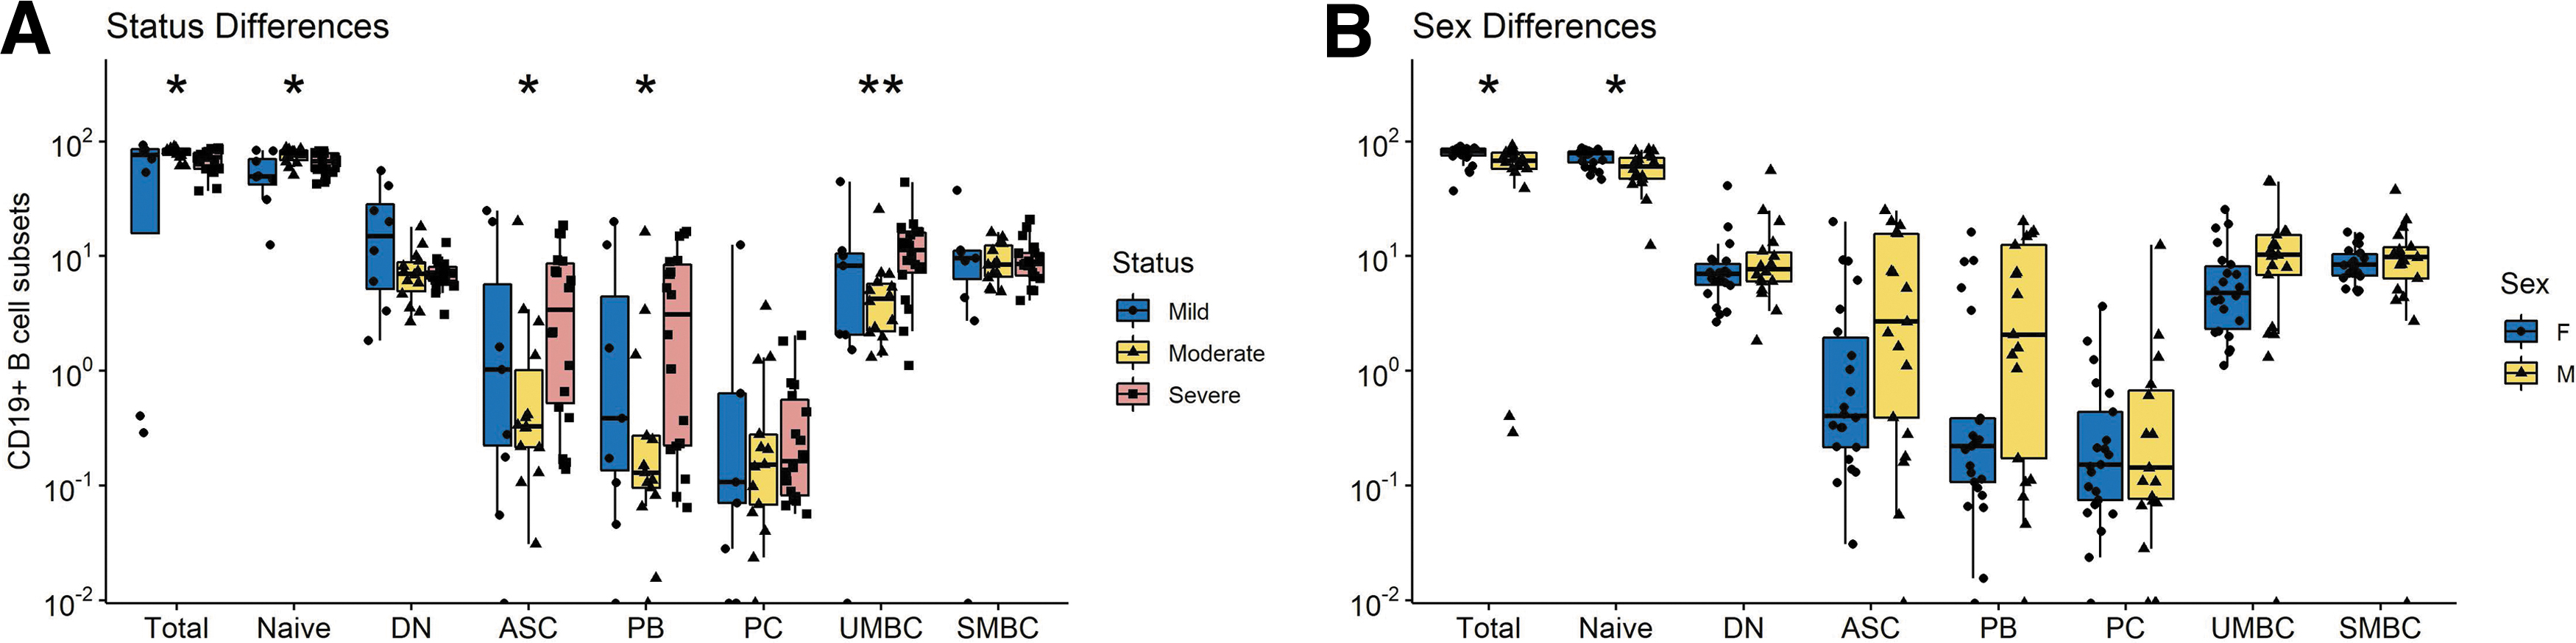
Differences in CD19+ B cell subset numbers based on
Multiple correspondence and correlation analyses
To combine these datasets and identify features that contribute to variance, we performed multiple correspondence analyses (MCAs) using the following metadata characteristics: sex, treatment, antigen, isotype, disease severity, and time of sample (Fig. 7A). Severe disease and sex contributed most to dimension 1 (38%) while dimension 2 was primarily weighted by severe disease (25.2%). Isotype, antigen, and treatment contributed minimally to variance in these data. All data were used to identify experimental results that were correlated (Fig. 7B). For all COVID-19 patients, the ASC responses for N and S were strongly correlated with plasma antibody titers to N and S and less strongly correlated with flow cytometry identification of B cell subsets.

MCA and correlation matrix.
Discussion
This study used cross-sectional and longitudinal samples from hospitalized COVID-19 patients focused on ASCs in circulation to examine factors associated with development of long-term humoral immunity. We found evidence of both extrafollicular and germinal center antiviral B cell responses. IgM and IgG ASCs and plasma antibody specific for the SARS-CoV-2 N and S proteins appeared within 2 weeks of symptom onset and flow cytometry evidence of increases in DN PBs consistent with a rapid extrafollicular response. Total and virus-specific IgM and IgG ASCs peaked at 3–4 weeks and were still being produced at 3–4 months with increasing avidity of plasma N- and S-specific antibody consistent with a germinal center B cell response. N-specific ASCs were produced for longer than S-specific ASCs and avidity maturation was greater for antibody to N than to S.
Patients with more severe disease produced more S-specific IgM and IgG ASCs than those with mild disease and had higher levels of both N- and S-specific antibody in plasma. Women had more B cells in circulation and produced more S-specific IgA and IgG and N-specific IgG ASCs than men. Therefore, infection with SARS-CoV-2 elicits an antibody response to both the S and N viral proteins that evolves over several months with ongoing production of ASCs and increasing IgG avidity particularly for antibody to N. These data are consistent with germinal center formation and continued stimulation of B cell maturation for development of a durable immune response.
ELISpot assays to detect ASCs in circulation provide real-time information on the secondary lymphoid tissue stimulation, development, and export of B cells producing antiviral antibody in response to infection or vaccination (25,60,92). Our studies document both early and prolonged production of virus-specific ASCs by patients hospitalized with COVID-19.
The prompt appearance of N- and S-specific cells producing IgM, IgA, and IgG antibody is consistent with previous reports of circulating N-specific IgM, IgA, and IgG ASCs in hospitalized patients 7–19 days after onset of symptoms (83). The rapid appearance of ASCs and simultaneous appearance of antiviral IgM and IgG in plasma (48,66) and increase in DN PBs are consistent with an early extrafollicular B cell response. Despite a lack of germinal center processing and somatic hypermutation for these ASCs, previous studies have shown that the rapid S-specific response includes cells producing potent virus neutralizing antibody likely to be important for early virus control (41,72).
Continued ASC production for 3–4 months, and IgG avidity maturation during recovery is consistent with development of a germinal center response that can lead to humoral memory in the form of long-lived PCs and memory B cells. The duration of ASC production after infection has received limited attention but may predict longevity of the antibody response.
Initial descriptions of ASCs in circulation after influenza vaccination found that they were only produced transiently (13,70,92). However, subsequent studies have described a range of times for ASC production. For instance, ASC production continues for more than 5 months after systemic measles virus infection that induces life-long immunity (60) but is sustained for only 1–3 weeks after immunization with nonreplicating T-dependent antigens (36,44) and for 2 months after infection with respiratory syncytial virus (43) where antibody production is short lived. The continued, but decreasing, production of ASCs in patients hospitalized with COVID-19 indicates ongoing stimulation of the virus-specific B cell response and is consistent with slowly decreasing plasma levels of N- and S-specific IgM and IgA antibody with a less marked decrease in IgG (7,38,45,49).
Previous reports have indicated that neutralizing antibody and antibody to the receptor-binding domain (RBD) of S decline more rapidly than antibody to N. Most antibody to S is directed to regions of the protein outside of the RBD (87) and our study examined binding antibody to the entire S protein.
We observed that ASCs to S were most abundant in patients with severe disease and declined more rapidly than ASCs to N. In addition, antibody to S showed less avidity maturation than antibody to N. Because avidity maturation is indicative of ongoing germinal center selection of ASCs, these data suggest that S-specific B cells were subjected to less germinal center processing than N-specific B cells and were exported as ASCs for a shorter time. The reasons for antigen specificity in avidity maturation may involve differences in availability of T cell help or antigen abundance (30,56,67). Although poor formation of germinal centers has been observed in fatal cases of COVID-19 (39), IgG avidity maturation is consistent with the formation of functioning germinal centers and the previously observed generation of memory B cells with mutated variable region genes (27,46,75).
Several studies have used flow cytometry to document phenotypic changes in circulating B cell populations in COVID-19 patients (14,18,24,76,91). As we observed, these changes vary with severity of disease, but include increased proportions of DN extrafollicular PBs early after onset of symptoms, increased proportions of PBs later and decreased proportions of memory B cells.
Patients with severe disease produced more flow cytometry-detected ASCs and ELISpot-detected IgM and IgG ASCs specific for both N and S than patients with mild disease with higher levels of N- and S-specific plasma IgA and IgG as reported in other studies (49,52,66,68,95). ASCs were mostly PBs and overall, there were positive correlations between anti-S IgM titer and ASCs (p = 0.0011), anti-S IgA titer and ASCs (p = 0.0017), and anti-N IgM titer and ASCs (p = 0.0045). Enhanced antibody responses in severe disease may be driven by higher or more prolonged replication of SARS-CoV-2 or by heightened reaction of the immune system to infection.
Another important determinant of outcome is biological sex, with men more likely to develop severe COVID-19 illness than women, although specific sex-determined factors affecting outcome are not yet clear (17,29,64,79).
In our cohort, women had more S-specific IgA and IgG ASCs and N-specific IgG ASCs than men consistent with a more robust humoral response although neither levels nor avidity of S- and N-specific plasma antibodies were detectably different in men and women.
In summary, in hospitalized patients with COVID the antibody response to infection indicates induction of virus-specific ASCs both through extrafollicular and germinal center responses that predict a more durable immune response in patients recovering from severe disease.
Footnotes
Acknowledgments
The specimens utilized for this publication were part of the Johns Hopkins University Biospecimen Repository, which is based on the contribution of many patients, research teams, and clinicians. We thank Christine Atik for assisting with retrieving participant laboratory data and Debra Hauer for laboratory assistance.
Authors' Contributions
M.L.B., S.S., N.P.A., and D.E.G. conceived and designed the project. A.L.C. provided samples. M.L.B., S.S., N.P.A., S.G., and A.K.P.C. performed experiments and interpreted data. S.J.G. and C.G. prepared and provided reagents. S.S., M.L.B., and D.E.G. wrote the article. All authors reviewed and edited the article.
Author Disclosure Statement
D.E.G. is on advisory boards for GlaxoSmithKline, Takeda Pharmaceuticals, and GreenLight Bioscience. The other authors declare no conflicts of interest.
Funding Information
This research work was funded by grants from the Johns Hopkins COVID-19 Research Response Program (D.E.G., S.G., and A.L.C.); a scholarship in commemoration of Her Royal Highness Princess Chulabhorn's 60th Birthday Anniversary, Chulabhorn Royal Academy (S.S.); Bauernschmidt Committee of the Eudowood Board at Johns Hopkins School of Medicine Award (N.P.A.); and T32-AI138953 (M.L.B.) and T32-AI052071 (N.P.A.) from the U.S. National Institutes of Health.
Supplementary Material
Supplementary Table S1
Supplementary Figure S1
Supplementary Figure S2
References
Supplementary Material
Please find the following supplemental material available below.
For Open Access articles published under a Creative Commons License, all supplemental material carries the same license as the article it is associated with.
For non-Open Access articles published, all supplemental material carries a non-exclusive license, and permission requests for re-use of supplemental material or any part of supplemental material shall be sent directly to the copyright owner as specified in the copyright notice associated with the article.