
Abstract
Emerging research shows that the Programmed Cell Death Protein 1/Programmed Cell Death Ligand 1(PD-1/PD-L1) pathway modulates the antiviral response following influenza A virus (IAV) infection, and there is a need to understand further the role of the PD-1/PD-L1 signaling pathway in IAV infection. BALB/c mice were infected with different types of IAV to establish models of varying degrees of infection (mild and severe). The mice were pretreated with or without a PD-1 antagonist to evaluate the role of the PD-1/PD-L1 pathway in IAV infection. The general activity, degree of weight change, viral titer, pathological damage, protein expression, transcriptome level, and cytokine expression were evaluated in the mice. IAV infection, especially severe infection, induced expression of PD-1 and PD-L1 in the lungs and spleen of the mice at 6 days postinfection. Moreover, the expression level was positively correlated with the degree of pathological damage in the lung. PD-1 antagonists can alleviate weight loss in severely infected mice, reduce the viral load and pathological damage, enhance immune response-related gene expression, and induce the most robust responses of interferon-gamma without inducing an obvious Th1/Th17 response. The PD-1/PD-L1 signaling pathway induced by severe IAV infection seriously impairs the host's antiviral response; thus, blocking this signaling pathway may promote IAV recovery.
Introduction
Influenza virus emerges virtually every year and sporadically infects the respiratory tract. There are three types of influenza viruses: influenza A, B, and C viruses, which are classified according to the antigenicity of the nucleoprotein and matrix protein. In particular, influenza A and B viruses are of epidemiological interest in humans (Palese, 2004; Stöhr, 2002). Severe influenza A virus (IAV) infections are common, especially in older patients. Such severe infections manifest in patients as rapidly progressing viral pneumonia, which can cause respiratory failure and multiple organ dysfunction within a short time. Factors contributing to increased severity include a decline in cell-mediated and humoral immune responses, reduced lung compliance and respiratory muscle strength, a diminished cough reflex, hypercytokinemia, and various extrapulmonary complications (Lee et al, 2010).
Therefore, a detailed understanding of the underlying mechanisms that determine pathogenicity is critical to controlling IAV infections. The antiviral response to IAV infection is mediated by lymphocytes, macrophages/monocytes, and neutrophils. The mucosal surfaces of the respiratory tract are the main points of entry for influenza and provide the first barrier to defense against infection (Brown et al, 2010; Heltzer et al, 2009). An adequate antiviral response between the host and pathogen initiates a signal transduction cascade, which induces the expression of cytokines to control pathogens, whereas lethal influenza infection is associated with the overexpression of cytokines and aggravates the degree of pathological damage (Chen et al, 2018). Cytokines are important immune mediators of antiviral response and are responsible for initiating, amplifying, and regulating inflammation (Betakova et al, 2017; Agrawal and Gupta, 2011).
The host's antiviral response induced by viral infection contributes to disease severity and the degree of pathological damage (McElhaney et al, 2020; Schönrich and Raftery, 2019). In particular, Programmed Cell Death Protein 1/Programmed Cell Death Ligand 1 (PD-1/PD-L1) is an inhibitory coreceptor expressed on activated T cells, B cells, natural killer (NK) cells, dendritic cells (DCs), and monocytes that delivers an inhibitory signal upon the binding and recognition of its ligands. The PD-1/PD-L1 costimulatory signaling pathway belongs to the B7/CD28 superfamily. PD-L1 is also expressed on various cell types, including T cells, NK cells, and DCs.
The PD-1/PD-L1 pathway is a potent contributor to the modulation of antiviral response following IAV infection, maintaining a balance between effectiveness and excessive inflammation due to microbial infections (Aghbash et al, 2021; Kauffman et al, 2021). In PD-L1-deficient mice, the severity of cellular infiltration and pulmonary inflammation is reduced following infection with a lethal dose of IAV. Under normal circumstances, PD-1/PD-L1 interactions are negative regulators of viral clearance. PD-1/PD-L1 blockade interferes with the generation and expansion of the systemic inflammatory response, which is a potential therapeutic target for regulation of the antiviral response following IAV infection (Li et al, 2020). Although PD-1/PD-L1 has been well characterized as a negative T cell regulator, the role in antiviral response after IAV infection has not been investigated in depth.
This study compared the level of viral replication, virus-induced cytokine expression, and activation of the gene transcription factors associated with severe IAV infection. The objective was to understand the early antiviral response responses following IAV to broaden our understanding of the molecular mechanisms associated with IAV infection, particularly severe infections.
Materials and Methods
Female BALB/c mice aged 5–6 weeks old were purchased from Joint Ventures SIPPER-BK Experimental Animal Co. (Shanghai, China). All animal studies were performed following the Guide for the Care and Use of Laboratory Animals of Zhejiang Province and were approved by the local Ethics Committee. The A/PR8(H1N1) virus was a gift from Wenjun Song, Jinan University. The Madin–Darby canine kidney (MDCK) cell line was obtained from ATCC (Rockville, MD, USA).
Virus and infection
Antibodies against PD-1 (clone RMP1–14; BioXCell) were administered through tail vein injection at a dose of 200 μg/200 μL on days 1, 4, and 6 before IAV infection. Anti-immunoglobulinG 2a (IgG2a) antibodies (clone 2A3; BioXCell) were used as an isotype control (Yu et al, 2016; Ng et al, 2015). Mice were chemically restrained with 2,2,2-tribromoethanol before intranasal challenge with IAV diluted in phosphate buffered saline (PBS). A TCID50 assay was performed according to the recommended protocol of the World Health Organization (Lei et al, 2021). The following groups (each group had 8 mice) were assessed: (1) Isotype control; (2) PD-1 antagonist group; (3) Seasonal A/HK/68(H3N2) infection (mild infection group, 50 μL × 106 TCID50 infection dosage); (4) PD-1 antagonist treated followed by seasonal A/HK/68 (H3N2) infection; (5) Mouse-adapted A/PR8/34 (H1N1)-infected (severe infection, 50 μL × 106 TCID50 infection dosage); and (6) PD-1 antagonist treated followed by infection with mouse-adapted A/PR8/34 (H1N1).
Mice were monitored for appetite and decreased physical activity, signs of illness, weight loss, and death for 10 days postinfection (dpi). All animals were bled through the tail vein on the day before virus inoculation and again 6 and 10 days after viral inoculation when half of the mice were sacrificed. The lungs and spleens were collected as the mice died.
Viral titers
Viral lung titers were determined using 10-fold serial dilutions of the tissue extracts and were tested for infectivity of MDCK cells in 96-well plates after a 48-h incubation. Viral titers were estimated based on the Reed and Muench method.
Hematoxylin–eosin and immunofluorescence staining
After tissue fixation and processing in paraffin wax, lung and spleen sections (4 μm thick) were prepared and stained with hematoxylin–eosin (H&E). The inflammatory pathology score of lung tissue was calculated according to the standard of Underwood (Underwood et al, 1995). Paraffin sections of the lungs and spleens were deparaffinized and subsequently subjected to Ag retrieval by heat treatment. Endogenous peroxidase activity was quenched with 0.3% H2O2 in methanol. Sections were blocked for 1 h with 3% bovine serum albumin in PBS and incubated sequentially overnight at 4°C with the following primary antibodies: 1:1,000 PD-1 (Clone EPR20665; Abcam), 1:4,000 PD-L1 (Clone 2B11D11; Proteintech), 1:300 H1A (Clone AB_2728683; GTX127357), or 1:300 H3A (Clone AB_2885648; GTX127363).
The samples were then subjected to incubation with a horseradish peroxidase-conjugated secondary antibody and tyramide signal amplification (TSA) using a TSA fluorescence kit (Haokebio, Hangzhou, China). The antibody incubation step was repeated three times before staining the nuclei with 4′,6-diamidino-2-phenylindole dihydrochloride (DAPI) (Buchwalow et al, 2018; Yarilin et al, 2015). The fluorescent images were assessed using a Nikon ECLIPSE C1 microscope at 200 × and 400 × magnification and fluorescent intensity was measured by IPP6.0 software.
Immunoassay-Luminex measurement of serum cytokines
Serum cytokines were measured using multiplex bead assays (MCYTMAG-70K-PX32, Millipore, USA) incorporated into MILLIPLEX MAP panels run on a Luminex 200 instrument. Samples were first diluted as recommended, and bead–antibody complexes were vortexed. A total of 25 μL of assay buffer was added to either 25 μL controls or samples, followed by the addition of 25 μL bead–antibody complexes. Plates were incubated at 4°C for 16 h with constant agitation. The plates were washed three times and subsequently incubated for 1 h with a 25 μL biotinylated detection antibody. Next, 25 μL of streptavidin-perosidase was added to the detection antibody for another 30 min. Finally, the plates were washed, and beads were suspended in 100 μL of sheath fluid. For analysis, the 96-well plate was placed in a BioPlex reader, and data were collected, analyzed, and subjected to quality control as previously described by Lovestone (Hye et al, 2014).
Construction and sequencing of the mRNA library
A total of 3 μg of RNA per sample was used as input material to construct sequencing libraries, which were generated using the rRNA-depleted RNA by the NEB Next® Ultra™ Directional RNA Library Prep Kit for Illumina®. The clustering of samples was performed on a cBot Cluster Generation System using the TruSeq PE Cluster Kit v3-cBot-HS (Illumina), the libraries were sequenced on an Illumina Hiseq 4000 platform and clean data were obtained, an index of the reference genome was built using bowtie2 v2.2.8 and paired-end clean reads were aligned to the reference genome using HISAT2 v2.0.4. The mapped reads of each sample were assembled using StringTie (v1.3.1). We used phyloFit to compute phylogenetic models, and then submitted the model and Hidden Markov Model transition parameters to phyloP to compute a set of conservation scores of coding genes.
mRNA analysis
Gene ontology (GO) enrichment analysis and Kyoto Encyclopedia of Genes and Genomes pathway were implemented by the clusterProfiler R package v4.0 and KOBAS v2.0 software to test the statistical enrichment of the differentially expressed mRNAs. The p values were adjusted using the Benjamini and Hochberg method with a p value of 0.05 as the threshold.
Statistical analyses
Statistical analyses of data regarding body weight, viral titers, and cytokine levels were performed using SPSS software (SPSS, Inc., USA) with a two-way analysis of variance (ANOVA) with a Tukey post hoc analysis. Values are represented as the mean ± standard error of the mean for the indicated sample sizes. A threshold of p < 0.05 was used to denote statistical significance.
Results
Evaluation of weight changes in the experimental groups
We observed lethargy, ruffled fur, and loss of appetite, but no death in any IAV-challenged mice, whereas the degree of weight loss varied among these six groups (Fig. 1). The growth curve of the mice treated with an anti-PD-1 antibody alone was similar to that of the IgG2a isotype control group. There was no statistical difference between the two groups, which suggested that the impact of anti-PD-1 antibodies on animal growth was negligible. In comparing mice treated with or without an anti-PD-1 antibody before the IAV challenge, anti-PD-1 antibody treatment alleviated the weight loss caused by severe infection at 6 dpi (p = 0.006). Most of the mice stopped losing weight by 10 dpi.

Weight changes of the mice throughout the entire experiment: PD-1 antagonist or IgG2a administration period (P1), 6 days after wild-type IAV challenge (P2), 10 days after wild-type IAV challenge (P3). The Y-axis presents the weight loss calculated as follows: ([weight after − weight before]/weight before) × 100. NS indicates no significant difference (p > 0.05). Asterisks denote the level of statistical significance: *p < 0.05. IAV, influenza A virus; IgG2a, immunoglobulinG 2a; PD-1, Programmed Cell Death Protein 1.
Evaluation of histopathological impairment of the lung caused by IAV infection
The extent and characteristics of the lung lesions varied among the groups at 6 days postvirus inoculation (Fig. 2A). Pulmonary vasodilation occurred in all the infection groups at 6 dpi, and microscopic lung lesions included diffuse alveolar hemorrhage, alveolar structure disappearance, and inflammatory cell infiltration surrounding the alveolar wall, the peribronchiolar, and perivascular areas in the severe A/PR8(H1N1) virus infection group. The anti-PD-1 antibody treatment significantly reduced the severity of necrosis and inflammation based on the gross and microscopic lesions. The lesions were mitigated in all groups at 10 dpi (Fig. 2B). The A/PR8(H1N1)-infected mice exhibited the most severe lesions at both 6 and 10 dpi (Fig. 2C). No inflammatory reactions or other histopathological changes were observed in the spleen (picture not shown).

The lung histopathology of mice after virus infection. The lung histopathology of mice treated with or without a PD-1 antagonist and subsequently intranasally inoculated with 106 TCID50 of A/H3N2 or A/PR8 at 6 dpi
Determination of the viral titer in the lung
Figure 3 shows an analysis of the viral titers in the lungs at 6 and 10 dpi. PD-1 blockade could significantly reduce the viral titers in the lungs, and severe influenza infection at 6 dpi was more likely to be affected (p = 0.00027). The viral load of the lung decreased at 10 dpi in both the mild and severe infection groups.
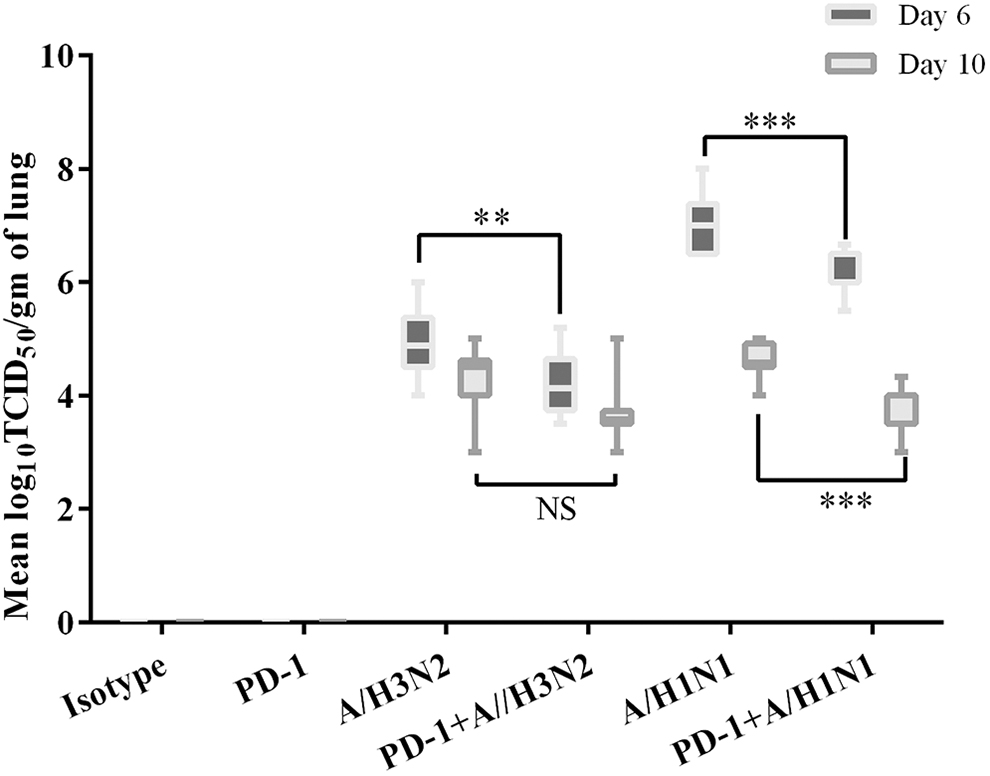
Viral titers of the lungs 6 and 10 dpi. Viral titers of the lungs 6 and 10 days after wild-type IAV challenge, respectively. Viral replication in the lungs of IAV-challenged BALB/c mice was determined using the TCID50 method in MDCK cells. Viral titers were expressed as the mean ± SE of the log10 TCID50 per gram of tissue. NS indicates no significant difference (p > 0.05). Asterisks denote the level of statistical significance: **p < 0.005; ***p < 0.0005. MDCK, Madin–Darby canine kidney; SE, standard deviation; TCID50, Median Tissue Culture Infective Dose.
PD-1/PD-L1 and virus antigen expression pattern in the lung and spleen
PD-1 and PD-L1 are moderately expressed in the lung, with slightly higher levels found in the spleen. Compared with the isotype control and seasonal A/H3N2 infection groups, severe A/PR8 infection could induce significantly increased staining of PD-1 and PD-L1 in both the lung (Fig. 4A) and spleen (Fig. 4B) by multicolor immunohistochemistry. However, the upregulated expression of PD-1 and PD-L1 in the lung and spleen of the mildly or moderately infected mice was not obvious (data not shown). PD-L1 was upregulated to a greater extent compared with PD-1 in the lung and spleen at 6 dpi. The upregulated expression of PD-1 and PD-L1 does not completely correspond to the site of influenza antigen detection, and the level of expression was positively correlated with the degree of inflammatory infiltration of the lung and degree of tissue damage.
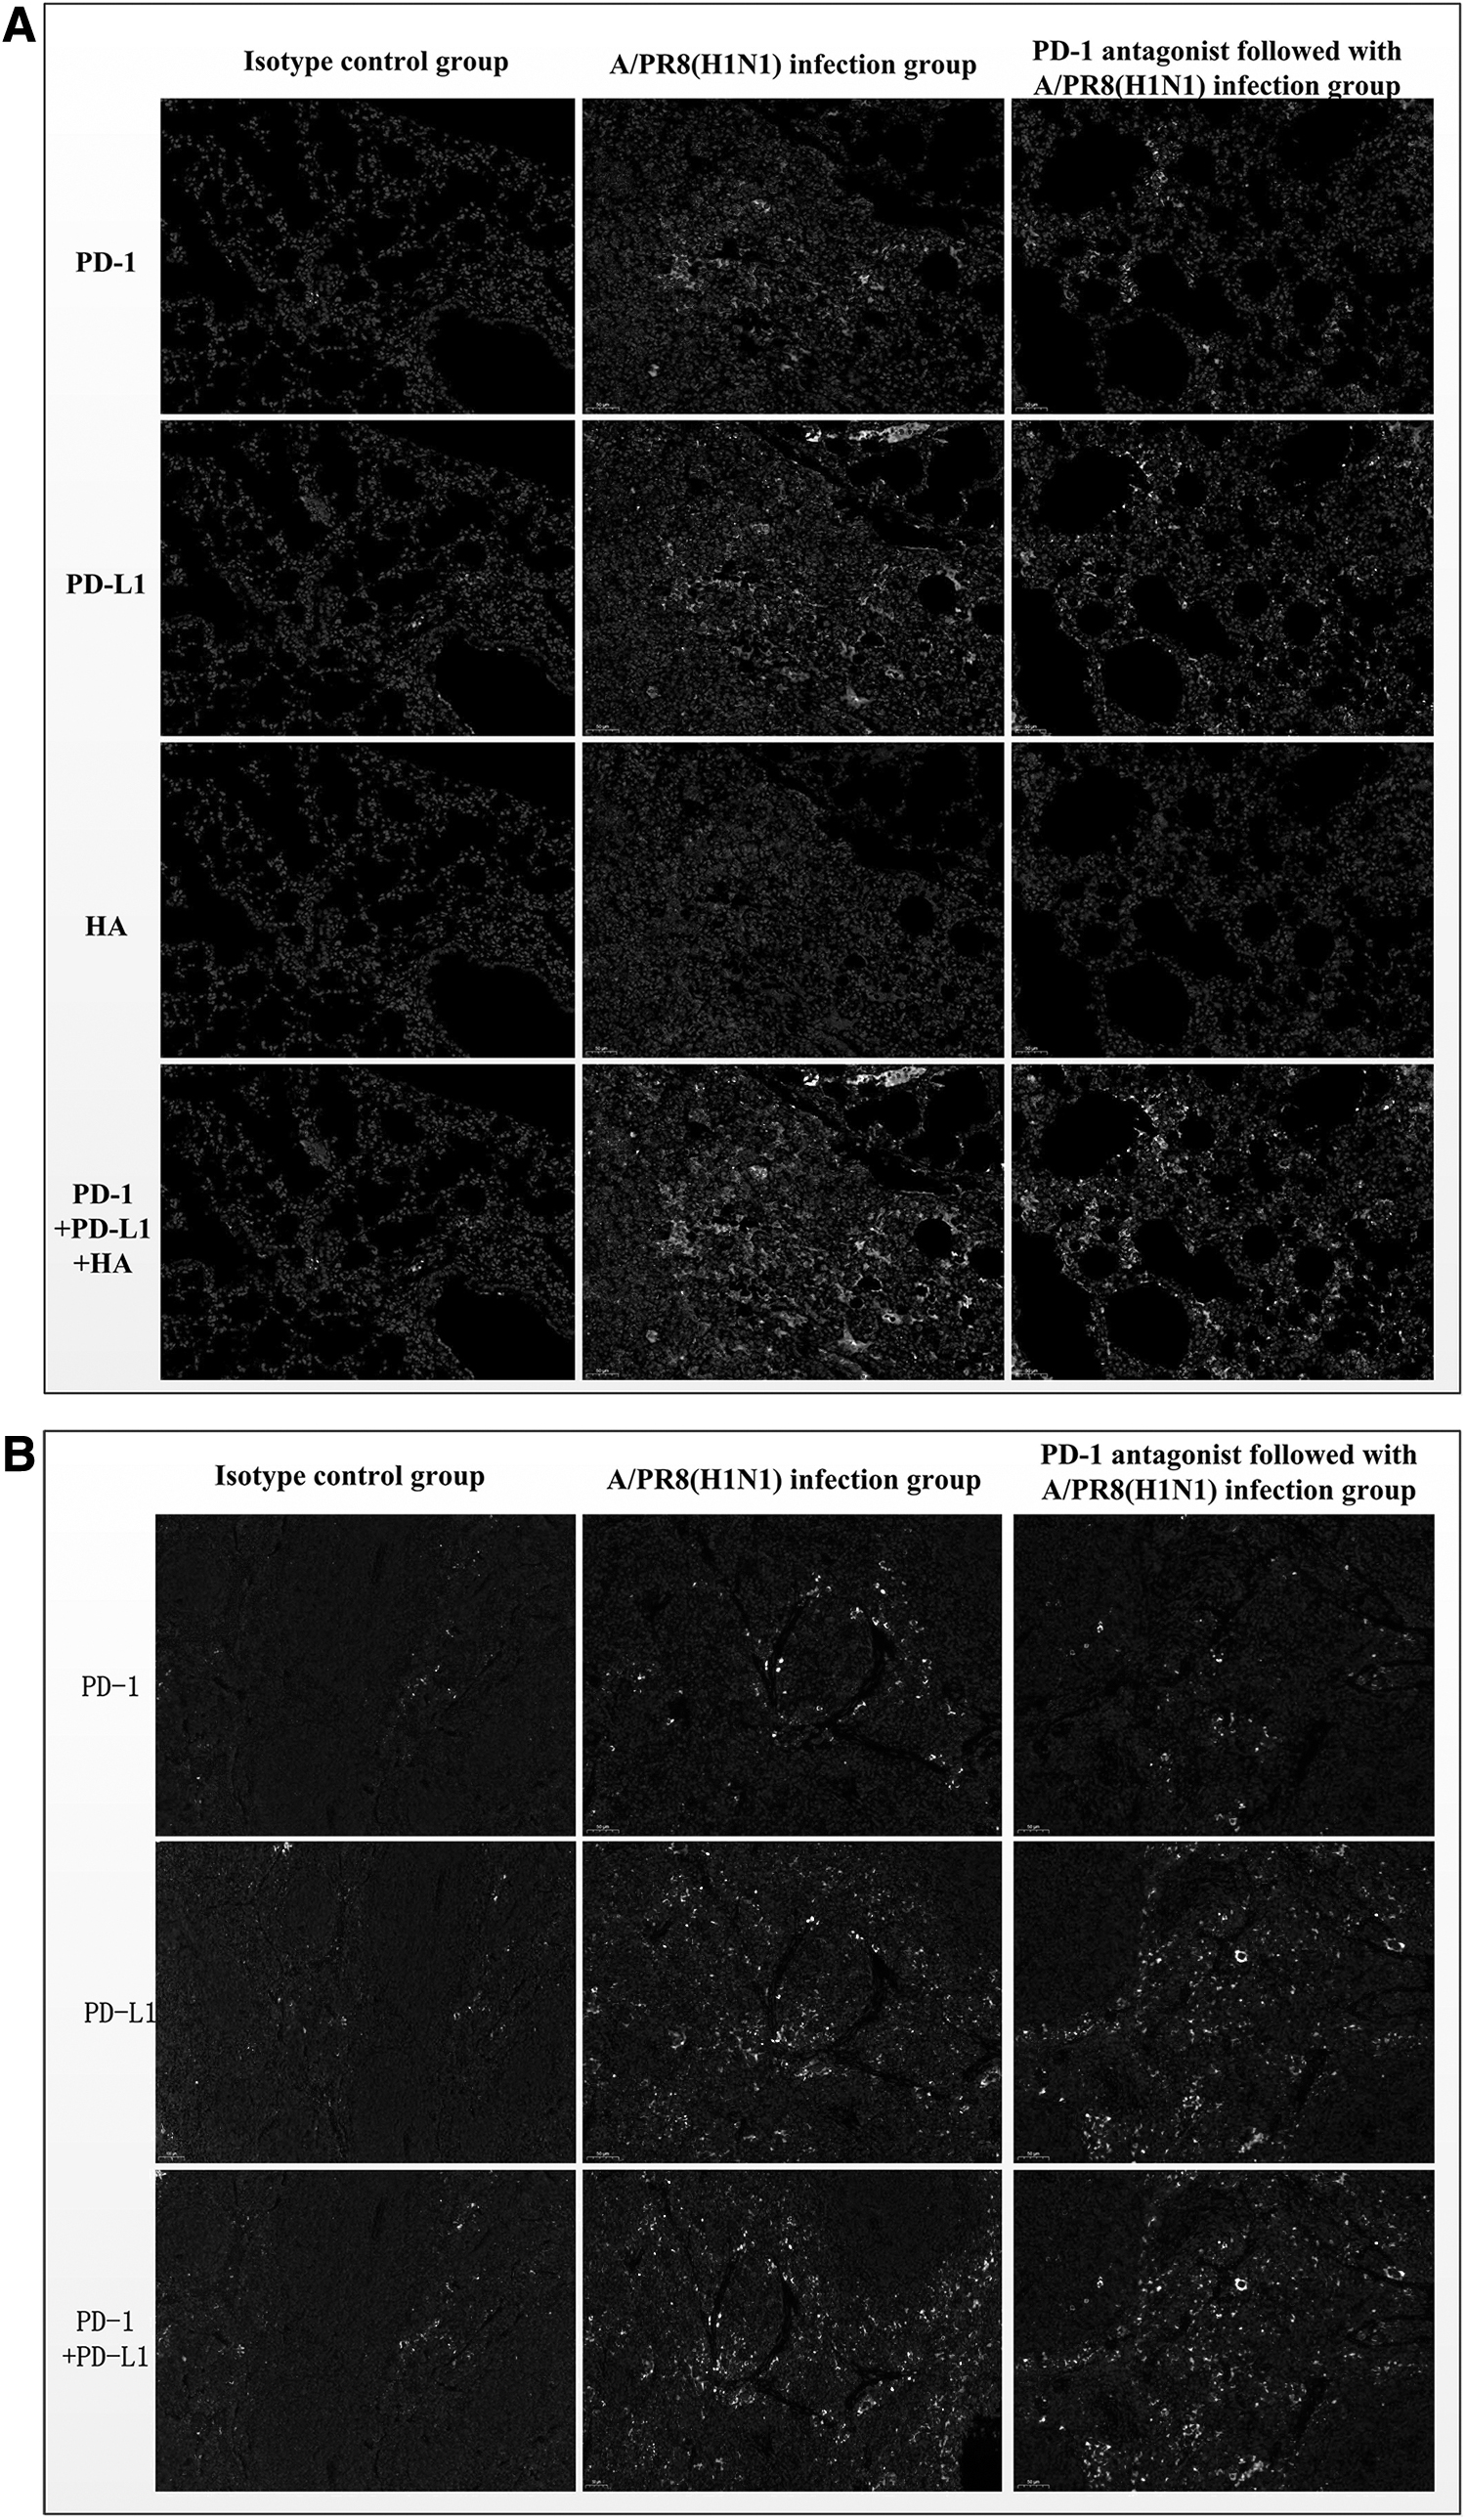
Immunohistochemistry of PD-1, PD-L1, and influenza HA in the lung and spleen of mice 6 dpi. Lung
Severe A/PR8 virus-infected mice exhibited necrotic and neutrophilic inflammatory lesions focused in the alveoli, and there was greater virus antigen detection within the alveoli than A/H3N2 viruses. While applying a PD-1 antagonist did not affect the upregulation of PD-1 and PD-L1 expression in the lung and spleen induced by severe infection, it could reduce viral antigen expression in the lung and alleviate pathological damage.
Systemic levels of serum cytokines in each experimental group
To investigate the underlying mechanism through which PD-1 inhibition prevents severe influenza infection, we studied the secretion of cytokines and chemokines by measuring their accumulation in the serum at 6 dpi using a Luminex array. Influenza (whether mild or severe) infection increased the secretion of numerous analytes (Table 1). Eotaxin, interferon-gamma (IFN-γ), interleukin (IL)-6, and IL-10 were more obvious in mice with severe influenza infections. Treatment with anti-PD-1 alone increased in low, but detectable, levels of most of the tested analytes in the serum, including Granulocyte Colony Stimulating Factor (G-CSF), IFN-γ, IL-5, IL-7, Macrophage Inflammatory Protein 1α (MIP-1α), and Human Chemokine (C-C Motif) Ligand (RANTES) (p = 0.049, 0.033, 0.003, 0.020, 0.037, and 0.028, respectively) were further significantly increased following severe infection with concurrent PD-1 inhibition. IFN-γ and IL-2 are primarily produced by Th1 cells, whereas cytokines IL-4, IL-5, IL-6, IL-10, and IL-13 are mainly produced by Th2 cells. The levels of IFN-γ and IL-2 were inconsistently detected in the serum.
Serum Cytokine Expression of Mice 6 dpi
Systemic expression of Th1 (IFN-γ and IL-12), Th2 (IL-4, IL-5, IL-6, IL-10, and IL-13), Th-17 (IL-17), and other cytokines in the experimental groups at 6 dpi, as measured using a multiplex Luminex LiquiChip; Comparing A/PR8(H1N1) group with PD-1 antagonist-treated A/PR8(H1N1) group, * p < 0.05 and ** p < 0.005.
G-CSF, granulocyte colony stimulating factor; GM-CSF, granulocyte macrophage colony stimulating factor; IL, interleukin; IFN-γ, interferon-gamma; MCP-1, monocyte chemoattractant protein-1; MIG, recombinant human monokine induced by interferon-γ; MIP, macrophage inflammatory protein; PD-1, programmed cell death protein 1; PD-L1, programmed cell death ligand 1; RANTES, human chemokine (C-C Motif) ligand; TNF-α, tumor necrosis factor.
Influenza inoculation resulted in the increased secretion of IFN-γ and IL-2, and the addition of a PD-1 antagonist resulted in a remarkable upregulation of IFN-γ levels after viral challenge (A/H3N2: p = 0.032 and A/PR8: p = 0.033), while only a slight increase in the IL-2 response was observed with no significant difference after virus inoculation (A/H3N2: p = 0.726 and A/PR8: p = 0.801). Treatment with a PD-1 antagonist before infection induced IL-4, IL-5, IL-6, and IL-13 secretion compared with the group infected with A/PR8 alone, and only the level of IL-5 was significantly different (p = 0.003). IL-17 is mainly produced by Th17 cells. Detectable levels of IL-17 were induced in the serum following an injection with the isotype control or PD-1 antagonist. The group of mice that received the PD-1 antagonist exhibited the highest levels of IL-17 following A/PR8 inoculation.
mRNA data analysis
mRNA expression profiling was performed on the lungs of A/PR8-infected mice treated with or without a PD-1 antagonist to establish a foundation for revealing the potential mechanism by which the PD-1 antagonist can prevent severe influenza infection. A total of 363 significant differentially expressed mRNAs of lungs were identified (Fig. 5). Among these, 219 (60%) were overexpressed in the PD-1 antagonist-treated group, whereas 144 (40%) were underexpressed.
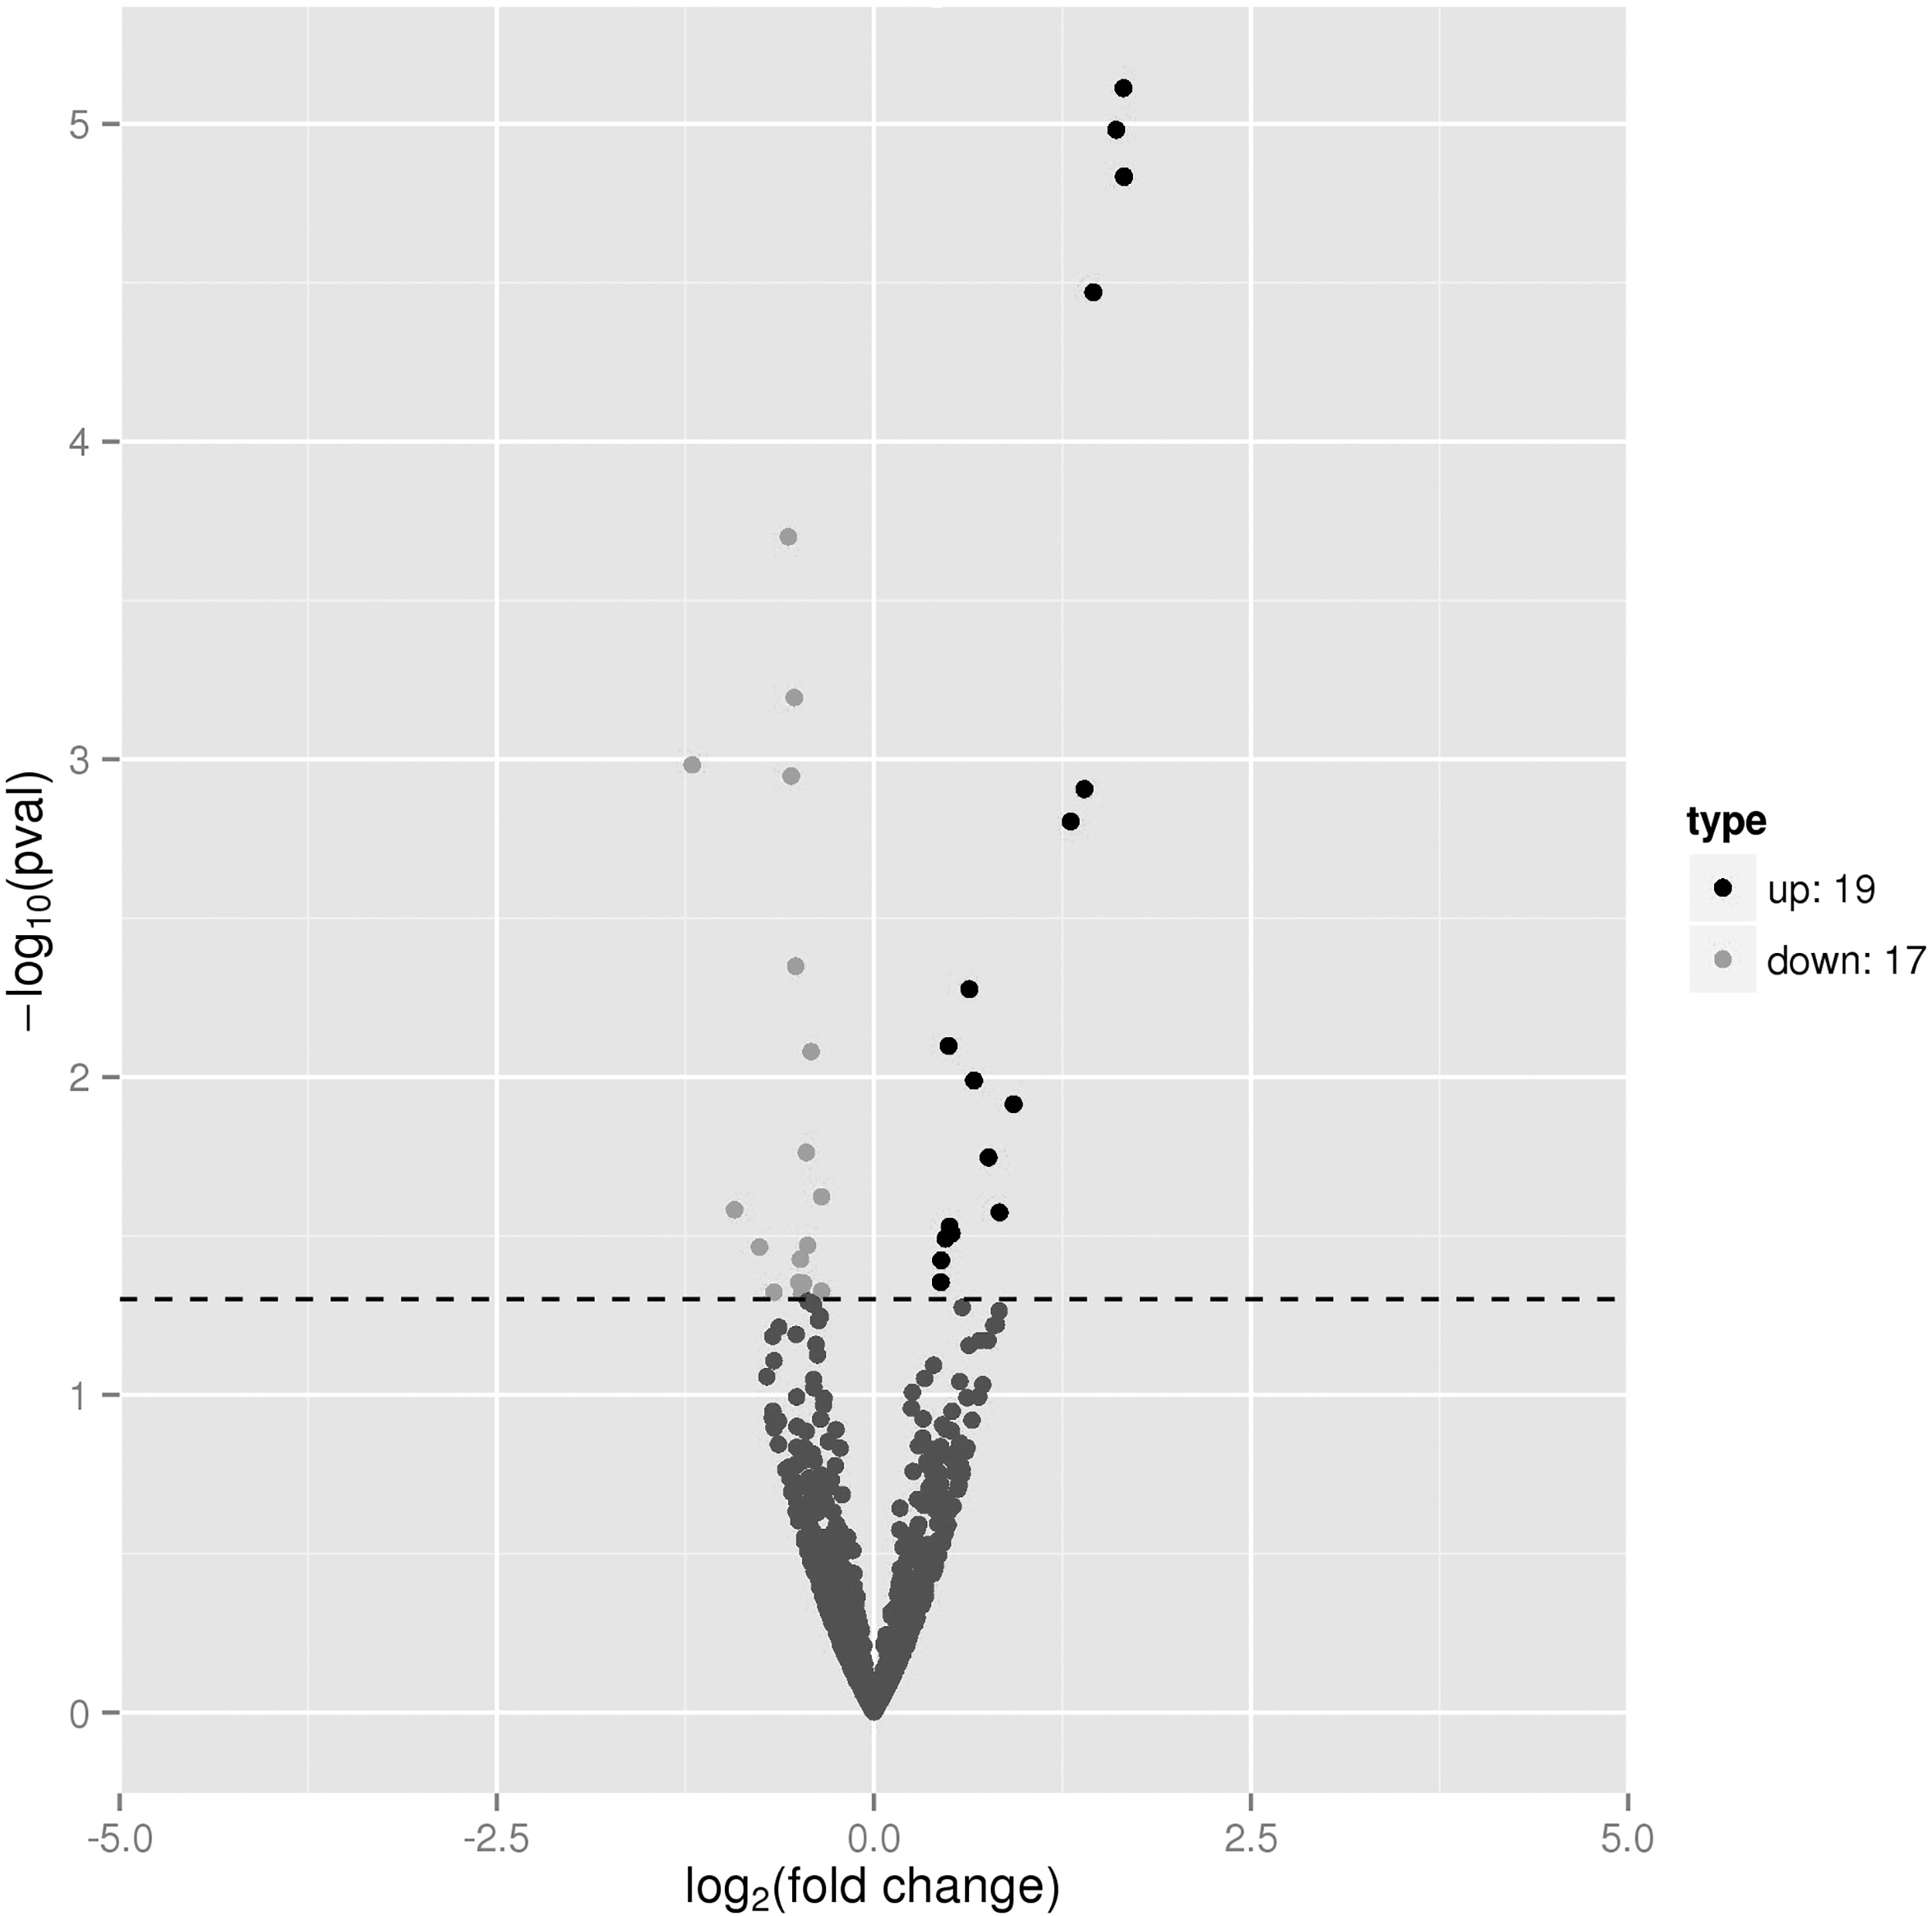
Volcano plot of differentially expressed mRNAs of lungs 6 dpi. Volcano plot of differentially expressed mRNAs between the PD-1 antagonist-treated A/PR8-infected group versus A/PR8-infected group. The horizontal line represents a p value of 0.05. The plot's up and down points represent the differentially expressed mRNAs that met the threshold for statistical significance.
Eighty-five statistically significant differentially expressed target genes of the mRNAs were identified. Among these, significantly upregulated genes including CAMP, Ltf, Il22, RF1, IFIT1, TLR3, Ifngr1, and Cx3cl after PD-1 blockage (Table 2) were closely associated with the following GO terms: positive regulation of inflammatory response, innate immune response, cytokine-mediated signaling pathway, cellular response to IL-1, regulation of tyrosine phosphorylation of STAT protein (including tyrosine phosphorylation of STAT protein) with enrichments of 8.27-, 14.44-, 12.7-, 4.52-, and 34.9-fold, respectively, and the corresponding false discovery rates of 2.08E-09, 3.50E-08, 1.15E-06, 1.17E-08, and 3.88E-05, respectively. JAK-STAT signaling pathway, mitogen-associated protein kinase (MAPK) signaling pathways, and innate immune response were the most enriched pathways based on the differentially expressed mRNAs.
Differentially Expressed Target Genes of the mRNAs Directly Related with Antiviral Immunity in A/PR8-Infected Mice Treated With or Without Programmed Cell Death Protein 1 Antagonist
Discussion
The lungs represent the primary portal of entry for influenza virus infection and the invasion, as well as the main site of tissue pathogenesis (Herold et al, 2015; Mauad et al, 2010). PD-1 is involved in the pathological injury mediated by T cells in acute respiratory virus infection. Viruses such as human metapneumovirus and the respiratory syncytial virus can progressively impair CD8+ T cell function and degranulation in the lung by upregulating the expression of PD-1 and PD-L1 (Erickson et al, 2012). Moreover, such expression is positively correlated with impaired CD8+ T cell function, including cytotoxic dysfunction in the lung and disease severity. An antibody blockade or gene knockout of PD-1 or PD-L1 can restore the CD8+ T cell function with increased stained degranulation markers CD107a/b and reduce the degree of pathological damage and viral load (David et al, 2019; Rutigliano et al, 2014).
NK cells perform a variety of antiviral functions by direct killing of target cells, PD-1 and PD-L1 upexpressed on T cell and NK cells after serious influenza infection, which directly affect the immune response of IFN-γ production. In this article, we confirmed that treatment with an anti-PD-1 antibody before severe IAV infection could significantly increase cytokine secretion, reduce symptoms in mice, alleviate pathological damage in the lung, and lower the viral load.
PR8 is a mouse-adapted A/H1N1 influenza virus known to cause severe infection in mice (Blazejewska et al, 2011; Fukushi et al, 2011). In contrast, the A/H3N2 influenza virus causes mild-to-moderate illness in mice (Pizzorno et al, 2014). Mice infected with PR8 exhibit severe illness that manifests as weight loss, daily performance, and pathological damage of the lung. In contrast, the A/H3N2-infected mice displayed an extremely mild illness profile. No mice succumbed to infection by 10 dpi in our study. Acute inflammation and the viral titers in the lung tissue were reduced in the infected mice at 10 dpi.
Consistent with previous reports, low PD-1 and PD-L1 expression was detected in the naive BALB/c mice, whereas expression was more intense in the spleen (Liang et al, 2003). PD-L1 expression was primarily located in the marginal zone surrounding the white pulp. We also observed that A/PR8 infection significantly increased the level of PD-1 and PD-L1 staining in the lung and spleen, particularly PD-L1 on day 6 dpi. Unfortunately, PD-1 and PD-L1 expression in other tissues, including the heart, kidneys, and other lymphatic immune tissues, was not detected to prove our hypothesis further. Together, our results indicate that PD-1 antagonists do not affect the upregulated PD-1 and PD-L1 expression induced by severe influenza infection.
In addition, the anti-PD-1 treatment led to a significant reduction in weight loss, viral titer, and pathological damage in mice at day 6 dpi, and finally, to better control severe infection. However, these antagonists did not affect the production of anti-influenza antibodies including hemagglutination-inhibiting antibodies, microneutralizing antibodies, and IgG antibodies (data not shown).
Cytokines play a critical role in mediating the immune response. An antibody blockade of PD-1 increases and stimulates virus-specific cytokine production. Preclinical data have revealed that targeting PD-1 and its ligands can improve T cell responses and viral clearance. Notably, increased cytokine levels were detected in the serum during severe IAV infection at 6 dpi. In addition, concurrent PD-1 inhibition significantly induced the most robust and consistent production of G-CSF, IFN-γ, IL-5, IL-7, MIP-1α, and RANTES. PD-L1 can be induced by Th1 cytokines, which creates a negative feedback response that inhibits Th1 activation. PD-1 blockade was previously reported to shift antigen-induced cellular reactivity toward one associated with a Th1/Th17 response (Parry et al, 2021, Dulos et al, 2012), which is inconsistent with our present results.
The enhanced production of IFN-γ, tumor necrosis factor-α (TNF-α) , IL-17, and the Th2 cytokines IL-4, IL-5, IL-6, and IL-13, was associated with PD-1 antagonist treatment. Moreover, IFN-γ, TNF-α, and IL-17 were identified as inducers of sPD-1 in vitro, which functionally blocked the inhibitory effect of membrane-bound PD-1 on T cell activation (Liu et al, 2015). Notably, PD-1 blockade has been shown to robustly elevate IFN-γ expression in severe influenza infection, which is critical for mediating immunity to influenza, viral clearance, and the development of adaptive immune responses (He et al, 2004; Bot et al, 1998). PD-1 and PD-L1 upexpressed on T cell and NK cells after serious influenza infection, which directly affect the immune response of IFN-γ production (Frank and Paust, 2020).
Our study confirmed that the upregulated expression of PD-1 and PD-L1 did not only occur in the lungs but also in the spleen after severe influenza infection, and serum IFN-γ secretion by the PD-1 antagonist injected intravenously may be derived from the increased function of T cell and NK cells from the lung, spleen, and other tissues. mRNA expression profiling of lungs of severe A/PR8-infected mice treated with or without a PD-1 antagonist also identified PD-1 pathways that may play an important role in severe IAV infection; after PD-1 blockade, levels of target genes (CAMP, Ltf, Il22, RF1, IFIT1, TLR3, Ifngr1, and Cx3cl) of the differentially expressed mRNAs that enhance immune response and cytokine expression were upregulated. PD-1 upregulation induced by A/PR8 infection may also interfere with the biological behavior of phosphorylation of STAT regulation,which is consistent with previous reports and closely related to the production of IFN-γ after infection (Sadoon et al, 2020; Ma et al, 2011). JAK-STAT signaling pathway, MAPK signaling pathways, and innate immune response were the most enriched pathways based on the differentially expressed mRNAs, which further confirmed that the PD-1/PD-L1 pathway modulates the innate immune response following severe IAV infection, there is evidence that MAPK activation is an important initiating event in the upregulation of PD-1 in infection, and inhibition of this signaling pathway can reduce infection.
IL-22 is one member of the IL-10 cytokine family that plays an important role to maintain barrier integrity and cell function of mucosal epithelium and protect from influenza infections in the lung.
IL-22-producing lung immune cells also secrete other antiviral cytokines including IFN-γ and display cytolytic potential. IL-22 knockout mice displayed more serious pathological lung damage compared with wild-type mice after influenza infection (Abood et al, 2019; Guo and Topham, 2010).
Conclusion
A BALB/c mouse model of severe IAV infection was constructed, revealing that the PD-1/PD-L1 signaling pathway was significantly boosted in the lung and spleen. Such increased PD-1/PD-L1 expression impaired the antiviral response, causing increased lung tissue inflammation and damages. Upregulated PD-1/PD-L1 expression induced by severe IAV infection represents an important component of an immunosuppressive microenvironment. Thus, blocking this signaling pathway will reduce the tissue damages, lower the viral titers in the lung, alleviate symptoms of infection, and enhance immune response and cytokine expression-related gene expression to promote recovery. PD-1 antagonists significantly induced the most robust IFN-γ responses. Further studies are required to verify these differentially expressed genes using larger tissue samples and to evaluate the gene regulation networks predicted by bioinformatic analysis. Functional verification of gene–gene interactions can also be carried out at both the cellular and animal levels.
Footnotes
Acknowledgment
The authors would like to thank Elixigen for the assistance with English language editing.
Authors' Contributions
H.O. performed the experiments, analyzed the data, and wrote the first draft of the article. F.C. reviewed the data and revised the article. H.W. designed the experiments and reviewed the data. All authors read and approved the final version of the article.
Availability of Data and Materials
The data sets used or analyzed during the current study are available from the corresponding author on reasonable request.
Author Disclosure Statement
No competing financial interests exist.
Funding Information
This work was supported by the Natural Science Foundation of Zhejiang Province, China (Grant No. LQ20H190001).