
Abstract
Pegylated interferon alfa-2b (Peg-IFN α-2b), a first-line treatment for hepatitis B virus (HBV) infection, can significantly achieve HBsAg clearance in clinic. However, only 30–40% of patients had achieved HBsAg clearance after Peg-IFN α-2b administration. The biological targets and the underline mechanisms that distinguish sensitive and insensitive populations to interferon therapy are still unclear. In the present study, only 33.33% of patients achieved HBsAg loss after 48 weeks of Peg-IFN α-2b therapy. Thirty-six exosomal-microRNAs (miRNAs) in the sensitive group were identified that might induce sensitivity specifically, whereas 32 exosomal-miRNAs in the insensitive group were identified that might induce insensitive specifically. Among these miRNAs, five miRNAs (miR-425-5p, miR-8485, miR-619-5p, miR-181a-5p, and miR-484) might increase the sensitivity to Peg-IFN α-2b therapy by regulating key genes GSK3B, KRAS, FLT1, or GRB2, whereas, 13 miRNAs (miR-195-5p, miR-215-5p, miR-9-5p, miR-130a-3p, miR-214-3p, miR-149-5p, miR-429, miR-200b-3p, miR-200c-3p, miR-16-2-3p, miR-141-3p, miR-200a-3p, and miR-218-5p) might decrease the sensitivity to Peg-IFN α-2b therapy by regulating key genes, FGF2, GSK3B, PDGFRA, FGFR1, KRAS, FLT1, MYC, TGFB2, EFNA1, MAPK9, or GRB2. Furthermore, seven novel miRNAs, namely Novel_352, Novel_459, Novel_527, Novel_677, Novel_717, Novel_749, and Novel_801 were found to be downregulated specifically in the sensitive group, whereas, Novel_142 and Novel_664 were found to be downregulated specifically in the insensitive group. Our data indicate that the serum exosomal-miRNAs could be involved in regulating the sensitivity of chronic HBV (CHB) patients to Peg-IFN α-2b therapy, which might suggest potential novel therapeutic biomarkers and standard options for CHB patients. Clinical
Introduction
Chronic hepatitis B virus (CHB) infection is a serious chronic disease directly threatening human health. In the Global Burden of Disease Study for 2017, HBV was estimated to have resulted in 799,007 deaths, being attributable to liver cirrhosis (383,971 deaths), liver cancer (325, 447 deaths), and acute infection (89,589 deaths) (Homolak et al., 2021). A high degree of overlap is presented between HBV infection and hepatocellular carcinoma (HCC) incidence regions worldwide, especially in Asia (Zhang et al., 2022), where about 90% of HCC patients have an HBV infection history (Ringelhan et al., 2017). The risk of HCC development in patients with CHB infection is 100-fold higher compared with those without HBV infection (Rapti and Hadziyannis, 2015). Considering the great threat and burden of CHB and its induced diseases on global Health in the future, the World Health Organization (WHO) has launched a number of initiatives (Chen et al., 2013), which include the Global Hepatitis Network and a Framework for Action, to tackle these issues.
The latest consensus on the endpoints of CHB treatment declared that complete cure (elimination of virus from host) is not feasible, while, functional cure, namely HBsAg clearance is a feasible goal for patients currently on existing therapy (Lok et al., 2017).HBsAg clearance can achieve clinical cure of hepatitis B and reduce the incidence of liver cancer (Sarin et al., 2016). Pegylated interferon alfa-2b (Peg-IFN α-2b) is a first-line treatment for HBV infection, which can significantly remove HBsAg, and is an important therapeutic method to achieve clinical cure of hepatitis B. However, only 30–40% of patients who have ever been treated with nucleoside achieved HBsAg clearance after sequential monotherapy with Peg-IFN α-2b (Huang et al., 2017). This evidence demonstrates that there are differences in the sensitivity of CHB patients to Peg-IFN α-2b therapy, however, the biological targets that distinguish sensitive and insensitive populations are still unclear.
Exosomes, a kind of endogenous extracellular vesicle (EVs), containing a variety of proteins, lipids, nucleic acids, and glycoconjugates, play an important role in many biological processes of human health and disease (Liao et al., 2019; Pegtel et al., 2019). It has been reported that exosomes could transfer HBV to hepatocytes in an active manner. At the same time, HBV could be transferred to natural killer (NK) cells through exosomes and inhibited NK cell function and cell viability (Yang et al., 2017). MicroRNAs (miRNAs) are a kind of small endogenous noncoding RNAs, which participate in the regulation of post-transcriptional gene expression (Liu et al., 2014). Some miRNAs have been identified as potential biomarkers for liver disease and HCC. For example, miR-122, miR-185, miR-29, miR-143, miR-21, and miR-223 expressions were specifically upregulated or downregulated during fibrosis progression in the serum of patients with CHB (Loureiro et al., 2020). MiR-125a-5p and miR-1231 could directly target HBV transcripts (Hayes et al., 2016).
MiR-122 might affect the anti-HBV effect of interferon drugs, because miR-122 could inhibit the expression and replication of HBV, while interferon drugs can downregulate the expression of miR-122 (Yang et al., 2017). It is clear that, secreted miRNAs, especially those in EVs such as exosomes, may involve in antiviral immunotherapy. Whether the exosomal-miRNAs affect the sensitivity of CHB patients to interferon drugs needs to be further studied. Thus, in the present study, miRNA sequencing of peripheral circulating exosomes, and M-TgHBV mice model were employed to explore the biological targets and the underlying mechanisms that distinguish the sensitivity and insensitivity of CHB patients to interferon therapy.
Materials and Methods
Patients with CHB
Twenty-one patients with CHB were included in this study. The clinical characteristics of the patients are listed in Supplementary Table S1. Patients were admitted at Guangdong Provincial People's Hospital, Guangzhou, Guangdong, China, to receive Peg-IFN α-2b 180 μg once a week for at least 48 weeks. The diagnosis of CHB was made by serum biochemical and serological tests showing evidence of CHB. All the patients were 18–60 years of age, treatment naive, and never previously received IFN therapy, were HBsAg and serum HBV DNA positive, and HBeAg positive or negative. Routine blood tests were performed each month. HBsAg level was determined every 12 weeks. HBsAg loss rate was used to define the efficacy responses of Peg-IFN α-2b (Takkenberg et al., 2013). Responses were measured at 12, 24, 36, and 48 weeks after administration.
Patients were divided into two groups according to HBsAg level after 48 weeks of administration. Patients whose HBsAg levels reduced by more than 90% at week 48 compared with that at week 0 were assigned into the sensitive group, whereas others were assigned to the insensitive group. Written informed consent was obtained from all patients. The study protocol and informed consent were approved by the Ethics Committee of Guangdong Provincial People's Hospital and conformed to the ethical guidelines of the Helsinki Declaration (approval no.: KY2020-569-01).
Exosome extraction
The blood samples were centrifuged at 2,500g for 10 min twice to remove blood cells and cell debris. The supernatants were ultracentrifuged at 100,000 g for 70 min, followed by one wash with phosphate-buffered saline (PBS). The exosome pellets were collected.
Transmission electron microscopy
The collected exosomes were resuspended in PBS, spotted onto formvar–carbon-coated grids (200 mesh), and fixed with paraformaldehyde (2%, v/v) for 5 min at room temperature. After washed with deionized water, the exosomes were directly negatively stained using uranyl acetate. The grids were visualized using a Tecnai G2 F20 S-TWIN (200kv) transmission electron microscope (FEI, Holland) conducted by Puchuan Technology Co., Ltd. (Guangzhou, China).
Western blotting
The protein of collected exosomes were prepared using radio immunoprecipitation assay buffer containing a 1 mM phenlymethylsulfonyl fluoride and protease inhibitor mixture (Beyotime Biotechnology, Guangzhou, China), and quantified using the Coomassie Brilliant Blue Kit (Bio-Rad, Hercules, CA). Then, protein samples were separated by sodium dodecyl sulfate–polyacrylamide gel electrophoresis, transferred to polyvinylidene difluoride membrane, blocked with 5% bovine serum albumin and incubated with primary antibodies overnight at 4°C. The anti-Calnexin Ab (ab133615, RRID:AB_2864299), anti-CD63 Ab (ab134045, RRID:AB_2800495), anti-Hsp70 Ab (ab181606, AB_2910093), and anti-TSG101 Ab (ab125011, RRID:AB_10974262) were purchased from Abcam (Abcam, Cambridge, UK). ECL chemiluminescence reagent was applied to detect for fluorescent signals using Fluor Chem E (Santa Clara, CA).
miRNAs sequencing
The total RNA of exosomes was extracted from the collected exosomes derived from seven individuals in the sensitive group or the insensitive group, using the miRNeasy Mini Kit (no. 217004; Qiagen, Germany) following the manufacturer's protocol. RNA concentration was quantitated using Agilent 2100 Bioanalyzer and the RNA 6000 Kit (no. 5067-1513; Agilent Technologies, CA).
miRNA-seq was conducted by Beijing Genomics Institute (Beijing, China) on the BGISEQ-500 platform. Mirdeep2 software (miRDeep2 accurately identifies known and hundreds of novel miRNAs genes in seven animal clades) was used to compare the small RNA sequence of each sample with the miRNA precursor and the mature sequence of the corresponding species in the miRBase database. MiREvo (miREvo: An Integrative microRNA Evolutionary Analysis Platform for Next-generation Sequencing Experiments) and mirdeep2 software were used to predict the novel miRNAs and their secondary structure. The counting numbers of the miRNAs in each sample were calculated. The up- or downregulated miRNAs in the sensitive group or the insensitive group were identified, and subsequently analyzed using Venny 2.1. These sequence data have been submitted to the GenBank databases under accession number SUB11371814.
Prediction and analysis of target genes of potential miRNAs
The target genes of the identified miRNAs were predicted using miRBD, TargetScan, and miRTarBase. Genes obtained from these three databases were analyzed using Venny 2.1. The miRNA-target network was constructed using Cytoscape 3.7.2. The gene ontology (GO) and Kyoto Encyclopedia of Genes and Genomes (KEGG) enrichment analyses were performed for the target genes using the Database for Annotation, Visualization, and Integrated Discovery (DAVID) and the online software Omicshare.
Animals and treatment
The animal experiments were approved by the International Institute for Translational Chinese Medicine Animal Care and Use Committee, Guangzhou University of Chinese Medicine (Guangzhou, China). M-TgHBV mice (4 weeks, 15–18 g) were purchased from Shanghai Research Center for Model Organism (Shanghai, China). C57BL/6 mice (4 weeks, 15–18 g) were purchased from Laboratory Animal Center of Southern Medical University (License number: SCXK [Guangdong] 2016-0041; Guangzhou, China). The mice were kept in the animal facility in the SPF animal laboratory (License number: SYXK [GZ] 2019–0144) at the International Institute for Translational Chinese Medicine, Guangzhou University of Chinese Medicine (Guangzhou, China).
The M-TgHBV mice (n = 28, half of male and female) and wild-type C57BL/6 mice (n = 14, half of male and female) received subcutaneous injection with IFN α (1ug/20g) (cat. 50525-M01H; Sino Biological, Inc., Beijing, China) twice a week for 8 weeks. The body weights of the mice were recorded every week. Blood samples (200 μL each mouse) were collected in heparin tubes every 2 weeks, and plasma were separated by centrifugation at 8,000 rpm for 10 min. Finally, the mice were sacrificed. Similar to the CHB patients, the mice whose HBsAg levels decreased by more than 60% at week 8 compared with that at week 0 were assigned into the sensitive group, while others were assigned into the insensitive group. A decrease in the HBsAg levels of more than 80% was defined to have response to IFN α treatments.
Enzyme-linked immunosorbent assay for HBsAg
Levels of HBsAg in plasma of mice after IFN α treatments were measured by enzyme-linked immune sorbent assay (ELISA), using the Quantitative ELISA Kits (KEHUA Bio-Engineering Co., Ltd., Shanghai, China), according to the manufacturer's instructions. Results were expressed as pg/mL of plasma.
Alanine aminotransferase and aspartate aminotransferase detection
Levels of alanine aminotransferase (ALT) and aspartate aminotransferase (AST) in plasma of mice after IFN α treatments were detected using an automatic biochemical analyzer (BS-240; Mindray, China) according to the manufacturer's protocol. Results were expressed as U/L of plasma.
Real-time polymerase chain reaction
Total RNA was isolated from liver tissues of mice using the TRIzol reagent (Invitrogen). The isolated RNA was quantified by Qubit fluorimeter (Thermo Fisher). cDNA was synthesized from total RNA using a Reverse Transcription Kit (TaKaRa, Shiga, Japan). SYBR Green real-time polymerase chain reaction (RT-PCR) amplification and detection were then performed using an ABI 7500 Fast system (Applied Biosystems, Foster City, CA). Relative gene expression was normalized to GAPDH. The sequences of RT-PCR primers are presented in Supplementary Table S2.
Statistical analysis
All data were analyzed using GraphPad Prism 7 Software. When appropriate, Student's t-test or one-way analysis of variance with Dunnett's post-test was used to determine statistically significant differences among the control and experimental groups. Significance was defined as p < 0.05.
Results
Different sensitivities to Peg-IFN α-2b treatment in CHB patients
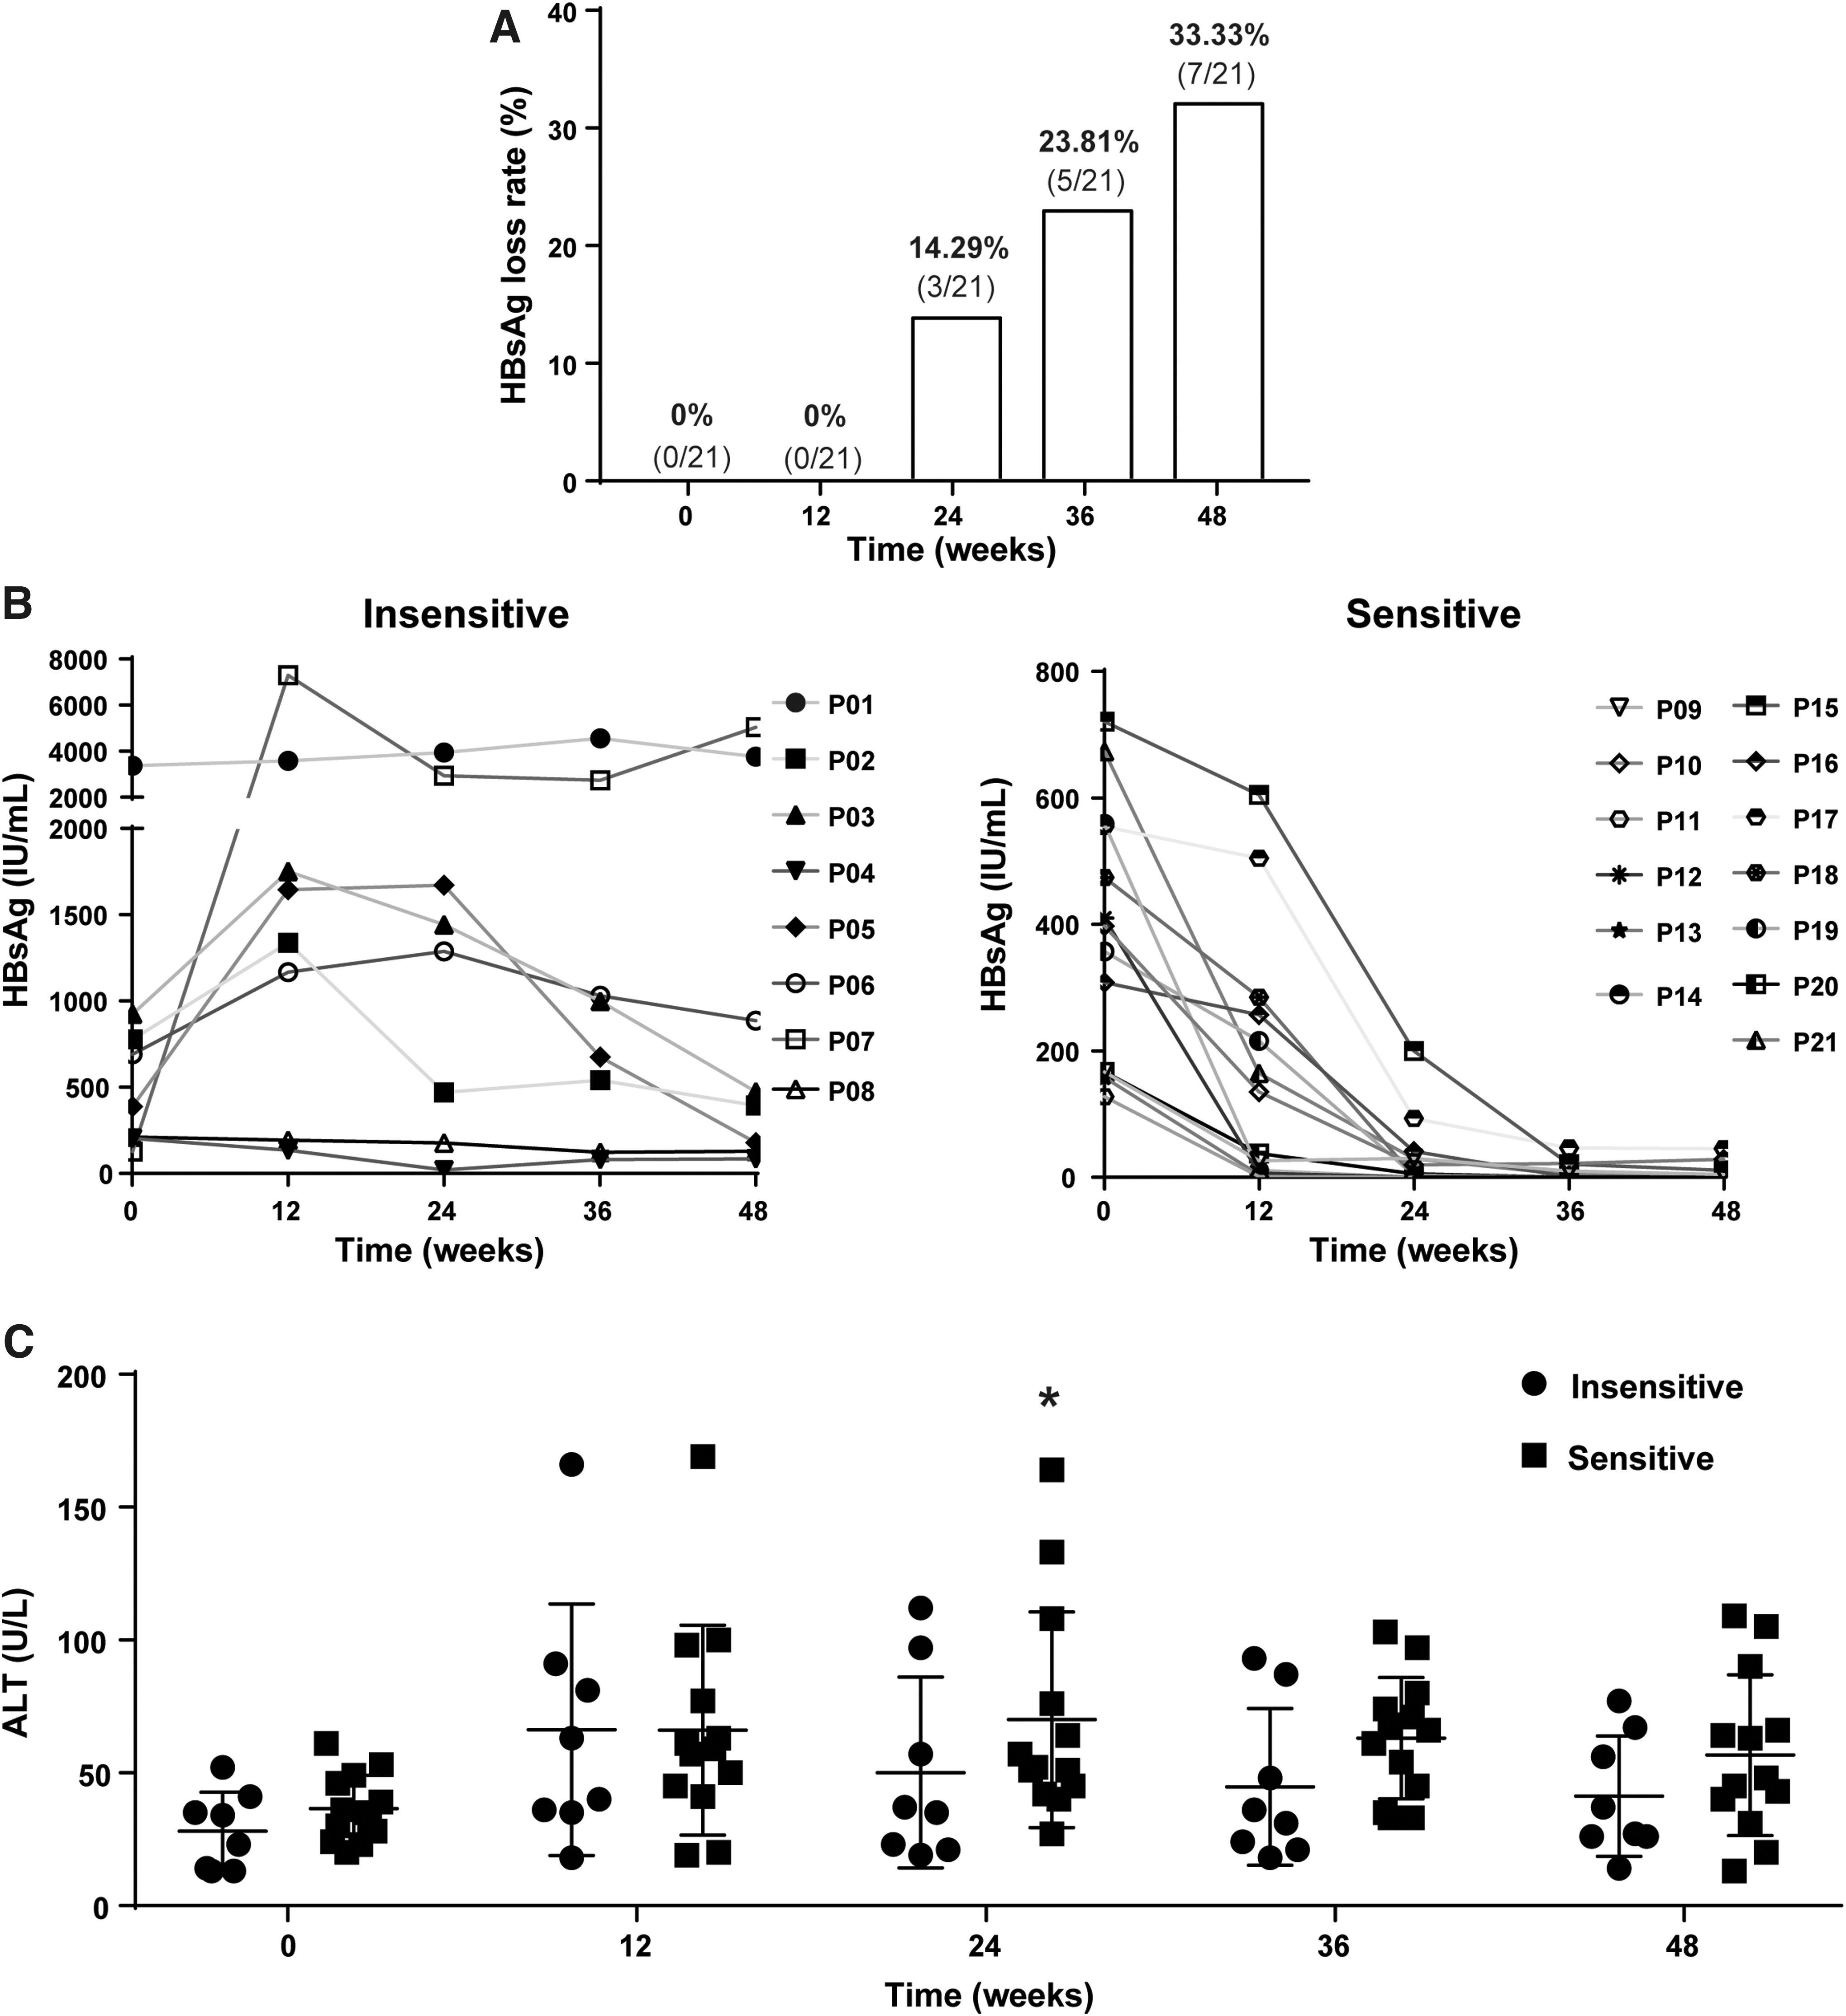
The clinical characteristics of the patients are listed in Supplementary Table S1. Three of 21 (14.29%) patients achieved HBsAg loss (<0.05 IU/mL) after 24 weeks of Peg-IFN α-2b therapy. Five of 21 (23.81%) patients achieved HBsAg loss after 36 weeks of Peg-IFN α-2b therapy. Only 33.33% (7/21) of patients achieved HBsAg loss after 48 weeks of Peg-IFN α-2b therapy (Fig. 1A). Thirteen patients whose HBsAg levels reduced rapidly by more than 90% at week 48 compared with that at week 0 were assigned into the sensitive group. Eight patients whose HBsAg levels were dropped slowly or even rose from 0 to 48 weeks were assigned into the insensitive group (Fig. 1B). Compared with 0 week, the levels of ALT were slightly increased both in the sensitive group and insensitive group after Peg-IFN α-2b therapy. There was no significantly difference of ALT levels between sensitive group and insensitive group at week 0, 12, 24, 36, and 48 (Fig. 1C).
Different sensitivity to Peg-IFN α-2b treatment in CHB patients.
Different exosomal-miRNA expression levels in the sensitive or insensitive groups to Peg-IFN α-2b therapy
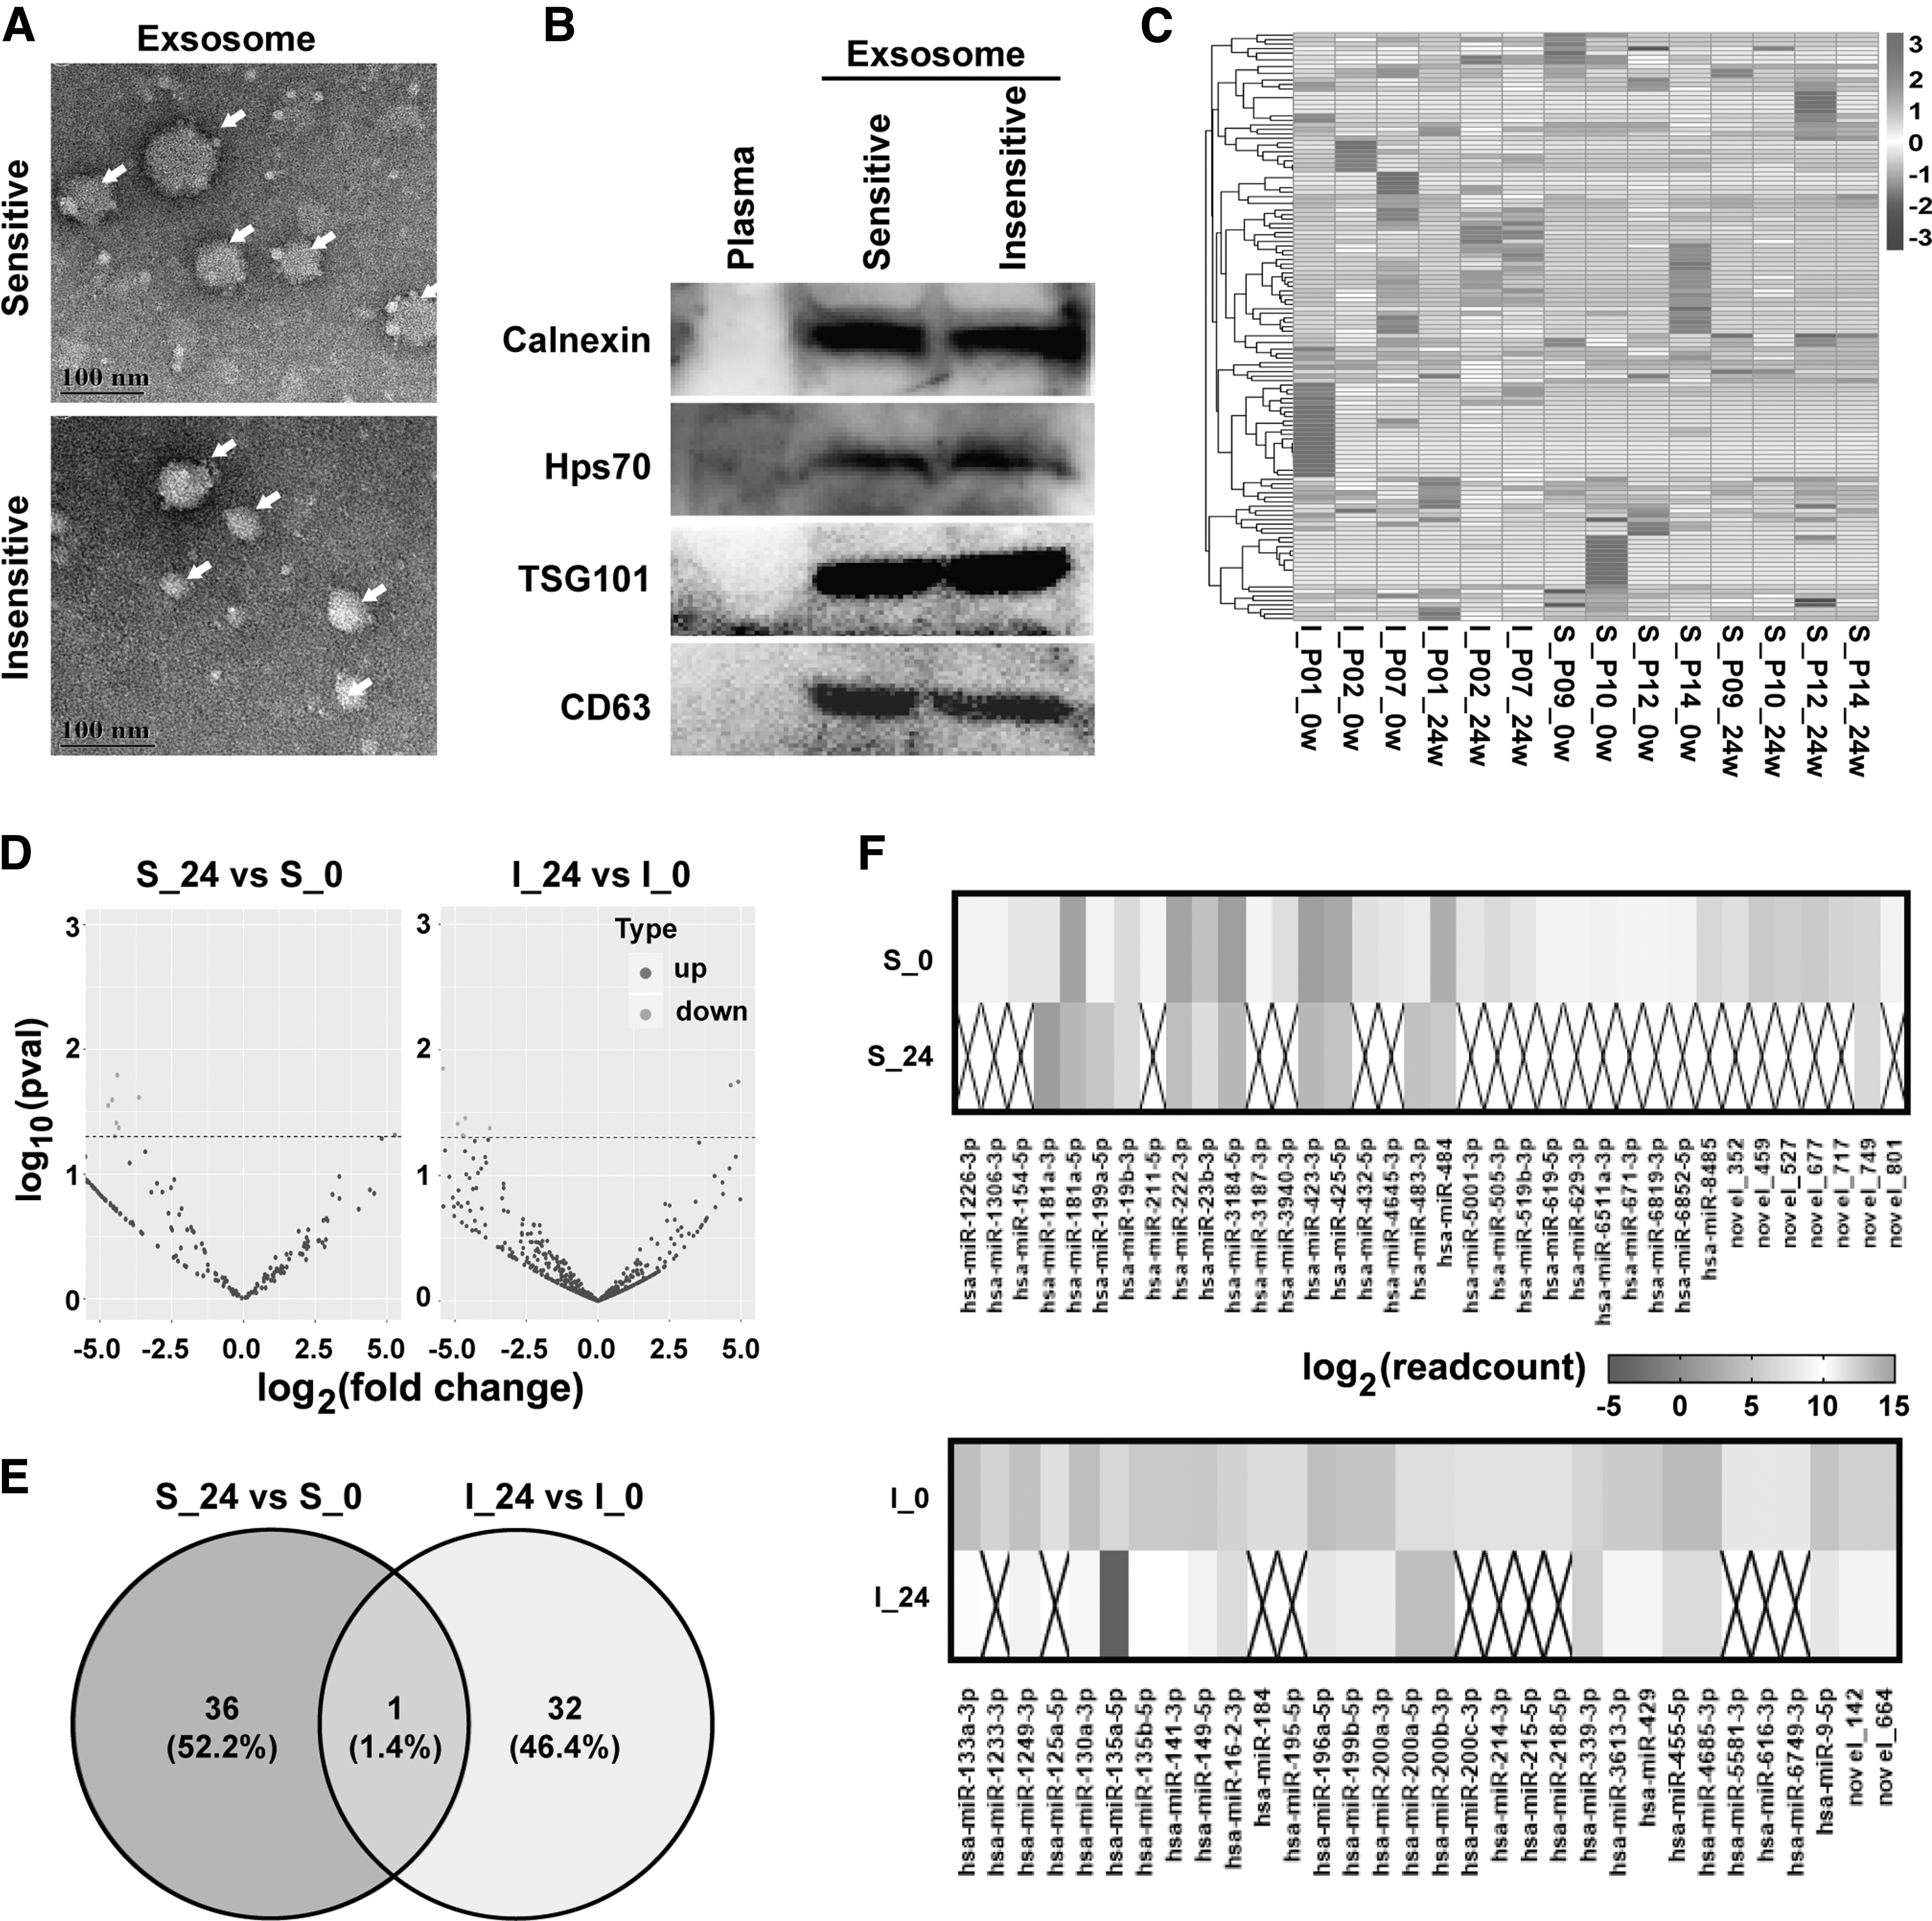
We first characterized serum exosomes isolated from sensitive or insensitive patients using electron microscopy and western blotting. Images of transmission electron microscopy confirmed that the purified particles were membrane bound, round, and heterogeneous in size (40–100 nm) (Fig. 2A). In addition, the exosome markers, Calnexin, Hps70, TSG101, and CD63, were both positive in the sensitive and insensitive groups, while, negative in the plasma sample (Fig. 2B).
Exosomal-miRNA expression levels in sensitive or insensitive groups to Peg-IFN α-2b therapy.
To explore the causes of different sensitivities to Peg-IFN α-2b therapy in CHB patients, miRNA sequencing was performed to analyze the exosomal-miRNAs in the serums of the sensitive and insensitive patients (Fig. 2C). After quality control and filtering, a total of 790 known miRNAs and 148 novel miRNAs were identified in exosomes from serum of the three insensitive and four sensitive patients (Supplementary Table S3). Compared with the miRNAs at week 0, 2 known miRNAs were significantly upregulated, whereas 28 known miRNAs and 7 novel miRNAs were significantly downregulated in serum exosomes from the sensitive group (p < 0.05, > 3.5 log2-fold change). In the insensitive group, 2 known miRNAs were significantly upregulated, whereas 29 known miRNAs and 2 novel miRNAs were significantly downregulated compared with the miRNAs at week 0 (p < 0.05, > 3.5 log2-fold change) (Fig. 2D and Tables 1 and 2).
Upregulated and Downregulated Known MicroRNAs in Sensitive and Insensitive Groups
The Novel MicroRNAs in Sensitive and Insensitive Groups
In addition, 36 (52.20%) miRNAs were identified that might induce sensitivity specifically, including 34 miRNAs that were downregulated and 2 miRNAs that were upregulated in serum exosomes from the sensitive group. Thirty-two (46.40%) miRNAs were identified that might induce insensitivity specifically, including 30 miRNAs that were downregulated and 2 miRNAs that were upregulated in serum exosomes from the insensitive group (Fig. 2E, F).
Target gene prediction and analysis
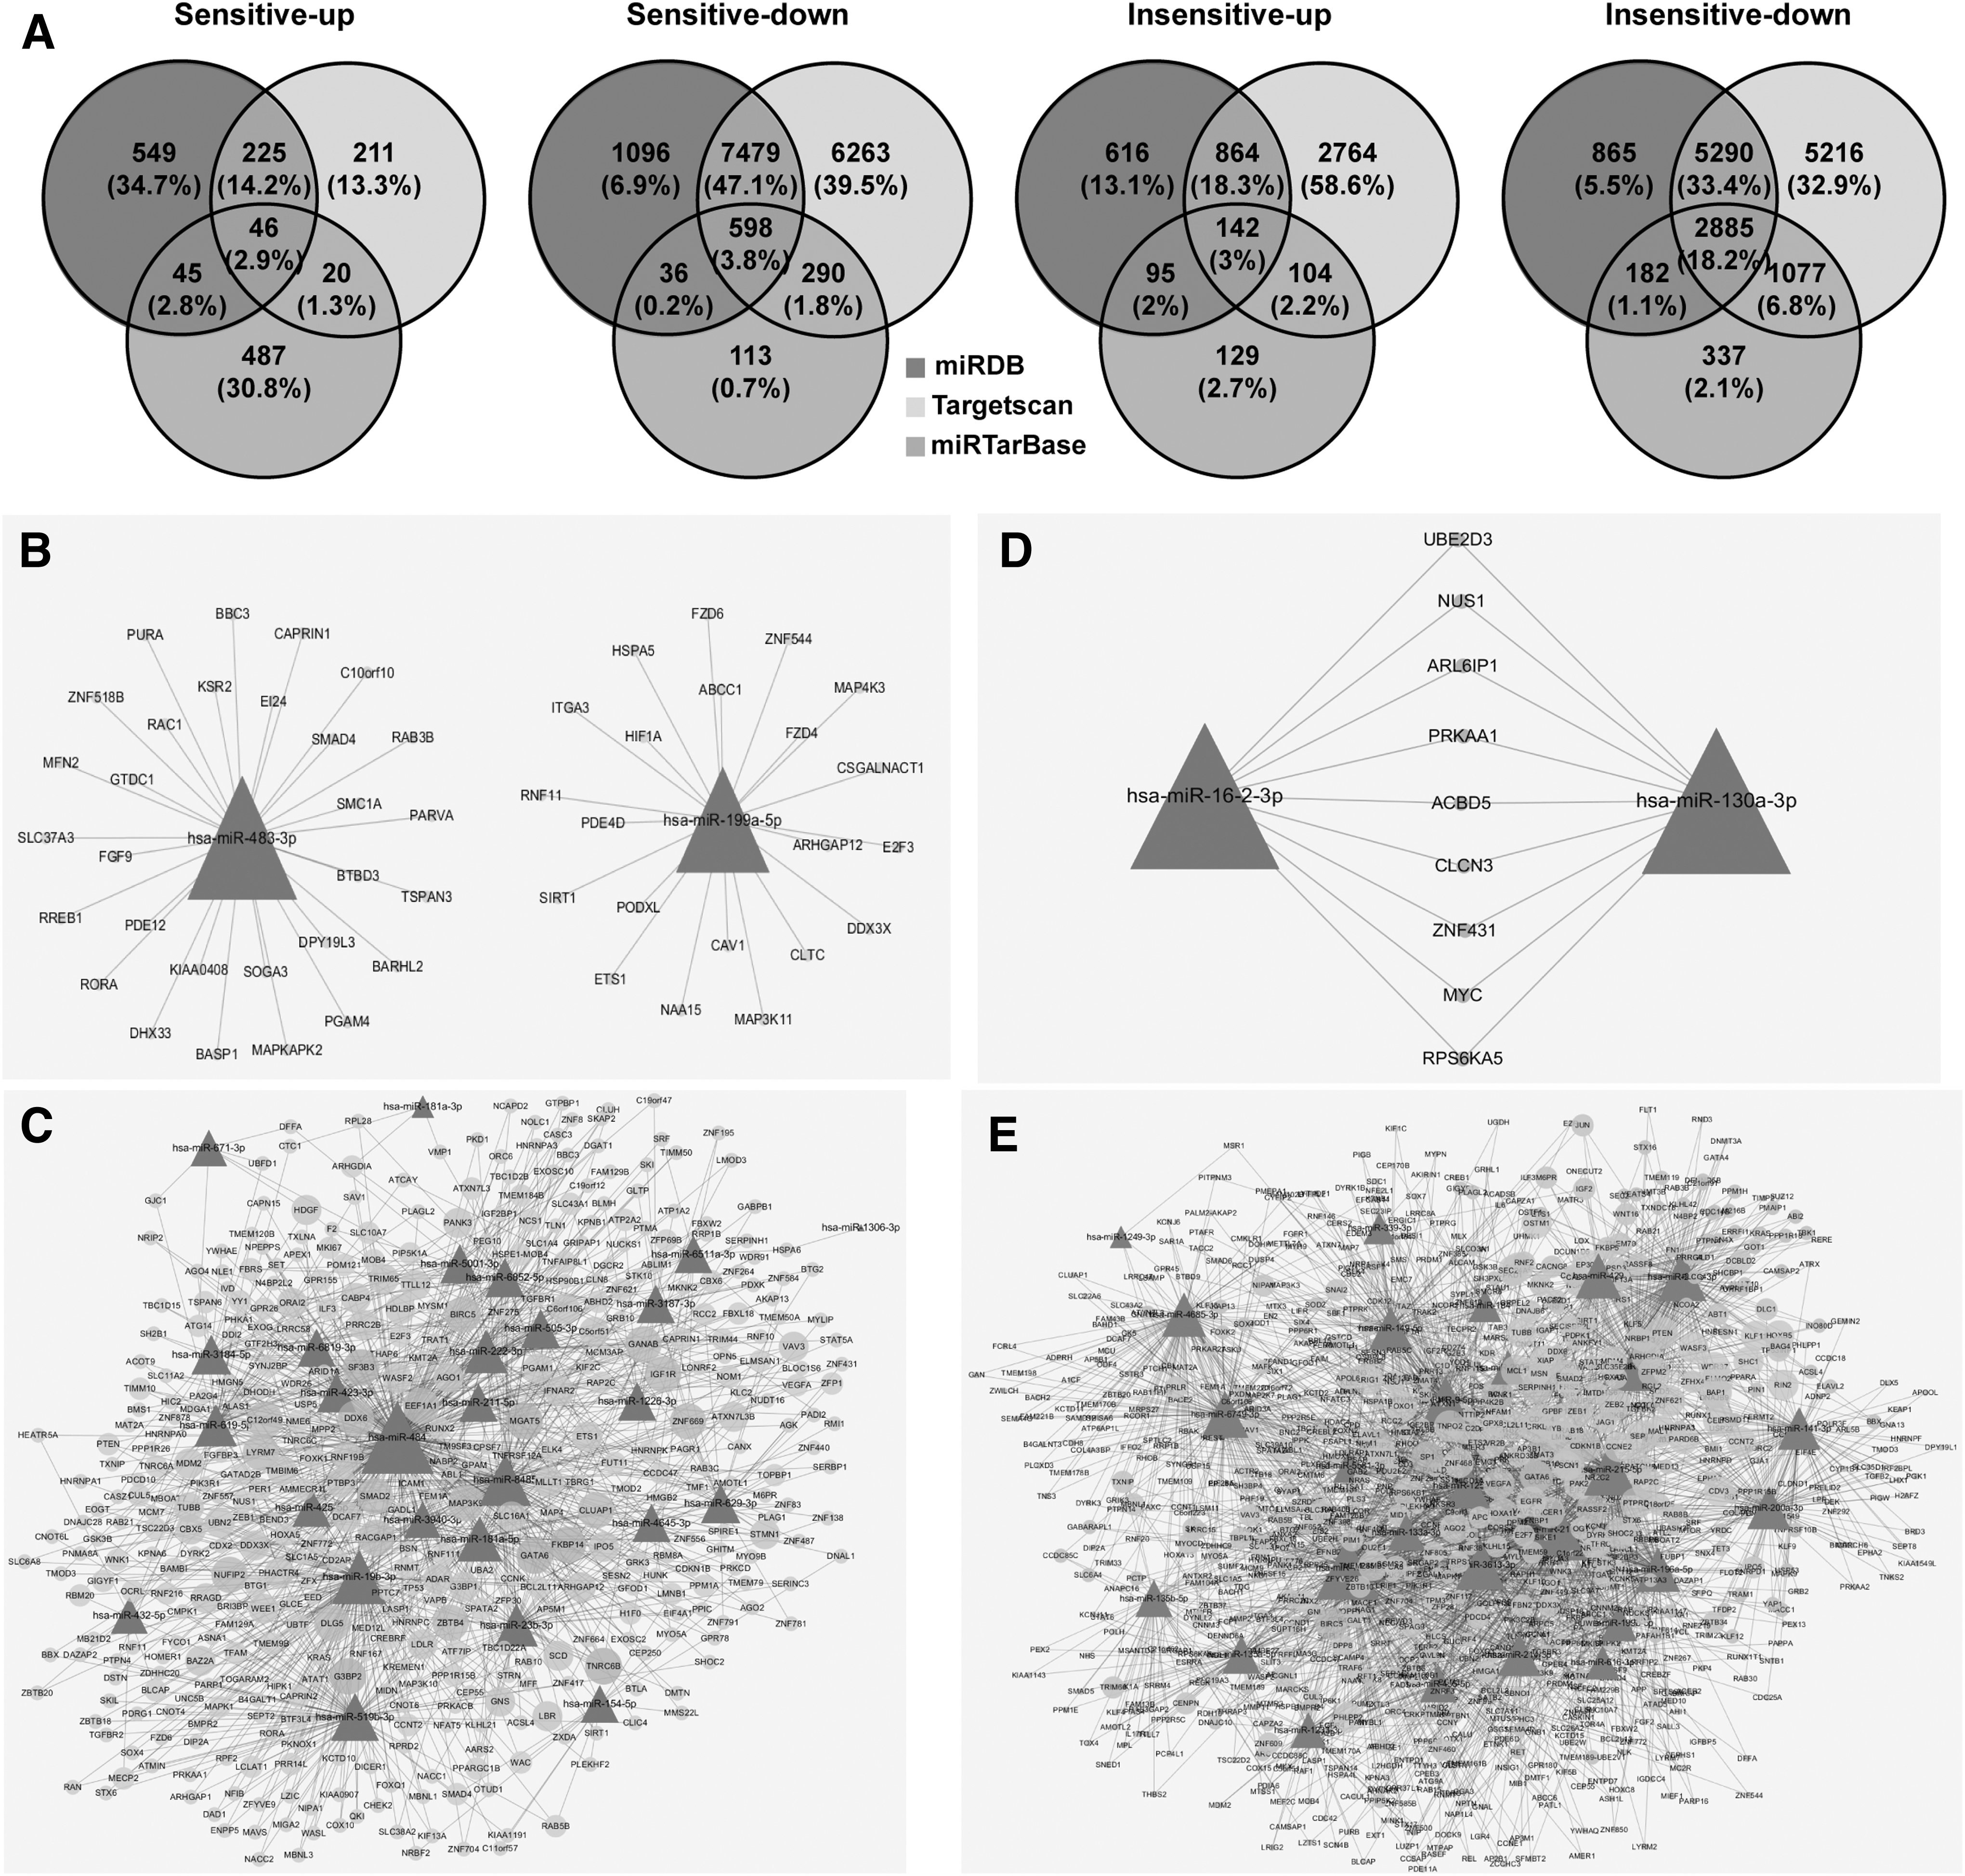
In the sensitive group, 1,583 targets were predicted in upregulated miRNAs and 15,875 were predicted in downregulated miRNAs. Among these miRNAs, 46 targets were common to all three databases in upregulated miRNAs, and 598 targets were common to all three databases in downregulated miRNAs. In the insensitive group, 4,714 targets were predicted in the upregulated miRNAs and 15,852 were predicted in the downregulated miRNAs. One hundred forty-two targets were common to all three databases in the upregulated miRNAs, and 2,885 targets were common to all three databases in the downregulated miRNAs (Fig. 3A).
Target gene prediction and analysis for selected exosomal-miRNAs.
Cytoscape networks were constructed to illustrate the relationships between miRNAs and the target genes in the sensitive or insensitive groups. For example, in the upregulated miRNAs of the sensitive group, the miR-483-3p might regulate 29 target genes, and the miR-199a-5p might regulate 21 target genes (Fig. 3B). In the downregulated miRNAs of the sensitive group, the top five enriched and crosslinked networks were the miR-484, miR-19b-3p, miR-8485, miR-519b-3p, and miR-181a-5p-target genes (Fig. 3C). On the other hand, in the upregulated miRNAs of insensitive group, the miR-130a-3p might regulate 122 target genes, and the miR-16-2-3p might regulate 29 target genes, and 9 targets were common to these two miRNAs (Fig. 3D). In the downregulated miRNAs of the insensitive group, the top five enriched and crosslinked networks were the miR-195-5p, miR-218-5p, miR-215-5p, miR-3613-3p, and miR-200c-3p-target genes (Fig. 3E).
GO and KEGG enrichment and analysis
To further explore the potential role of these exosomal-miRNAs in the sensitive or insensitive groups to Peg-IFN α-2b therapy, we used DAVID database to carry out functional annotation and enrichment analysis of the predicted target genes. The top 10 GO terms of targets of up- or downregulated miRNAs in the sensitive group are presented in Figure 4A. Six common terms, including cytosol, cytoplasm, nucleus, membrane, protein binding, and extracellular exosome, were enriched both in up- or downregulated miRNAs of the sensitive group. Four terms were specifically enriched in the upregulated miRNAs of the sensitive group, including positive regulation of transcription by RNA polymerase II, transcription factor binding, positive regulation of gene expression, and nuclear hormone receptor binding; whereas, four terms, including nucleoplasm, RNA binding, ATP binding, and DNA binding, were enriched in downregulated miRNAs of the sensitive group. The top 10 GO terms of targets of up- or downregulated miRNAs in the insensitive group are presented in Figure 4B.

GO and KEGG enrichment and analysis for the predicted target genes of potential exosomal-miRNAs.
Similar to that in the sensitive group, six common terms, including cytosol, cytoplasm, nucleus, nucleoplasm, protein binding, and negative regulation of transcription by RNA polymerase II were enriched both in up- or downregulated miRNAs of the insensitive group. Four terms were specifically enriched in upregulated miRNAs of the insensitive group, including ATP binding, positive regulation of gene expression, protein phosphorylation, and ventricular septum morphogenesis; whereas, four terms, including plasma membrane, positive regulation of transcription from RNA polymerase II, membrane, and metal ion binding were enriched in downregulated miRNAs of the insensitive group.
KEGG pathway enrichment analysis revealed that the targets of upregulated miRNAs in the sensitive group were enriched in pathways in cancer, FoxO signaling pathway, gastric cancer, proteoglycans in cancer, HCC, cell cycle, Hippo signaling pathway, pancreatic cancer, signaling pathways regulating pluripotency of stem cells, and miRNAs in cancer, whereas, the targets of upregulated miRNAs were enriched in pathways in cancer, proteoglycans in cancer, thyroid hormone signaling pathway, lysosome, breast cancer, gastric cancer, Cushing syndrome, cellular senescence, HCC, and Kaposi's sarcoma-associated herpesvirus infection (Fig. 4C).
As shown in Figure 4D, the top 10 enriched KEGG pathways of targets of upregulated miRNAs in the insensitive group were pathways in cancer, proteoglycans in cancer, PI3K-Akt signaling pathway, MAPK signaling pathway, miRNAs in cancer, hepatitis B, focal adhesion, human papillomavirus infection, FoxO signaling pathway, and Ras signaling pathway, whereas, the top 10 enriched pathways of targets of downregulated miRNAs in the insensitive group were TGF-beta signaling pathway, signaling pathways regulating pluripotency of stem cells, MAPK signaling pathway, miRNAs in cancer, HCC, endocytosis, adherens junction, pathways in cancer, colorectal cancer, and gastric cancer.
Novel miRNAs prediction
A total of 148 novel miRNAs were found in exosomes from serum of the three insensitive and four sensitive patients (Supplementary Table S3). However, according to the fold change status (p < 0.05, > 3.5 log2-fold change), seven downregulated novel miRNAs were found in the sensitive group, namely Novel_352, Novel_459, Novel_527, Novel_677, Novel_717, Novel_749, and Novel_801. Meanwhile, two downregulated novel miRNAs were found in the insensitive group, namely Novel_142 and Novel_664. The details and predicted secondary structure maps of the novel miRNAs are shown in Table 2 and Figure 5.

The predicted secondary structure maps of the novel miRNAs.
Different sensitivities to IFN α treatment in HBV mice
The M-TgHBV mice transfected with HBV 25–8 gene were employed to evaluate the sensitivity to IFN α therapy (Ren et al., 2006). After 2 or 4 weeks of treatments, four of 28 (14.29%) HBV mice had a decrease in the HBsAg levels of more than 80%. Seven of 28 (25.00%) mice had a decrease in the HBsAg levels of more than 80% after 6 weeks of IFN α therapy. Only 35.71% (10/28) of mice had a decrease in the HBsAg levels of more than 80% after 8 weeks of IFN α therapy (Fig. 6A). The mice were divided into the sensitive group and the insensitive group according to the HBsAg levels from 0 to 8 weeks of IFN α treatment. Sixteen mice whose HBsAg levels reduced rapidly by more than 60% at week 8 compared with that at week 0 were assigned into the sensitive group. Twelve mice whose HBsAg levels declined slowly and fluctuated from 0 to 8 weeks were assigned into the insensitive group (Fig. 6B).

Different sensitivities to IFN α treatment in HBV mice.
There was no significant difference of ALT or AST levels between the sensitive group and insensitive group at week 0, 2, 4, 6, and 8 (Fig. 6C, D). In addition, no significant difference in the average body weight of mice was observed among these groups (Fig. 6E).
Analysis of pathways and interaction networks
We then carried out RT-PCR for key targets in molecular pathways associated with serum exosomal-miRNAs during IFN α therapy in HBV mice. Sixty-two key targets were selected according to KEGG pathway (Supplementary Table S2). As shown in Figure 6F, eight genes, including FGF2, GSK3B, PDGFRA, FGFR1, KRAS, FLT1, MYC, and TGFB2, were upregulated in both sensitive and insensitive mice compared with wild-type mice after 8 weeks of IFN α therapy, meanwhile, the expressions of these eight genes were significantly higher in the insensitive mice than that in the sensitive mice. Two genes, namely EFNA1 and MAPK9, were downregulated in both sensitive and insensitive mice compared with wild-type mice after 8 weeks of IFN α therapy, meanwhile, the expression levels of these two genes were significantly lower in the sensitive mice than that in the insensitive mice. One gene, namely GRB2, was downregulated in the sensitive mice, whereas upregulated in the insensitive mice, compared with wild-type mice after 8 weeks of IFN α therapy.
Combined with these 11 identified genes and associated pathways and miRNAs, the interaction network was visually analyzed using cytoscape (Fig. 6G). Five miRNAs, namely miR-425-5p, miR-8485, miR-619-5p, miR-181a-5p, and miR-484, might increase the sensitivity to interferon therapy in CHB patients by regulating key genes, GSK3B, KRAS, FLT1, or GRB2, in FoxO signaling pathway, Ras signaling pathway, PI3K-Akt signaling pathway, or MAPK signaling pathway. Thirteen miRNAs, including miR-195-5p, miR-215-5p, miR-9-5p, miR-130a-3p, miR-214-3p, miR-149-5p, miR-429, miR-200b-3p, miR-200c-3p, miR-16-2-3p, miR-141-3p, miR-200a-3p, and miR-218-5p, might decrease the sensitivity to interferon therapy in CHB patients by regulating key genes, FGF2, GSK3B, PDGFRA, FGFR1, KRAS, FLT1, MYC, TGFB2, EFNA1, MAPK9, or GRB2, in FoxO signaling pathway, Ras signaling pathway, TGF-β signaling pathway, Hippo signaling pathway, PI3K-Akt signaling pathway, or MAPK signaling pathway.
Discussion
Considering the great threat and burden of CHB and its induced diseases on global health in the future, the prevention and treatment of hepatitis B is an important task for mankind at present. Functional cure, namely HBsAg clearance, is a feasible goal for patients currently on existing therapy (Lok et al., 2017). Peg-IFN α-2b is a first-line treatment for HBV infection, which can significantly achieve HBsAg clearance. However, only 30–40% of patients had achieved HBsAg clearance after Peg-IFN α-2b administration (Huang et al., 2017). Obviously, there are differences in the sensitivity of CHB patients to Peg-IFN α-2b therapy. However, the biological targets and the underlying mechanisms that distinguish sensitive and insensitive populations are still unclear.
We found that the expression of exosomal-miRNAs in CHB patients to Peg-IFN α-2b therapy presented significant difference, and exosomal-miRNAs might involve in regulating the efficacy of interferon therapy in CHB patients. Exosomes are emanating as key mediators of intercellular communication, since they carry functionally active proteins, mRNAs, and miRNAs that can be transported to a recipient cell (Ela et al., 2013). It is reported that exosomal miR-194-5p and miR-22-3p could predict HBeAg seroconversion in CHB patients treated with Peg-IFN (Hu et al., 2021), indicating that exosomal-miRNAs could serve as novel biomarkers.
In our study, 36 exosomal-miRNAs (2 upregulated and 34 downregulated) might involve in increasing the sensitivity of interferon therapy in CHB patients, whereas 32 exosomal-miRNAs (2 upregulated and 30 downregulated) might involve in decreasing the sensitivity. The exosomal-miRNAs have a wide range of gene regulatory effects. In the sensitive group, 2 upregulated miRNAs and 29 downregulated miRNAs might regulate 46 targets and 598 targets, respectively. In insensitive group, 2 upregulated miRNAs and 28 downregulated miRNAs might regulate 142 targets and 2,885 targets, respectively.
miRNA–target pathway interaction network further revealed the deep mechanism of miRNAs in regulating the sensitivity of CHB patients to interferon therapy. Exosomal miRNAs are widely involved in hepatitis B virus-related liver disease through targeting different genes (Bandopadhyay et al., 2020). For example, miR-29 upregulation suppresses fibrosis/cirrhosis by repressing collagen-secreting genes in HSCs through TGF-β and NF-κB-mediated pathways (Roderburg et al., 2011).
In our work, we found that (1) miR-484 might increase the sensitivity to interferon therapy in CHB patients by downregulating GRB2, whereas, miR-195-5p and miR-200a-3p might decrease the sensitivity by upregulating GRB2. (2) miR-425-5p, miR-8485, miR-619-5p, and miR-181a-5p might increase the sensitivity by upregulating key genes, GSK3B, KRAS, or FLT1. (3) miR-195-5p, miR-130a-3p, miR-214-3p, miR-149-5p, miR-429, miR-200b-3p, miR-200a-3p, and miR-16-2-3p, might decrease the sensitivity by upregulating key genes, FGF2, GSK3B, PDGFRA, FGFR1, KRAS, FLT1, and MYC. (4) miR-9-5p, miR-215-5p, miR-200c-3p, miR-141-3p, and miR-218-5p might decrease the sensitivity by upregulating key genes, FGF2, GSK3B, KRAS, and TGFB2, whereas, downregulating EFNA1 and MAPK9. These need more studies for validation.
Novel miRNAs might also be potential candidates for regulating the sensitivity of CHB patients to interferon therapy. In our study, a total of 148 novel miRNAs were found in exosomes from serum of insensitive and sensitive patients. More importantly, seven novel miRNAs, namely Novel_352, Novel_459, Novel_527, Novel_677, Novel_717, Novel_749, and Novel_801 were found to be downregulated specifically in the sensitive group, whereas, Novel_142 and Novel_664 were found to be downregulated specifically in the insensitive group. The expression characteristics of these novel miRNAs suggested that they might play a special role in regulating the sensitivity of CHB patients to interferon therapy. However, this hypothesis needs further confirmation.
In conclusion, difference in serum exosomal-miRNA expressions might be correlated to sensitivity of CHB patients to Peg-IFN α-2b therapy. Our data indicated that five miRNAs might increase the sensitivity to Peg-IFN α-2b therapy by upregulating key genes, GSK3B, KRAS, or FLT1, or downregulating GRB2, whereas, 13 miRNAs might decrease the sensitivity to Peg-IFN α-2b therapy by upregulating key genes, GRB2, FGF2, GSK3B, PDGFRA, FGFR1, KRAS, FLT1, MYC, or TGFB2, or downregulating EFNA1 or MAPK9, suggesting interesting potential novel therapeutic standard options. However, further functional and mechanism studies are needed to clarify the role of these miRNAs in regulating sensitivity of CHB patients to Peg-IFN α-2b therapy.
Footnotes
Authors' Contributions
J.H. conceived the ideas and designed the experiments. Q.H., X.X., and X.Z. performed the experiments and analyzed the data. Q.H. prepared the article. Z.L., J.H., and L.L. provided critical revisions to the article. Y.W., W.C., Y.H., X.C., and W.W. provided technical supports. All authors read and agreed on the final version of the article.
Data Availability Statement
The original contributions presented in the study are included in the article, Supplementary Table S3, and further inquiries can be directed to the corresponding authors.
Author Disclosure Statement
No competing financial interests exist.
Funding Information
This work was supported by the projects of the National Natural Science Foundation of China (81720108033, 81930114, 82022074 and 81874367), Natural Science Foundation of Guangdong Province (2018B030322011), the 2020 Guangdong Provincial Science and Technology Innovation Strategy Special Fund (Guangdong-Hong Kong-Macau Joint La) (no: 2020B1212030006), and the Natural Science Foundation for Distinguished Young Scholars of Guangdong Province, China (2017A030306033).
Supplementary Material
Supplementary Table S1
Supplementary Table S2
Supplementary Table S3
References
Supplementary Material
Please find the following supplemental material available below.
For Open Access articles published under a Creative Commons License, all supplemental material carries the same license as the article it is associated with.
For non-Open Access articles published, all supplemental material carries a non-exclusive license, and permission requests for re-use of supplemental material or any part of supplemental material shall be sent directly to the copyright owner as specified in the copyright notice associated with the article.