
Abstract
To better understand how adaptive immune receptors (IRs) in hepatocellular carcinoma (HCC) microenvironments are related to disease outcomes, we employed a chemical complementarity scoring algorithm to quantify electrostatic complementarity between HCC tumor TRB or IGH complementarity-determining region 3 (CDR3) amino acid (AA) sequences and previously characterized hepatitis C virus (HCV) epitopes. High electrostatic complementarity between HCC-resident CDR3s and 12 HCV epitopes was associated with greater survival probabilities, as indicated by two distinct HCC IR CDR3 datasets. Two of the HCV epitopes, HCV*71871 (TRB) and HCV*13458 (IGH), were also determined to represent significantly larger electrostatic CDR3-HCV epitope complementarity in HCV-positive HCC cases, compared with HCV-negative HCC cases, with the CDR3s representing yet a third, independent HCC dataset. Overall, the results indicated the utility of CDR3 AA sequences as biomarkers for HCC patient stratification and as potential guides for the development of therapeutic reagents.
Introduction
The adaptive immune system plays a crucial role in providing long-lasting and targeted defense against cancer growth, a phenomenon traceable to the antigen specificity of B cell immunoglobulins (IGs) and T cell receptors (TCRs). Recent studies have made clear that adaptive immune receptor (IR) recombination reads mined from next-generation sequencing data can contribute to a better understanding of the immune responses in cancer as well as provide biomarkers for stratification of patients (Brown et al., 2015; Chobrutskiy et al., 2018; Ferrall-Fairbanks et al., 2022; Gill et al., 2016; Li et al., 2017; Thorsson et al., 2018; Tong et al., 2017; Tu et al., 2017).
Much of this research has focused on the complementary-determining region-3 (CDR3) because of its crucial role in antigen contact (Arturo et al., 2019; Chobrutskiy et al., 2020a; Chobrutskiy et al., 2020b; Chobrutskiy et al., 2019). The importance of this CDR3 region in adaptive IRs and in antigen contact has been demonstrated, for example, through the discovery that differences in the CDR3 region alone are sufficient for otherwise identical IgM antibodies to distinguish between antigens (Xu and Davis, 2000). With respect to computational approaches, these methods have shown that chemical and structural features of CDR3s can be correlated with specific immune responses (Eakins et al., 2022).
One approach to studying the CDR3 involves the use of a high-throughput sliding window algorithm designed to determine relationships between CDR3s and potential antigen targets based on physicochemical properties of CDR3 amino acids (AAs) (Chobrutskiy et al., 2021; Eakins et al., 2022). This algorithm quantifies CDR3-antigen electrostatic and hydrophobic interactions with a complementarity score (CS). While chemical complementarity scoring approaches, including those using this sliding window algorithm, produce less sensitive results than other methods, for example, molecular dynamics, they are a resource-efficient and highly accessible approach to detecting CDR3-antigen linkages in a systematic and immunologically credible manner in the big data setting.
Unlike cancer sites previously studied using the sliding window algorithm, such as the bladder or skin, the liver is comparatively a site of immune privilege (Crispe et al., 2006). For this reason, exploring interactions between adaptive IRs that can be detected in the setting of hepatocellular carcinoma (HCC), the most common type of primary liver cancer, remains a modest area of research, and, in particular, questions related to HCC and adaptive immunity in the big data setting have yet to be addressed.
In this report, we focused on antigens known to be derived from hepatitis C virus (HCV), which is a major cause of HCC worldwide (de Martel et al., 2015; Yang et al., 2022). Mechanistically, HCV induces chronic hepatic inflammation that progresses to fibrosis, cirrhosis, and eventually liver cancer because of irreversible genetic or epigenetic changes (Goossens and Hoshida, 2015).
Due to hepatitis C patients being in this state of chronic inflammation, we hypothesize that the adaptive immune system may create a characteristic environment in response to the HCV that is connectable to HCC. To test this hypothesis, we employed the CDR3-HCV antigen chemical complementarity assessment approach discussed above and identified CDR3 features that are associated with relatively long survival rates.
Methods
Recovery of adaptive IR recombination reads from The Cancer Genome Atlas liver hepatocellular carcinoma dataset
A manifest file enumerating The Cancer Genome Atlas liver hepatocellular carcinoma (TCGA-LIHC) whole-exome sequence (WXS) binary alignment map (BAM) files was created with the Genomic Data Commons (GDC) web tool (
The WXS file slices were downloaded to a University of South Florida Research Computing cluster using the GDC data transfer tool. Further processing to extract TCR and IG CDR3 recombination reads from the WXS file slices was performed as described (Chobrutskiy et al., 2018; Gill et al., 2016; Tong et al., 2017), and the original software used for this purpose is publicly available at
The software has been extensively benchmarked in numerous publications, especially in the study by Patel et al. (2021). Data representing the entire set of TRB and IGH recombination reads for TCGA-LIHC files are available in SOM Supplementary Table S2.
Recovery of IR recombination reads from the HCC dataset from the Human Genome Sequencing Center at Baylor College of Medicine
WXS files generated at the Human Genome Sequencing Center at Baylor College of Medicine (HGSC-BCM), representing 178 HCC samples and 89 cases (phs000509), including a subset of cases with known HCV infection, were accessed using dbGaP project approval number 6300. The files were downloaded to a University of South Florida Research Computing cluster using the Sequence Read Archive (SRA) Toolkit (v2.10.7).
After download, the SRA files were converted to BAM files, using SAMtools (v1.3.1) (Danecek et al., 2021). The same software, referred to above for obtaining recombination reads from TCGA-LIHC dataset, was used to collect TRB and IGH recombination reads from the HGSC-BCM HCC dataset (Supplementary Table S3; Results section).
Acquisition of HCV epitopes
Known HCV epitopes were selected from the Immune Epitope Database (IEDB) based on requirements that the epitope source be the organism “Hepatitis C virus (ID: 11103),” the host be “Human,” and the assay used to confirm epitope binding be either “T cell” to test electrostatic complementarity with TRB CDR3s (Results section) or “B cell” to test electrostatic complementarity with IGH CDR3s (Results section).
These criteria resulted in 1689 T cell- and 1957 B cell-associated HCV epitopes (Supplementary Table S4). These epitopes are referred to in this report by their IEDB Epitope ID, preceded by an asterisk (e.g., an HCV epitope with Epitope ID 71871 is denoted as HCV*71871).
Calculation of CSs
The electrostatic CS calculations are based on a sliding window algorithm from a previous work (Chobrutskiy et al., 2021). Briefly, a CDR3 AA sequence and a candidate epitope AA sequence were repeatedly aligned. Each alignment resulted in calculation of a net chemical attraction based on electrostatic interactions, as detailed in the study by Chobrutskiy et al. (2021). The calculation includes the potential impacts of AAs positioned directly across from one another as well as a potential electrostatic impact of AAs that may be close to one another in the arrangement of the two sequences, but not directly across from one another.
Then, the alignment is shifted one AA at a time, and there is a recalculation of the net chemical attraction, that is, the CS. The highest CS was identified and used to represent the electrostatic complementarity between a CDR3-HCV epitope pair. These calculations were performed by an extensively benchmarked (Eakins et al., 2022; Huda et al., 2022; Patel et al., 2022) web tool, Adaptive Match.
Two csv files representing (1) case IDs and CDR3 AA sequences and (2) HCV epitope AA sequences were inputted into the web tool to obtain CSs for each CDR3-epitope pair. Additionally, (3) survival data linked to case IDs were inputted for an initial assessment of the relationship between CSs and survival probabilities; and (4) gene expression data were also inputted for assessment of gene expression related to the CS values.
Example adaptive match input and output csv files are available in the SOM as Supplementary Tables S5–S9.
Survival analysis
The Python packages, pandas, v1.4.4, and lifelines, v0.27.4, were used to perform Kaplan–Meier (KM) analyses for disease-free survival (DFS) or overall survival (OS) to confirm the
Thus, the number of case IDs in the upper 50th percentile CS group can be slightly larger than the lower 50th percentile group, that is, if the CS does not change to the next lower value at the number of cases IDs that precisely represents the upper 50% of case IDs.
CS and gene expression correlations
Gene expression values representing RNA sequencing (RNAseq) by expectation–maximization calculations for all TCGA-LIHC case IDs were acquired from TCGA-LIHC Firehose Legacy project at
Pearson correlations were calculated for CSs, computed using CDR3s from either WXS or RNAseq, and the expression of each gene (Supplementary Table S10) using the
Alignment of CSs representing HCV epitopes with HCV-positive and -negative cases
The Python package, SciPy, v1.9.3, was used to perform Mann–Whitney U analyses to test whether there were statistically significant greater CS values for HCC cases with positive HCV status versus the CS values for cases with negative HCV status. CSs represented calculations using either TRB or IGH CDR3s extracted from the HGSC-BCM HCC dataset and HCV epitopes indicated (Results section). These CS calculations were facilitated by use of
Box plots showing the range of CSs in these analyses were produced using the R package, ggpubr, v0.5.0.
Summary of statistical analyses
Several statistical analyses were employed for evaluating CSs and clinical features of cases from TCGA-LIHC or HGSC-BCM datasets. KM analyses were used to assess differences in DFS or OS for case sets representing (for TCGA-LIHC) the top or bottom 50th percentile CS values, respectively. p-Values and median survival times from the KM estimator were obtained from the
Corresponding KM plots were constructed using the survminer (v0.4.9) package in R. These same CS groups were also analyzed for associations with gene expression using Pearson's correlation test. Pearson's coefficient and p-values were obtained from the
The Mann–Whitney U test was chosen over Student's t-test due to small sample sizes in the HGSC-BCM HCC dataset, such that normality cannot be assumed using the central limit theorem.
Results
DFS probability distinctions correlated with electrostatic CSs for TCGA-LIHC tumor TRB CDR3s and HCV epitopes
CSs were computed for each combination of tumor TRB CDR3s obtained from either TCGA-LIHC WXS or from the RNAseq files, obtained through Thorsson et al. (2018), and the T cell-related HCV epitopes in the IEDB dataset. For each of the two TCGA-LIHC CDR3 datasets, CSs of TRB CDR3-HCV epitope pairs were grouped by case ID, and the maximum CS for each case ID was then identified and used to classify cases as having CSs in the upper or lower 50th percentile for the overall TCGA-LIHC WXS-based or RNAseq-based CDR3 datasets, respectively.
For electrostatic CSs calculated from the WXS-based CDR3s and the HCV*71871 epitope, which is the HCV envelope glycoprotein E2 peptide, VVVGTTDRFGAPTYR (Table 1), a KM analysis revealed an increase in the DFS probability for the upper 50th compared with the lower 50th percentile of CSs (p = 0.0296; Fig. 1A).

KM analyses representing the electrostatic TRB CDR3-HCV*71871 epitope CSs.
Overview of 12 HCV Epitopes Whereby Their High Complementarity with TRB or IGH CDR3 AA Sequences from TCGA-LIHC Case IDs was Associated with Significant Survival Distinctions
Information includes the IEDB epitope ID originally used to identify each epitope, the epitope sequence, the HCV protein associated with the epitope, and the HCV subtype, if specified, containing the epitope.
AA, amino acid; HCV, hepatitis C virus; TCGA-LIHC, The Cancer Genome Atlas liver hepatocellular carcinoma.
Specifically, the upper 50th percentile of TRB CDR3-HCV*71871 epitope (i.e., epitope ID in IEDB) CSs represented a median DFS of 55 months versus an 18-month median DFS for the lower 50th percentile. These results were consistent with TRB CDR3-HCV*71871 epitope CSs based on RNAseq-based TRB CDR3s (p = 0.0323; Fig. 1B), that is, the results were confirmed by an independent source of CDR3s (Thorsson et al., 2018).
Gene expression associated with electrostatic CSs of TCGA-LIHC tumor TRB CDR3s and HCV epitopes
Pearson's correlation test was used to determine whether CSs calculated from the TRB CDR3-HCV epitope pairs described above correlated with expression of any one of the 61 effector genes identified to be related to cell proliferation (Mauro and Blanck, 2014). Expression of b-related factor 2 (BRF2) demonstrated a statistically significant inverse correlation with CSs computed from the HCV*71871 epitope and TRB CDR3s from both the WXS (p = 0.00718, R = −0.595) and RNAseq (p = 0.00466, R = −0.190) TCGA-LIHC datasets (Fig. 2).

TRB CDR3-HCV*71871 CS and BRF2 mRNA expression in TCGA-LIHC.
The KM analysis also showed decreased DFS probabilities (p = 0.0316) for cases in the upper 50th percentile BRF2 expression group, with median DFS of 19 months, compared with cases in the lower 50th percentile BRF2 expression group, who had a median DFS of 40 months (Fig. 3).

BRF2 mRNA expression and DFS probabilities for TCGA-LIHC dataset. DFS KM analysis of TCGA-LIHC case IDs, whereby case IDs were separated based on the upper 50th percentile (black line) and lower 50th percentile (gray line) BRF2 mRNA expression. Log-rank p-value = 0.0316.
OS distinctions associated with electrostatic CSs for TCGA-LIHC tumor IGH CDR3s and HCV epitopes
Electrostatic CS calculations and subsequent assignment of case IDs to the upper or lower 50th percentile CS groups, as above, were performed for IGH CDR3-epitope pairs, with the epitopes representing known IG HCV epitopes. As above, CDR3 AA sequences were obtained from adaptive IR recombination read recoveries from TCGA-LIHC WXS or RNAseq files.
In this case, resulting KM analyses indicated that significantly greater OS probabilities correlated with the upper 50th versus the lower 50th percentile CSs for a total of 11 IGH CDR3-epitope pairs (Table 2), with the results for each of these CDR3-epitope pairs consistent for both the WXS- and RNAseq-based CDR3s. Epitope sources for these 11 HCV epitopes are shown in Table 1.
Log-Rank Test p-Values Denoting Significant OS Distinctions Based on Electrostatic CSs for 11 B Cell-Associated HCV Epitopes and IGH CDR3s Obtained from the WXS or RNAseq Files of TCGA-LIHC Dataset
HCV epitopes are referred to by their IEDB epitope ID. In all cases, the upper 50th percentile of CSs represents a case ID set that has a higher OS probability.
CS, complementarity score; OS, overall survival; RNAseq, RNA sequencing; WXS, whole-exome sequence.
In particular, these OS distinctions included CSs calculated with the epitope, HCV*13458, which is the ENDIRV peptide that is part of the nonstructural 5 (NS5) protein of HCV (Table 1 and Fig. 4; WXS-based CDR3s, p = 0.0127; RNAseq-based CDR3s, p = 0.0189). For CSs representing CDR3s from the WXS files, cases in the upper 50th percentile CS group had an estimated 35-month median increase in OS compared with the lower 50th percentile CS group, that is, 56 versus 21 months for the respective median OS times.

IGH CDR3-HCV*13458 electrostatic complementarity and survival probabilities for TCGA-LIHC dataset.
For the groups based on CSs calculated using CDR3s from the RNAseq files, the upper 50th percentile case set did not cross the median survival time point, while the median OS for cases with CSs in the lower 50th percentile was 36 months.
Analysis of the HGSC-BCM HCC dataset indicating increased electrostatic CSs in HCV-positive cases
CSs were calculated for the CDR3s identified through the tumor WXS files from the HGSC-BCM HCC dataset and the 12 HCV epitopes indicated above as correlating with a better outcome for both the WXS- and RNAseq-based CDR3s: 1 TRB-associated epitope and 11 IGH-associated epitopes (Table 2). The Mann–Whitney U analysis demonstrated significantly higher CSs calculated with the TRB CDR3s and epitope, HCV*71871, in HGSC-BCM cases with a positive HCV status compared with cases without a positive HCV status (p = 0.0488) (Fig. 5A; Supplementary Table S11).
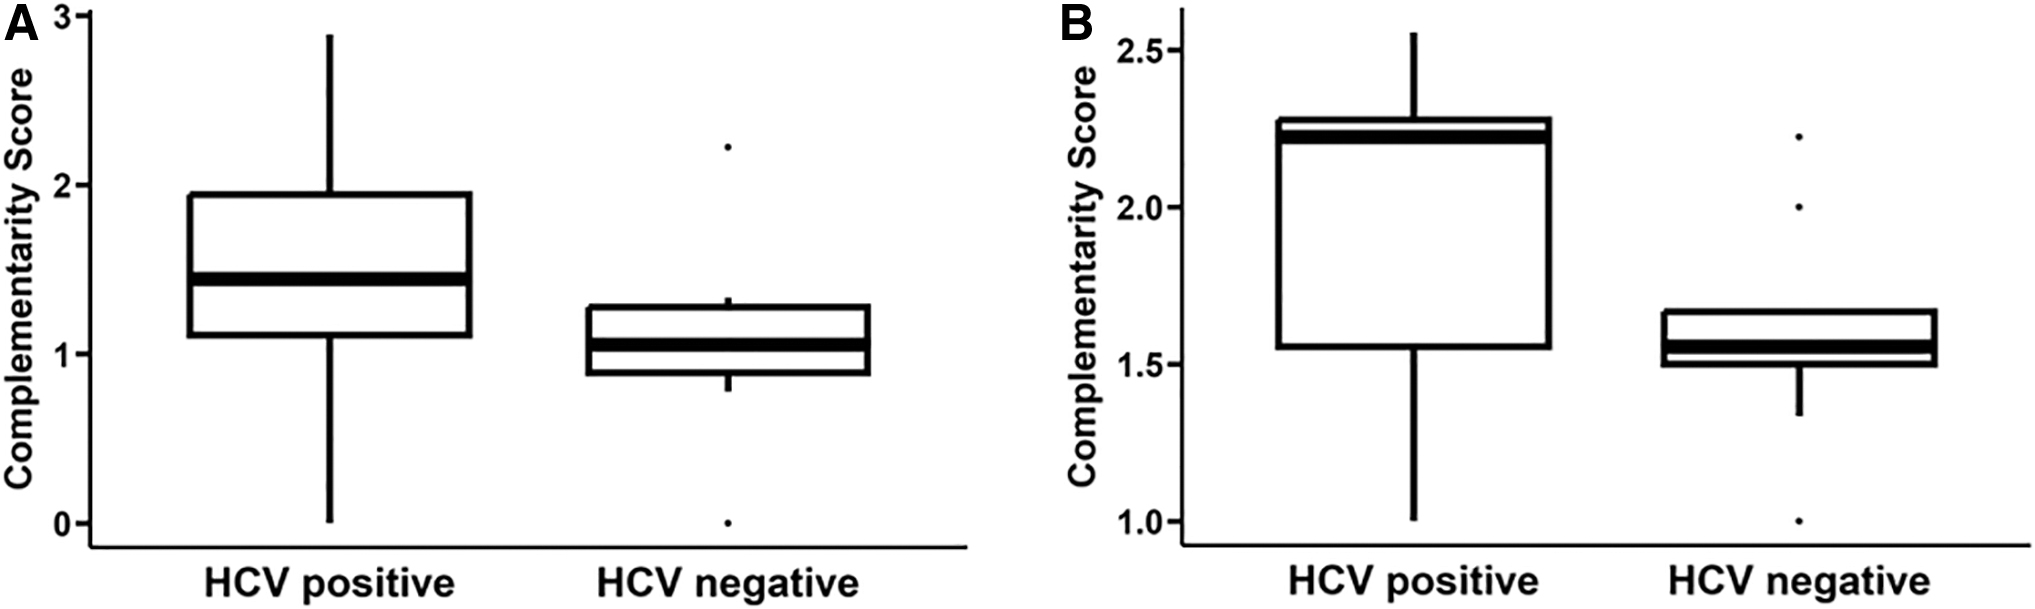
HCV status and CDR3-HCV epitope CSs for the HGSC-BCM HCC cases.
The average CS for HCV cases was 1.492, while the average CS for non-HCV cases was 1.063. In addition, significantly higher CSs were observed, through Mann–Whitney U analysis, for the HCV-positive HGSC-BCM cases versus HCV-negative cases and for cases where CSs were computed using the IGH CDR3s and HCV*13458 epitope, but not for cases of the remaining 10 IGH epitopes (Fig. 5B, p = 0.0599; Table 3).
Mean CSs for 11 B Cell-Associated HCV Epitopes, Originally Identified Through TCGA-LIHC Analyses (Table 2), and IGH CDR3 AA Sequences Obtained from the HGSC-BCM HCC Cases with Positive HCV Status and Negative HCV Status
Bold with italics indicates statistical significance.
Mann–Whitney U test p-values representing a significant difference in the mean CS are indicated, with only HCV*13458 representing a statistically significant increase. HCV epitopes are referred to by their IEDB epitope ID.
HCC, hepatocellular carcinoma; HGSC-BCM, Human Genome Sequencing Center at Baylor College of Medicine.
For the group of IGH CDR3-based CSs calculated with the HCV*13458 epitope, the average CS for HGSC-BCM HCV-infected cases was 1.911 compared with the average CS for cases not infected with HCV, 1.597.
Discussion
The above analyses identified one TCR-associated HCV epitope, HCV*71871, for which greater electrostatic complementarity with TRB CDR3s corresponded with better DFS probabilities, with the TRB CDR3 AA sequences representing TRB recombination reads from tumor WXS and RNAseq files. High TRB CDR3-based CSs representing the HCV*71871 epitope also inversely correlated with the expression of BRF2, a proproliferation marker. Worse DFS was also discovered to be independently associated with HCC cases having higher expression of BRF2.
Specifically, the CS assessment approach thus led to identification of an independent DFS-associated biomarker. Verification of the HCV correspondence with high CSs was further corroborated, as average TRB CDR3-HCV*71871 CSs for HCV-positive cases were greater than CSs for HCV-negative cases (of the HGSC-BCM HCC dataset). Furthermore, this analysis indicated that 11, previously characterized, IG-associated HCV epitopes also represented greater electrostatic complementarity with the IGH CDR3s from both WXS and RNAseq files, where the greater CSs represented cases with increased OS probability.
Additionally, the HCV*13458 epitope represented a higher average CS, with IGH CDR3s from HCV-positive cases, compared with the analogous CSs representing HCV-negative cases. While in studies, such as the work being reported here, multiple testing can be of concern, the use of replicative sets mitigates this concern, particularly through genomic analyses and standards set by Qu et al. (2010).
In addition, such concerns are mitigated by relevant context, as per Manor and Segal (2013). For the cases in this report, a relevant context, among others, is that the epitopes under assessment were previously characterized T and B cell receptor epitopes.
Liver cancer is the seventh most commonly diagnosed cancer, with 905,677 new cases in 2020, and the third leading cause of cancer-related deaths worldwide, with 830,180 deaths in 2020 (Sung et al., 2021). In the United States, an estimated 41,260 new cases will have been diagnosed and 30,520 people will have died from the disease in 2022, making it the fifth leading cause of cancer-related deaths, despite liver cancer only being the twelfth most common cancer (Siegel et al., 2022).
Of liver cancers, HCC is the most common type of primary tumor, accounting for 75–85% of cases (Sung et al., 2021). A well-established, major risk factor for the development of HCC is HCV infection (Axley et al., 2018; de Martel et al., 2015; Di Bisceglie, 1997). In Western and developed countries, chronic hepatitis C is the leading cause of primary HCC (Yang et al., 2022) and accounts for 34% of cases in the United States (de Martel et al., 2015). Worldwide, it is the second leading cause of primary HCC, behind chronic hepatitis B, and contributes to 29.26% of cases (Yang et al., 2022).
Because of this high prevalence, stratification of HCC patients, especially those with HCV, based on the presence of adaptive IRs responsive to HCV epitopes may be useful in providing more precise prognoses and treatments. Our identification of two such highly compelling HCV epitopes (HCV*71871 and HCV*13458) in this study represents a starting point for such clinical goals, although further research would be needed to validate the results presented here.
Besides potential use as biomarkers, adaptive IR-HCV interactions could be the basis of future therapeutic development for HCC. Preclinical studies of chimeric antigen receptor T cell therapy have yielded promising findings when targeting HCC antigens (Rochigneux et al., 2021) such as glypican-3 (Gao et al., 2014; Jiang et al., 2016), and clinical trials are underway to evaluate the efficacy and safety of these types of treatments (Sangro et al., 2021).
HCV TCR-engineered, antigen-reactive T cells have also shown effectiveness in regression of HCV-positive HCC in xenograft tumor models (Spear et al., 2016). Therefore, if clinical significance for HCV*71871 and HCV*13458 can be firmly established, results suggest that they may have value as targets for these types of therapies. CDR3 AA sequences recognizing these two epitopes (HCV*71871 and HCV*13458) identified in this study may also be useful in guiding therapy design.
BRF2 is a gene encoding a 50-kDa subunit of the RNA polymerase III transcription factor complex (TFIII), crucial for recognition of the U6 promoter (Schramm and Hernandez, 2002) that regulates the expression of an snRNA involved in mRNA splicing (Madhani et al., 1990). This transcription factor complex's role in regulating RNA polymerase III makes it a key contributor in regulating cell proliferation, and RNA polymerase III has been determined to be deregulated in cancer (Cabarcas and Schramm, 2011; White, 2005; White, 2004).
In particular, overexpression of BRF2 has been observed in numerous cancers (Cabarcas and Schramm, 2011; Cabarcas et al., 2008), including breast cancer (Garcia et al., 2005; Melchor et al., 2007) and lung squamous cell carcinoma (Lockwood et al., 2010). In addition, silencing of BRF2 has been shown to inhibit growth and metastasis of human lung cancer cells (Bian et al., 2020).
Abnormal expression of TFIII and RNA polymerase III-transcribed genes has been linked to HCC (47), and very recent studies indicate that BRF2 functions as an oncogene in HCC as BRF2 expression was upregulated in HCC cell lines and tissues, while BRF2 depletion suppressed HCC metastasis and invasion (Chang et al., 2023).
These studies align with results in this report, which also implicate a potential role of BRF2 in HCC. Thus, the results of this report expand on the current literature by linking BRF2 expression modulation to an immune response to HCV antigens in HCC, a response that correlates with better DFS.
While this study brings new insight regarding the interplay between the immune system, HCV, and HCC, there are limitations that should be addressed. For example, the above results could be supported with in vitro studies linking the indicated CDR3-epitope pairs, and prospective clinical trials could further support the indicated medical relevance of the results.
However, it should also be kept in mind, particularly with regard to in vitro studies, it remains possible (even likely in many cases) that a complex in vivo interplay of molecules and cells could be indicated by a correlative study, but not detected with an in vitro combination of only two components.
Footnotes
Acknowledgments
The authors thank USF Research Computing; Ms. Corinne Walters for the expert admin assistance in obtaining access to the different databases; and the taxpayers of the State of Florida. J.J.S. was a recipient of a USF RISE grant.
Authors' Contributions
J.J.S. was involved in conceptualization; formal analysis; methodology; visualization; and writing—review and editing. A.C. was involved in methodology and visualization. B.I.C. was involved in conceptualization; software; methodology; and visualization. T.I.H., R.A.E, and K.I.C were involved in methodology and software. G.B. was involved in conceptualization; methodology; project administration; resources; supervision; and writing—review and editing.
Author Disclosure Statement
No competing financial interests exist.
Funding Information
No funding was received for this article.
Supplementary Material
Supplementary Table S1
Supplementary Table S2
Supplementary Table S3
Supplementary Table S4
Supplementary Table S5
Supplementary Table S6
Supplementary Table S7
Supplementary Table S8
Supplementary Table S9
Supplementary Table S10
Supplementary Table S11
References
Supplementary Material
Please find the following supplemental material available below.
For Open Access articles published under a Creative Commons License, all supplemental material carries the same license as the article it is associated with.
For non-Open Access articles published, all supplemental material carries a non-exclusive license, and permission requests for re-use of supplemental material or any part of supplemental material shall be sent directly to the copyright owner as specified in the copyright notice associated with the article.