
Abstract
The hepatitis B virus (HBV) chronic infection goes through different phases, i.e., immune tolerant (IT), immune clearance (IC), and inactive carrier (IN) resulting from the interplay of viral replication and immune response. Although the adaptive immune response is central to viral control, roles of the innate immune cells are less prominent. We explored monocyte transcriptome in these different phases of HBV infection to understand the nature of its involvement and identify unique differentially expressed genes (DEGs) in each phase.
CD14+ peripheral blood monocytes were isolated from patients in the IT, IC, and IN phases and from healthy subjects and their RNA was sequenced. The significant DEGs were studied through gene annotation databases to understand differentially modulated pathways. The DEGs were further validated by qRT-PCR to identify genes that were uniquely expressed in each phase.
It was found that TNFRSF12A was upregulated in all the HBV samples. The IN phase had six uniquely upregulated genes, i.e., PI3, EMP1, STX1A, RRAD, SPINK1, and SNORD3B-2. E2F7 was most consistently downregulated in the IT phase, and in the IC phase, IL23A and PI3 were specifically downregulated. Cut-off values were generated by ROC curve analysis to differentiate between the groups based on their expression levels.
The monocyte functions are majorly suppressed in the IT and IC phases and are, however, somewhat metabolically active in the IN phase.
Introduction
The hepatitis B virus (HBV) infects the liver causing inflammation, which may lead to cirrhosis, hepatocellular carcinoma (HCC), and death in the patient. In 2019, around 316 million people were infected with HBV leading to about 555,000 deaths (World Health Organization 2017). Although an acute infection is generally cleared in adults, 95% of neonates, 20–30% of children below the age of 5, and around 5% of adults develop a chronic infection (Trepo et al., 2014). The chronic hepatitis B (CHB) infection can go through various phases, depending on various viral, host, and environmental factors. These phases can be defined based on the viral and host immune activity as “immune tolerant” phase, defined by high viral and low immune activity; “immune clearance” or “immune active” phase, with high immune and variable viral activity; “immune control” or “inactive” phase with low viral and immune activity (Croagh and Lubel, 2014).
The viral combat is primarily mediated by the adaptive immune branch (Iannacone and Guidotti, 2022). Interestingly, HBV does not directly induce the innate immune response within the liver (Megahed et al., 2020, Suslov et al., 2018). The interaction of HBV with the peripheral blood immune cells is not well elucidated. HBV is, however, found to interact preferentially with the peripheral blood monocytes (Gehring et al., 2013). However, the effect on monocyte function after interaction with HBV is still ambiguous. The direct interaction of monocytes with subviral particles has been reported to result into both proinflammatory (Boltjes et al., 2014, Song et al., 2019) and anti-inflammatory cytokines (Shi et al., 2012, Wang et al., 2013). Increased infiltration of pro-inflammatory monocytes has been shown to correlate with severity of liver injury in the immune-active phase (Zhang et al., 2011), whereas functional defects in the monocyte phenotype has been reported in the immune-tolerant phases (Dey et al., 2022).
Monocytes are modulated during chronic HBV infection, but their exact nature remains unclear. Studying the monocyte transcriptome will provide insights into active pathways and processes during different infection phases, helping to understand their status.
In this study, we studied the monocyte transcriptome at each stage of chronic infection in order to gain an understanding of the functional status of monocytes. Also, we validated the top significant differentially expressed genes (DEGs) by qRT-PCR in order to ascertain the differential gene expression in each phase.
Materials and Methods
Ethics statement
Blood from HBV patients were obtained from the Gastroenterology Department of Dr. Ram Manohar Lohia Hospital, New Delhi, after obtaining informed consent from the patients. The recruitment of healthy volunteers as well as all the experimental work was carried out at National Institute of Immunology (NII). The investigation was approved by the Institutional Human Ethics Committee of Dr. RML hospital and the Institutional Human Ethics Committee of NII with Ethical approval no. IHEC#101/17 for HBV patient blood work and IHEC#131/20 for the investigations on healthy blood.
Overview of methodology
In this cross-sectional study, RNA from CD14+ peripheral blood monocytes of chronic patients in the immune-tolerant (IT), immune-clearance (IC), and inactive carrier (IN) phases was sequenced, and they were validated by qRT-PCR to shortlist significant DEGs (Supplementary Material 1).
In the stage 1, RNA from monocytes from five patients in IT, IC, and healthy control groups were pooled, so that the most abundant DEGs for the group are detected. For the IN group, the top significant DEGs were shortlisted from our previous work (Bhattacharjee et al., 2017) wherein RNA from monocytes from five patients in inactive carrier phase were pooled and sequenced similarly. Also, a single patient sample from each of the three groups (IT, IC, and IN) and a healthy control were sequenced as individual samples, to be able to assess how representative the pooled samples were of its respective immunological phase and to identify genes that were conserved within the group. The DEG profile for each phase was studied through gene annotation databases to identify the differentially active pathways.
Next in the stage 2, qRT-PCR was used to validate and shortlist relevant genes from the transcriptome data. In the first step, DEGs that were consistently expressed within a group were shortlisted. This step was carried out on samples sequenced in stage 1, and a few additional samples were incorporated in each group.
In the second step, the DEGs specific to a group was identified by examining shortlisted DEGs in all the samples and more collected across all the groups and selecting only DEGs that were specifically differentially regulated for a particular group.
By incorporating additional samples at each step, we systematically improved the selection of genes. It also maximizes on the available samples at the given time. The design of the work flow and details of the number of samples used at each stage of the pipeline is summarized in Table 1.
Design of Work Flow
IT, immune-tolerant; IC, immune-clearance; IN, inactive carrier; HC, healthy control; DEGs, differentially expressed genes.
Given below are the essential elements of methods, and detailed step-by-step procedures are given in Supplementary Material 1.
Patient sampling, categorization, and sample processing
The HBV patients were recruited based on their clinical information, as per the inclusion criteria of being HBsAg positive for more than 6 months and exclusion criteria of any co-infections, co-morbidities, and pregnancy. Patients were categorized into different phases of chronic infection according to the guidelines outlined by the American Association for the Study Liver Diseases (Terrault et al., 2018). Consenting, healthy control subjects were recruited based on normal liver enzyme levels and absence of HBV DNA in serum and no recent history of any infections or liver-related illnesses.
CD14+ cells were isolated from blood; the RNA was isolated and the library was prepared with ribosomal RNA depletion. The samples were then sequenced at 150 × 2 bp read length on NovaSeq 6000 machine using SP flow cell (Illumina Inc, USA).
Transcriptome data analysis and qRT-PCR validation
The quality of raw reads was assessed using FastQC (Babraham Institute, UK). This was followed by trimming of poor-quality bases and adapter sequences with Trimmomatic (Bolger et al., 2014) and aligned with the human reference sequence (hg38) using HiSat2 (Kim et al., 2019). After alignment with the reference sequence, the read counts were generated using featureCounts tool (Liao et al., 2014). The DEGs were determined using edgeR software package (Robinson et al., 2010) and were sorted based on logCPM with p-value < 0.05. Heatmaps of the top 100 DEGs of each group was generated using the heatmap.2 package in R software suite. Gene annotations were studied through GeneCodis4 (https://genecodis.genyo.es/) web-based tool (García-Moreno et al., 2021) and DAVID bioinformatics resources 6.8 (Huang da et al., 2009). The top 50 significant DEGs were shortlisted and validated by qRT-PCR to find specific DEGs for each of the IT (pooled), IC (pooled), and IN (single) samples.
The RNASeq data has been uploaded at Gene Expression Omnibus, Series Record GSE217459.
Results
Characteristics of study subjects
The clinical information of the recruited subjects is summarized in Table 2. All the subjects were within similar age range. Healthy controls had normal ALT levels and undetectable HBV DNA in serum. Patients of the IT group had the highest viral load, normal to minimally elevated ALT levels and were positive for HBeAg in serum. Patients in the IC phase had the highest ALT levels, intermediate levels of HBV DNA, and variable presence of HBeAg. The IN patients had normal ALT, low levels of HBV DNA, and absence of HBeAg in serum.
Clinical Characteristics of Enrolled Participants
Viral load was determined by quantitative qPCR assay and ALT was determined by enzymatic assay kit. Age and HBeAg status were obtained from the subjects’ clinical records.
Numbers indicate: Mean ± Standard Deviation.
ALT, alanine aminotransferase; HBeAg, Hepatitis B envelop antigen.
Differential gene expression profile of monocytes in the different phases of chronic hepatitis B infection
RNA from CD14+ monocytes from patients in each of the IT, IC, and IN phases were sequenced along with healthy controls, and the differential expression of genes (compared with healthy) in each of the phases was determined. A total of eight samples were sequenced, i.e., five single patient samples each from acute, IT, IC, IN, and healthy control, and three samples of RNA pooled from five subjects each of the IT, IC and healthy control groups.
The read counts correlated well between the pooled and single samples of healthy but not as much between that of the IT (0.394) and IC (0.45) groups, indicating variations in gene expression patterns of samples within these groups. The number of significant (p < 0.05) downregulated genes were found to be the highest in the IC pooled group, whereas the number of significant upregulated genes was the highest in the IT single followed by IN single samples. Both the pooled samples showed much higher number of DEGs compared with the single samples of the respective phases (Table 3 and Supplementary Material 3 and 4).
The Number of Significant Differentially Expressed Genes (DEGs) Compared with Healthy Controls in Each Sequenced Sample
The number of DEGs generated using the edgeR software package and with a p value of <0.05 for each sample.
DEGs, differentially expressed genes.
The major pathways that the DEGs participate in were checked on GeneCodis4 web-based tool (2021) and DAVID bioinformatics resources 6.8 (Huang da et al., 2009) for studying the most significant annotations associated with each group of the genes, with a focus on biological functions and signaling pathways. The significant upregulated and downregulated pathways from each phase (Supplementary Material 3 — Fig. 1.1 to 1.5) are summarized in Table 4.
Summary of the Most Significant Upregulated and Downregulated Pathways Across Different Phases of Hepatitis B
Total DEGs → Upregulated↑ Downregulated↓.
Pathways identified through KEGG option in GeneCodis 4 web-based tool by checking the significant (p < 0.05) upregulated and downregulated genes, respectively.
DEGs, differentially expressed genes.
There are similarities in expression pattern between the IT pooled and IC pooled samples, whereas the single IT and IC patient transcriptome varies from their respective pooled samples. There is an exceptional downregulation of signaling pathways in the IC pooled samples. Of note is that the hepatitis B response pathway is specifically suppressed in the IC pooled phase.
The gene expression pattern was also studied through heatmaps of the top 100 DEGs of each sample (Fig. 1). The list of genes and proportion of upregulated and downregulated genes varied between the single and pooled samples of the IT and IC phases. The gene expression pattern in the pooled samples (Fig. 1A, i and ii) contrasted starkly with the control and to a lesser extent with the other groups in each heatmap. The heatmaps of the single samples (Fig. 1B, i–iii) showed a greater heterogeneity in expression levels of the DEGs among the different phases.
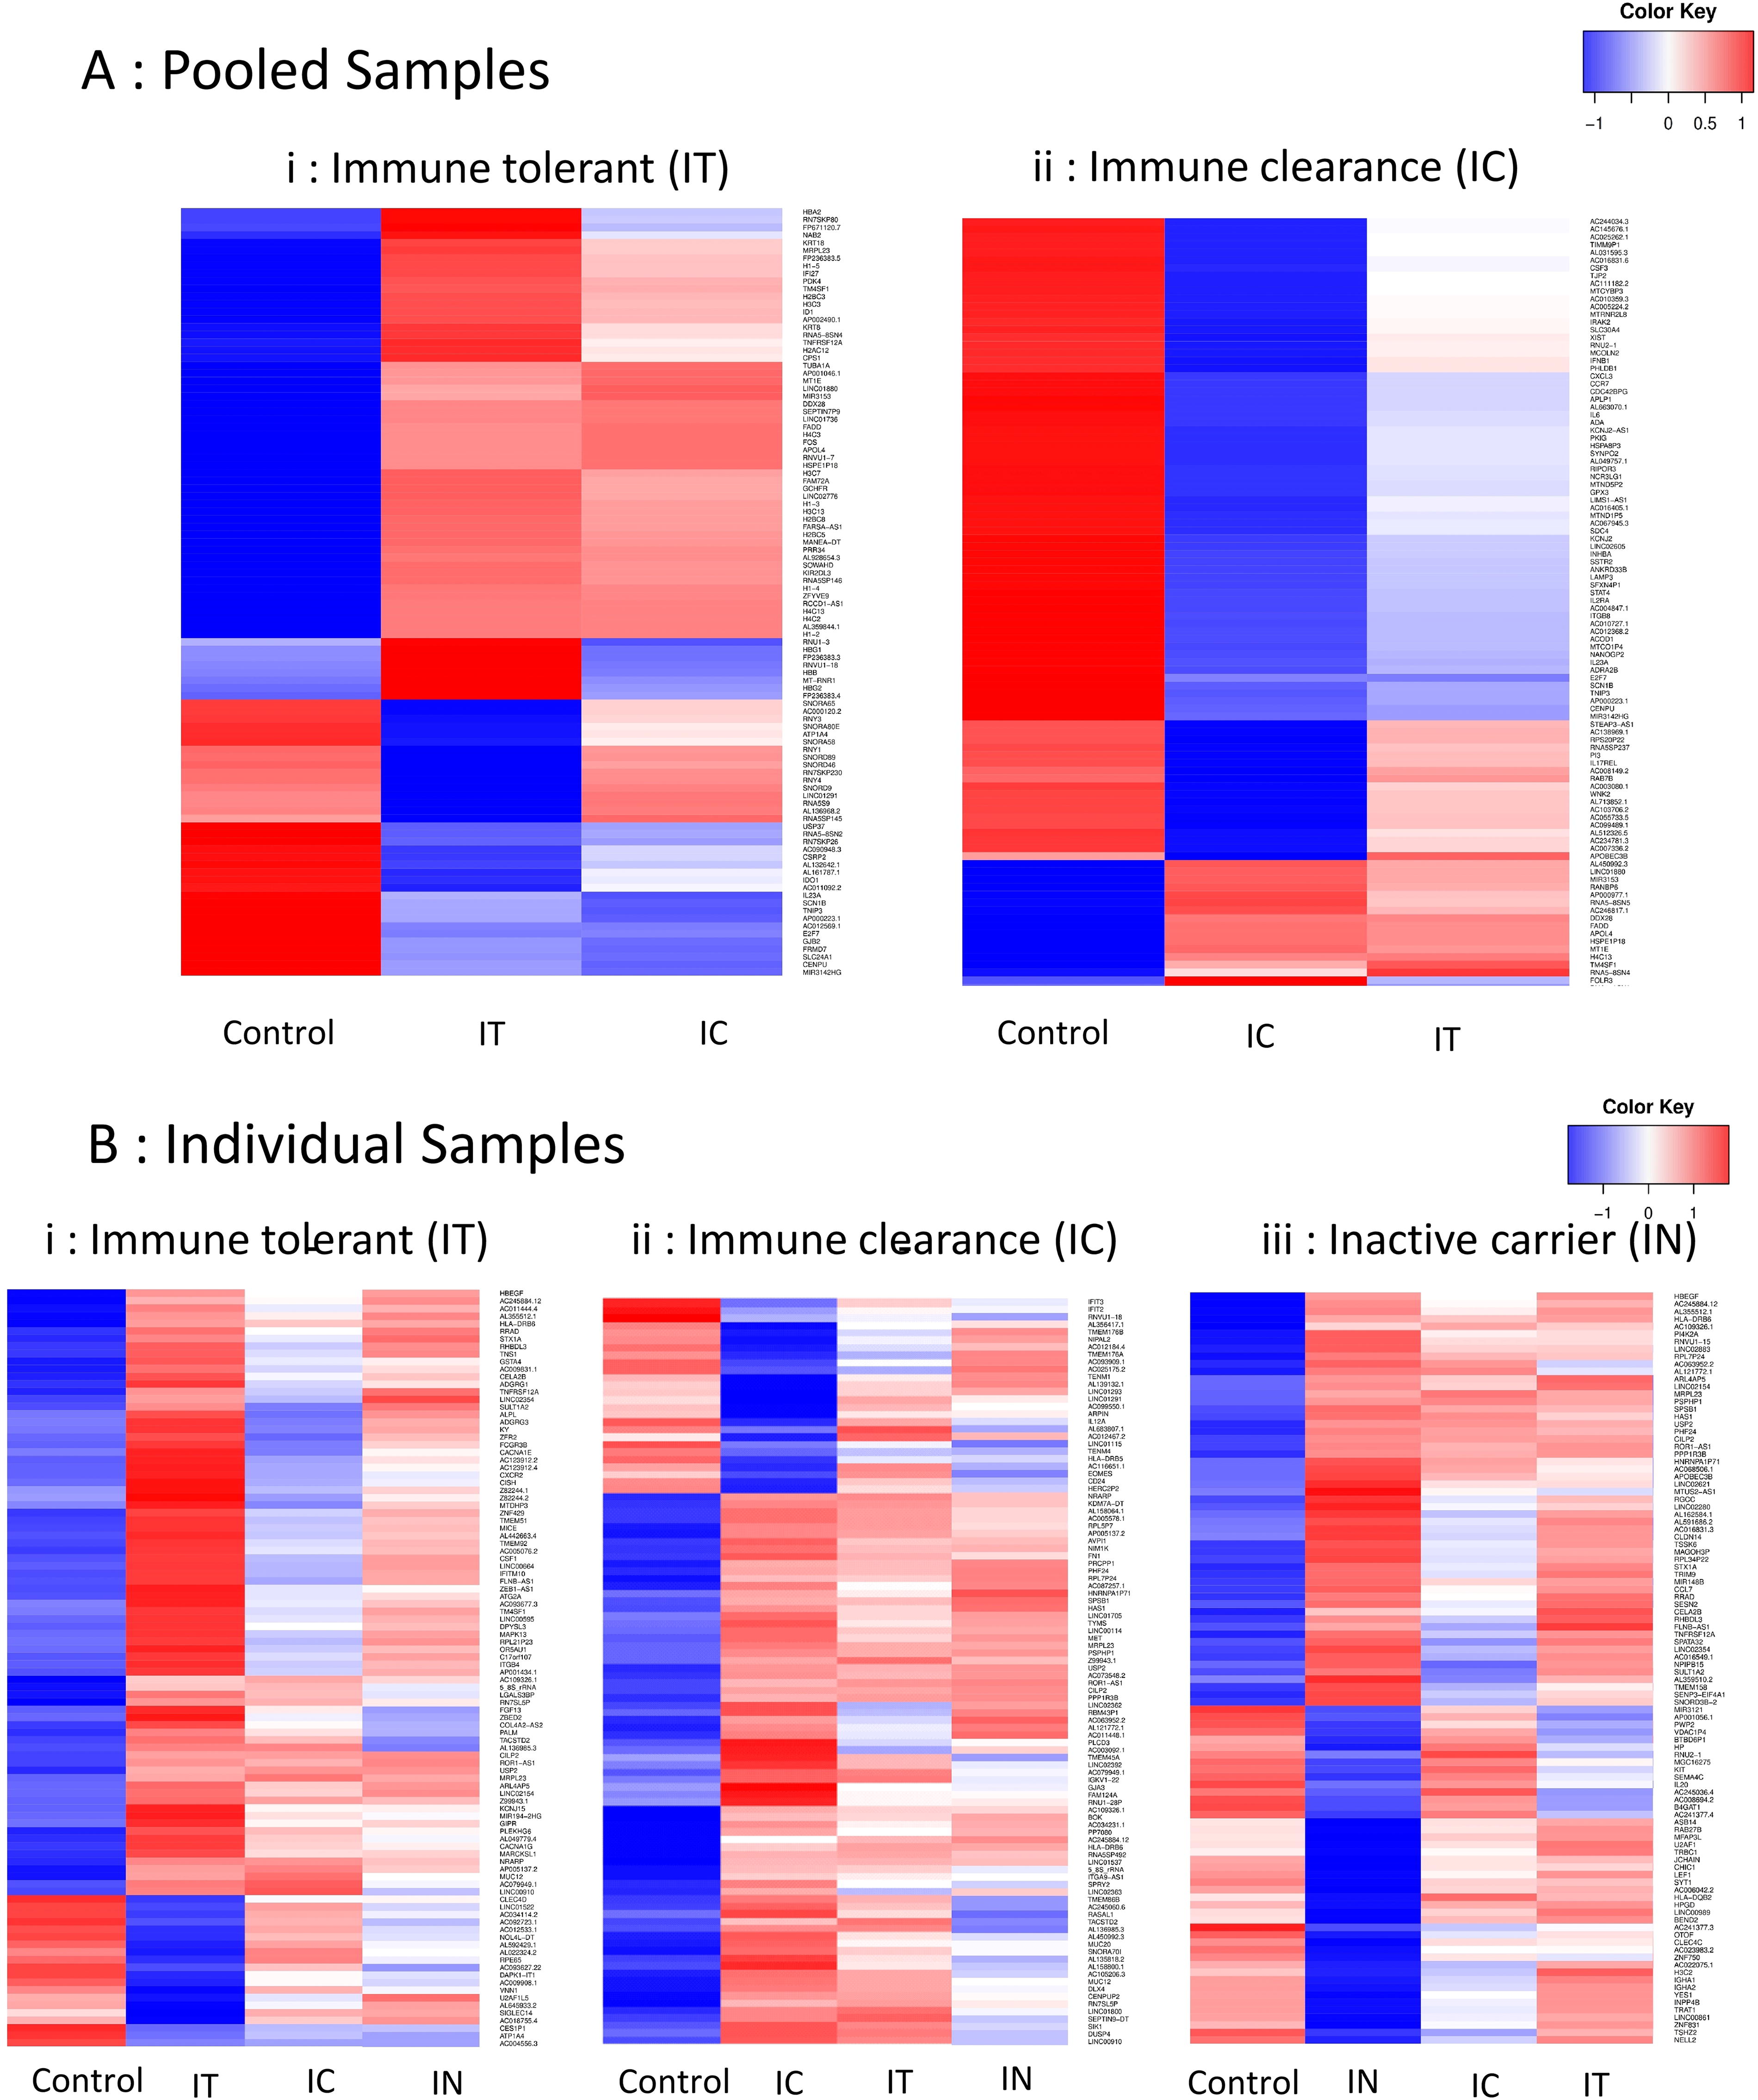
Heatmaps of expression levels of the top 100 DEGs in CD14+ monocytes from each of the
Validation of DEGs in each phase of chronic hepatitis B infection
The expression levels of the top DEGs for each phase were investigated in individual samples by qRT-PCR to identify genes that were specifically expressed in each phase of the infection. As the single and pooled samples of IT and IC showed different lists of top 100 DEGs, a shortlisting strategy was used to finalize genes for PCR validation, as described in the methods (Table 1). In the first stage, the expression levels of the DEGs that were identified from the transcriptome analysis was checked by qRT-PCR in individual patient samples of the respective phase to identify genes that were consistently upregulated (>1.5-fold) or downregulated (<0.5-fold). Hence 21 genes were found for the IT, 9 genes for the IC, and 12 genes for the IN phase. Three genes, i.e., KCNJ2, IL1B, and TNF were found to be consistently downregulated in both IT and IC (Supplementary Material 5 and 6).
In the next stage of qRT-PCR validation, to assess the specificity of expression of the DEGs, the genes that were consistently differentially expressed in a phase were checked for its expression in all patient samples from all three phases (i.e., across 39 samples. i.e., 10 each of IT, IC, and IN, and 9 healthy controls). The specificity check yielded six genes (PI3, EMP1, STX1A, RRAD, SPINK1, and SNORD3B-2) that were uniquely upregulated in the IN phase, 4 genes (MACC1, KRT8, IL23A, and PI3) that were consistently downregulated in the IC phase, and 2 genes (ZBTB10 and E2F7) that were consistently downregulated in both IC and IT phases (Table 5). TNFRSF12A was consistently upregulated in all the samples of all three phases checked (Supplementary Material 6).
Average Fold Change of Genes, Which Were Consistently Differentially Expressed in the Phases of Chronic HBV Infection
The expression levels were normalized based on median values of 9 healthy control samples and calculated by ΔΔCt method. The values are mean Ffold change (log2) ± Std. Dev. A significant upregulation or downregulation of the fold change is highlighted by ↑ indicating a fold change >3 and ↓ indicating a fold change <0.3 on the left of each expression level.
Assessment of distinguishing ability of unique DEGs in each phase of chronic hepatitis B infection
The ability of the genes to distinguish between the studied phases was assessed through ANOVA and by ROC curve analysis. The two-way ANOVA with Tukey’s multiple comparison test shows significance only when there is a distinct difference in the range of the expression levels of all the individual samples of the two groups. It was found that five genes of the IN group, i.e., PI3, EMP1, STX1A, RRAD, and SPINK1, exhibited a distinct upregulation across all the patient samples against the other three groups. In the other genes, however, even though there was a consistent upregulation or downregulation in a group, if few samples of another group also had a similar expression level, then that reduced the distinctness between the two groups (Supplementary Material 7). Hence, the ROC curve analysis, which is a plot of sensitivity versus specificity at different cut-off values, helped to better understand the distinguishing ability of the shortlisted genes (Supplementary Material 7). Table 6 summarizes the best cut-off values of expression levels of each gene to distinguish between the other three groups along with its sensitivity and specificity. The IT group had two consistently downregulated genes, ZBTB10 and E2F7. The IC phase had two genes (PI3 and IL23A) that were distinctly downregulated and could help in distinguishing IC versus healthy as wells as IN and IT. All six genes of IN had significant upregulation.
Cut-off Values of Expression Levels of the Shortlisted Genes and Their Sensitivity and Specificity in Distinguishing between Phases, Determined by ROC Curve Analysis
AUC of >0.8 is considered significant.
AUC, Area under the curve; IT, immune tolerant; IC, immune clearance; IN, Inactive carrier.
Known functions of the specific DEGs
Table 7 lists the names and functions of the shortlisted genes. ZBTB10, E2F7, and MACC1, which are downregulated in IT and IC phases, encode for DNA binding proteins and transcription factors. KRT8, which encodes a structural protein, is also involved in the development of cirrhosis, viral process, and hepatocyte apoptotic process. IL23A, which is involved in the defense response to virus, is downregulated in IT and IC. PI3 codes for a peptidase inhibitor and is downregulated in IC and upregulated in IN. Among the genes upregulated specifically in the IN phase, EMP1 and STX1A code for membrane proteins, RRAD encodes a signaling protein, SPINK1 encodes a peptidase inhibitor, and SNORD3B-2 encodes a small nucleolar RNA. TNFRSF12A, which encodes a receptor for tumor necrosis factor (TNF), was found to be upregulated in all the chronic HBV samples.
Description of the Specific Differentially Expressed Genes
Discussion
Our prior work (Bhattacharjee et al., 2017) indicated differential expression of several genes in the HBV +ve blood, and other reports (Montanari et al., 2022, Zhang et al., 2011) also indicated that there could be differential regulation of monocytes function and genes during the different chronic HBV phases.
A study of the differentially expressed pathways indicate that the immunological functions of monocytes are mostly muted during all the three phases of chronic HBV infection except for the pathways of cancer indicating that mechanisms of carcinogenesis is active throughout chronic infection. The upregulated and downregulated pathways seem to be similar in the IT and IC phases, and it is striking to find the hepatitis B pathway to be specifically downregulated in the pooled IC sample. Some of the metabolic functions start to revive in the inactive carrier phase; however, both the viral and immunological functions are low.
It is interesting to note that the pathway activation pattern is almost inverse between the IC pooled and IN samples, indicating a suppression of monocyte activity in the immune active phase and a revival in the inactive phase. A recent study that investigated the monocyte subsets in chronic HBV infection found functional defects mostly in the immune tolerant and HBeAg positive and negative phases compared with healthy controls and inactive carriers (Dey et al., 2022). Another observation from a study on the intrahepatic expression of innate immune genes found that these genes were repressed in HBeAg positive patients with higher viral load, but there was a relief in repression of genes belonging to multiple pathways in patients who were HBeAg negative and with lower viral load (Lebosse et al., 2017). Such a pattern of functional attenuation of the monocytes could be speculated to be due to viral proteins (Deng et al., 2021, Luo et al., 2013, Wang et al., 2019a) as a means of immune-evasion or could also be attributed to host factors like T-cells (Inoue et al., 2014) and Tregs (Tiemessen et al., 2007) to control hyperinflammation and needs further studies.
The heat maps of the top 100 DEGs (Fig. 1) also reveal a similar expression pattern between the IT pooled and IC pooled groups, whereas only few genes seemed differentially regulated between these two groups. The individual samples showed a greater variability between the phases as well as from their respective pooled sample.
On investigating the expression levels of the significant DEGs in each of these individual samples through qRT-PCR, few genes had a consistent expression level in each of the phase. The IN phase had the most uniquely and consistently upregulated genes that could help identifying it with high specificity and sensitivity. Monocytes produce IL23A under infection and inflammation conditions (Aschenbrenner et al., 2021, Aschenbrenner et al., 2020, Geyer et al., 2021, Nakamizo et al., 2021), and it is only in the IN phase that this gene was found to be upregulated. This further supports that there is higher metabolic activity of the monocytes in the inactive carrier phase compared with the IT and IC phase.
Next, the interference in E2F7 expression has been reported to block monocytic differentiation in acute myeloid leukemia cells (Salvatori et al., 2012), and depletion of ZBTB10 in murine cDC1 shuts down its immune responses by suppression of NF-κB-related genes (Smita et al., 2021); we see a downregulation of these genes in the IT and IC phase, further indicating toward the suppression of monocyte activity in these phases.
Interestingly, one gene, i.e., PI3 or peptidase inhibitor 3 was uniquely downregulated in IC; it prevents excessive protease damage during inflammation (Verrier et al., 2012) and is reported to be downregulated with the development of intense inflammatory response in acute respiratory distress syndrome (Wang et al., 2008). It is similarly downregulated in the inflammatory IC phase in our study, whereas its expression levels were high in the noninflammatory IN phase.
The expression of TNFRSF12A has been reported to be high in HCC tissues (Wang et al., 2017, Wang et al., 2019b) and liver biopsies from ALF patients (Li et al., 2022), and it was interesting to note upregulation of this gene in monocytes in all samples across the three phases of chronic HBV in our study too.
We carried out ROC analysis of the expression levels of these genes to check the sensitivity and specificity levels and generated cut-off values that could help placing the sample into one of the phases. For example, as can be seen from the table of cut-off values (Table 7), an expression level between 0.095 and 0.447 for the E2F7 gene will distinguish the sample to be in IT phase and an expression level less that 0.095 will place the sample in IC phase. By integrating a comprehensive set of Ct values alongside typical biochemical parameters, it may be possible to achieve more accurate and effective monitoring of HBV infection progression. More samples from each phase would confirm the robustness of these genes as biomarkers as a significant challenge of this study was the limited sample size from a single cohort of chronic HBV patients.
Footnotes
Acknowledgments
Guidance by Dr. Vinod Scaria and Dr. Disha Sharma, Institute of Genomics and Integrative Biology, New Delhi, for bioinformatic analysis is gratefully acknowledged. In the initial phase of this study, Dr. Jashdeep Bhattacharjee investigated a few samples of chronic hepatitis B virus-infected carriers. The authors are grateful to all the patients and healthy volunteers for their participation in the study.
Authors’ Contributions
P.S. and P.U. conceived and designed the study and analyzed data. P.S., AM., K.V.M., and K.J. conducted experiment. P.S. and A.M. did bioinformatic analysis. HBV patients were diagnosed and enrolled by V.B. Healthy control/buffy coat collection was supervised by K.C. The article was written and edited by P.S. and P.U. All authors read and approved the final article.
Author Disclosure Statement
The authors have no relevant financial or nonfinancial interests to disclose.
Funding Information
Supplementary Material
Supplementary Material S1
Supplementary Material S2
Supplementary Material S3
Supplementary Material S4
Supplementary Material S5
Supplementary Material S6
Supplementary Material S7
References
Supplementary Material
Please find the following supplemental material available below.
For Open Access articles published under a Creative Commons License, all supplemental material carries the same license as the article it is associated with.
For non-Open Access articles published, all supplemental material carries a non-exclusive license, and permission requests for re-use of supplemental material or any part of supplemental material shall be sent directly to the copyright owner as specified in the copyright notice associated with the article.