
Abstract
Human pegivirus (HPgV) appears to alter the prognosis of HIV disease by modulating T cell homeostasis, chemokine/cytokine production, and T cell activation. In this study, we evaluated if HPgV had any ‘favorable’ impact on the quantity and quality of T cells in HIV-infected individuals. T cell subsets such as CD4lo, CD4hi, and CD8+ T cells, CD4+ MAIT cells, CD8+ MAIT cells, follicular helper T (TFH) cells, and follicular cytotoxic T (TFC) cells were characterized based on the expression of markers associated with immune activation (CD69, ICOS), proliferation (ki67), cytokine production (TNF-α, IFN-γ), and exhaustion (PD-1). HIV+HPgV+ individuals had lower transaminase SGOT (liver) and GGT (biliary) in the plasma than those who were HPgV−. HIV/HPgV coinfection was significantly associated with increased absolute CD4+ T cell counts. HIV+HPgV+ and HIV+HPgV− individuals had highly activated T cell subsets with high expression of CD69 and ICOS on bulk CD4+ and CD8+ T cells, CD4+ MAIT cells, CD8+ MAIT cells, and CXCR5+CD4+ T cells and CXCR5+CD8+ T cells compared with healthy controls. Irrespective of immune activation markers, these cells also displayed higher levels of PD-1 on CD4+ T and CD8+ T cells . Exploring effector functionality based on mitogen stimulation demonstrated increased cytokine production by CD4+ MAIT and CD8+ MAIT cells. Decrease in absolute CD4+ T cell counts correlated positively with intracellular IFN-γ levels by CD4lo T cells, whereas increase of the same correlated negatively with TNF-α in the CD4lo T cells of HIV+HPgV+ individuals. HIV/HPgV coinfected individuals display functional CD4+ and CD8+ MAIT, TFH, and TFC cells irrespective of PD-1 expression.
Introduction
Human immunodeficiency virus (HIV) is a lymphotropic virus that specifically binds CD4 and CCR5/CXCR4 coreceptors to infect T helper cells (Paiardini and Müller-Trutwin, 2013). HIV infection results in exuberant virus replication leading to destruction of CD4+ T cells (Rajasuriar et al., 2013). The antiviral activity of mucosal-associated invariant T (MAIT) cells, a subset of innate-like T cells that fights HIV, is partially mediated through CCL3 (MIP-1α), CCL4 (MIP-1β), and CCL5 (RANTES) (Phetsouphanh et al., 2021). During acute HIV infection, circulating MAIT cells expand before undergoing exhaustion (Khuzwayo et al., 2021). Furthermore, majority of HIV replication occurs in secondary lymphoid tissues within follicles and germinal centers (GC), impairing follicular helper T (TFH) cells (Paiardini and Müller-Trutwin, 2013). GC-TFH cells contribute to the generation of broadly HIV neutralizing antibodies (nAb) (Chakhtoura et al., 2021). Likewise, follicular cytotoxic T (TFC) cells present in the peripheral blood during chronic HIV infection release cytokines and cytolytic molecules (Perdomo-Celis et al., 2017). GC-TFH cells are often unable to provide adequate ‘help’ to GC-B cells, and therefore, the humoral responses are often ineffective and favor the establishment of chronic HIV infection.
The human pegivirus (HPgV-1), formerly known as hepatitis G virus (HGV) or the GB virus C (GBV-C), is a positive-sense, single-stranded RNA virus belonging to the family Flaviviridae and genus Pegivirus (Stapleton et al., 2011). Several lines of evidence suggest that HPgV offers a beneficial effect by slowing down HIV-1 disease progression (Heringlake et al., 1998; Lefrère et al., 1999; Nunnari et al., 2003; Sahni et al., 2014; Schwarze-Zander et al., 2012; Tillmann et al., 2001). HPgV appears to impact the natural course of HIV disease (Polgreen et al., 2003), and mortality among people with HIV infection was altered by HPgV infection (Vahidnia et al., 2012). HPgV viral load positively correlates with CD4+ T cell frequency and negatively with HIV plasma viral load (PVL) (Yu et al., 2022). Furthermore, a dampened HIV disease progression reportedly occurs in the absence of HPgV viremia (N’Guessan et al., 2017). It has also been hypothesized that the microenvironment, for example, cytokine levels/profiles, in which HIV replicates may be affected by HPgV, which causes reduction in systemic immune activation, leading to dampened HIV replication and disease progression (Bhattarai et al., 2012; McBrien et al., 2018; Rodríguez et al., 2014).
Immune activation, senescence, and exhaustion have seldom been described in the context of HIV/HPgV coinfection. Surging HIV PVL, deteriorating CD8+ T cell functions, disease progression, and declining absolute CD4+ T cell counts are positively correlated with PD-1 expression on HIV-specific CD8+ T cells (McBrien et al., 2018). In this study, we investigated the frequency of circulating CD4+lo, CD4+hi, CD8+ T cells, CD4+ MAIT, CD8+ MAIT, TFH, and TFC cells in chronic HIV-infected individuals who were seropositive and seronegative for HPgV and determined the phenotypic and functional markers (PD-1, ICOS, CD69, CD27, TNF-α, IFN-γ, and ki67) on the aforesaid cell phenotypes in the representative study participants.
Material and Methods
Study approval
The study was performed following the approval of the study protocols involving human subjects by the Institutional Ethics Committee (IEC) of the Government Medical College and Hospitals, Theni, India (Ref. No. 2544/ME1/18). Institutional Biosafety Committee (IBSC) approval from the host institution was also secured (CUTN IBSC Approval—Ref. No.: CUTN/SLS/1st IBSC/2020/04). The study was carried out in accordance with the International Conference on Harmonization Guidelines and the Declaration of Helsinki. All the human subjects were adults, and written informed consents were obtained. Approval of the informed consent form signed by the participant was obtained from the IEC.
HIV-1 diagnosis
Twenty HIV-infected adults (≥18 years of age) were enrolled during September 2021. Diagnosis of HIV-1 infection was carried out based on the HIV testing strategy of the National AIDS Control Organization (NACO), Government of India guidelines using the following rapid testing kits: CombAIDS-RS (Arkray Healthcare, Mumbai, India), VoXpress HIV-1/2 (VoxturBio, Mumbai, India), and Meriscreen HIV 1–2 WB (Merillife, Vapi, India) for detection of antibodies specific to gp41 and gp120 of HIV-1 and gp36 of HIV-2 in human serum, plasma, and whole blood, as per the instructions of the manufacturers. All the HIV-infected participants were on highly active antiretroviral therapy (HAART) at the time of enrolment into the study. For absolute CD4+ T cell enumeration, 2 mL of whole blood was collected in K2EDTA tubes and processed within 6 h. The Partec 2-color flow cytometer (Sysmex, Norderstedt, Germany) anti-CD45-PE-Cy5 (Cat. No. 05–8405-02) and anti-CD4-PE (Cat. No. 05–8405-01) fluorochrome-tagged antibodies were used for immunophenotyping as per the manufacturer’s instructions.
HPgV serosurveillance
Serosurveillance of HPgV was estimated by measuring anti-HPgV IgM and IgG (anti‐HPgV IgM and IgG) using commercially available ELISA kits (Kinesis Dx, CA, USA. Cat. No. K12-1605 and Cat. No. K12-1599) in the HIV-infected patients using an ELISA multimode microplate reader (Bio-Rad, Hercules, USA).
Peripheral blood mononuclear cells
Ten milliliters of venous whole blood was collected by venipuncture in lithium heparin BD Vacutainer tubes (BD Biosciences, Franklin Lakes, USA). Peripheral blood mononuclear cells (PBMCs) were extracted by SepMateTM Density gradient centrifugation (Stem Cell Technologies, Vancouver, Canada) overlay. Cell viability was determined by 0.4% Trypan blue vital staining. Purified PBMCs were added to BambankerTM serum-free cell freezing medium (Nippon Genetics Europe GmbH, Duren, Germany) and stored at −80°C. PBMCs were thawed in a water bath at 37°C before performing the immunophenotyping assays.
Flow cytometry
Polyparametric immunophenotyping
All antibodies were purchased from BD Pharmingen™ (BD Biosciences, Franklin Lakes, USA) and BioLegend (San Diego, California, USA). Immunostaining was performed with one panel each for MAIT cells, follicular T cells (TFH and TFC), and functional markers, where the MAIT cell panel included allophycocyanin H7 (APC-H7)-conjugated anti-CD3, brilliant violet 510 (BV510) anti-CD4, fluorescein isothiocyanate (FITC)-conjugated anti-CD8, phycoerythrin (PE)-conjugated TCR iVα7.2, brilliant violet 421 (BV421)-conjugated anti-CD56, peridinin chlorophyll protein (PerCP)-Cy5.5-conjugated anti-CD278, Alexa647 anti-PD-1, and PECy7 anti-CD69. The TFH panel was stained with APC-H7–conjugated anti-CD3, BV421-conjugated anti-CXCR5, Alexa647-conjugated anti-PD-1, BB515-conjugated anti-CD278, and PECy7-conjugated anti-CD27 antibodies.
Intracellular cytokine staining
Mononuclear cells were incubated with PMA (50 ng/mL) and ionomycin (500 ng/mL) or cultured in RPMI containing 10% FBS (R10) alone. Samples were incubated at a concentration of 10 μg/mL, and GolgiPlug (brefeldin A) and GolgiStop (monensin) were included at 10 μg/mL. Samples were incubated overnight at 37°C in 5% CO2 and then permeabilized using Fix & Perm reagents (BD Biosciences) and stained intracellularly with anti-IFN-γ (clone B27) and anti-TNF-α (clone Mab11). At the end of stimulation, cells were washed once with FACS wash (PBS containing 2% [vol/vol] FBS and 0.25% of sodium azide) and surface stained with anti-CD3, anti-TCR7.2 (3C10), anti-ki67 (B56), anti-CD8 (SK1), and anti-CD4 (OKT4) cell stain at room temperature for 30 min. Cells were then fixed with Cytofix/Cytoperm (BD Pharmingen) for 20 min at 4°C and washed with Perm wash (BD Pharmingen). Cells were then incubated for 30 min at 4°C with antibodies specific to IFN-γ and TNF-α, washed once with Perm wash and once with FACS wash, and resuspended in PBS containing 1% formalin. Cells were acquired on a BD FACSCanto II Immunocytometric system. FlowJo for Windows, Ver.10.0.8 (FlowJo LLC, Ashland, OR, USA) was used to perform the analysis. At least 100,000 events were acquired for each sample.
Statistical Analysis
We examined the percentages and expression of biomarkers on distinct subsets of T cells, MAIT cells, and TFH cells between the study groups. For multiple group comparisons, categorical variables were examined using the Chi-square test of Fisher’s exact test, while continuous variables were tested using nonparametric Kruskal–Wallis Test. If the p values were <0.05, three-way comparisons were made between the groups using the Mann–Whitney Test. The association between surface and functional markers and PVL was assessed using the linear regression model. *p < 0.05, **<0.01, ***<0.001, and ****<0.0001 were used to determine significance. GraphPad Prism Ver.6.0 (GraphPad, La Jolla, USA) was used to perform all the analyses. Linear regression was used to determine the association between cellular markers and plasma HIV viral load, as well as disease progression measured as absolute CD4+ T cell counts.
Results
Clinicodemographic characteristics of HIV+HPgV+ and HIV+HPgV− individuals
Our cohort included HIV-infected individuals (n = 7) who were on HAART with a median age of 34 (32–42) years and HIV+HPgV+ individuals (n = 13) with a median age of 45 (28–62.5) years. Although not significant, the HIV PVL was lower in HIV+HPgV+ patients than their HPgV− counterparts. Furthermore, HIV+HPgV+ individuals had lower levels of liver transaminases serum glutamic oxaloacetic transaminase (SGOT) (p = 0.036) and biliary gamma-glutamyl transferase (GGT) (p < 0.0001) than those who were HPgV− (Table 1).
HIV-HPgV Cohort Characteristics
All data reported as median (IQR) unless specified. IQR, interquartile range; HIV, human immunodeficiency virus; HPgV, human pegivirus; HC, healthy control; SGOT, serum glutamic oxaloacetic transaminase; SGPT, serum glutamic-pyruvic transaminase; GGT, gamma-glutamyl transferase; ALP, alkaline phosphatase. *p < 0.05; † The median (IQR) was calculated based on HIV+ and HIV+HPgV+ patients only, (n = 20).
Next, to understand the impact of HPgV on HIV disease, two regression analyses were performed where the outcome variable was HIV PVL and absolute CD4+ T cell counts, respectively. For the second regression analysis, age and nadir CD4+ T cell counts were adjusted as they have been shown to be a predictor of absolute CD4+ T cell counts in a previous study (Yong et al., 2016). We found that the HPgV serostatus was not associated with HIV PVL. However, HIV/HPgV coinfection was significantly associated with increased absolute CD4+ T cell counts by 27.9 (95% CI = 4.4–51.3; p = 0.02) (Table 2). This finding is in line with a previous report indicating that HPgV infection did dampen HIV disease progression.
HPgV Serostatus and Its Impact on HIV Disease Progression
To understand the impact of HPgV on HIV disease, two regression analyses were performed where the outcome variable was HIV PVL and absolute CD4+ T cell counts. For the second regression analysis, age and nadir CD4+ T cell counts were adjusted. PVL, plasma viral load.
HIV-infected individuals irrespective of HPgV serostatus had increased abundance of activated CD4+ MAIT cells and TFH cells
To find out the differences in the immune profile between the HIV+ and HIV+HPgV+, we explored the frequency of CD4lo T cells, CD4hi T cells, CD4+ MAIT cells, and TFH cells among individuals who were HIV+, HIV+HPgV+, and HCs by multicolor flow cytometry. The gating strategy used to delineate the CD4hi T cell, CD4lo T cell, and CD8+ T cell phenotypes is presented in Figure 1. HIV+HPgV− patients had significantly higher CD8+ MAIT (p < 0.01) and TFH (p < 0.01) expressions compared with HCs (Fig. 1B). HIV+HPgV+ patients also had a significantly higher CD8+ MAIT (p < 0.0001) and TFH (p < 0.01) levels compared with HCs. CD4lo, CD4hi, and CD8+, MAIT, CD4+ MAIT, and TFC among the groups showed negligible significance (Fig. 1B). Then, we assessed the frequency of CD69, ICOS, and PD-1 expression on total CD4hi T cells, CD4lo T cells, and CD8+ T cells in the groups with proper FMO controls. Increase of CD69, ICOS, and PD-1 was evident on T cells of HIV+HPgV+ than in HIV+HPgV− and HCs (Fig. 2A and 2B). Together, our findings showed that T cells of HIV+HPgV+ expressed higher levels of markers associated with activation plus the expression of PD-1.

Gating strategy to delineate the CD4hi T cell, CD4lo T cell, and CD8+ T cell phenotypes.

Percentage and expression levels (log MFI) of CD69, ICOS, and PD-1 on T cells.
HIV+HPgV+ individuals showed increased expression of activation markers on CD8+ MAIT and Tfc cells
Next, we looked at the expression of activation markers in the CD8 compartment, namely, total CD8+ T cells, CD8+ MAIT cells, and CXCR5+CD8+ T cells (TFC). Both HIV+HPgV+ and HIV+HPgV− individuals had higher levels of CD69 and ICOS on total CD8+ T cells and on MAIT cells but not on CXCR5+CD8+ T cells. Then, we compared the expression of exhaustion marker PD-1 across the study groups. Our results indicated that PD-1 expression was highly upregulated among HIV-infected individuals on total CD8+ T cells, total CD8+ MAIT cells, and CXCR5+CD8+ T cells. These observations indicated that unlike the CD4+ T cell subsets, the CD8+ T subsets in HIV infected expressed both activation and exhaustion markers on them (Fig. 3A and 3C).
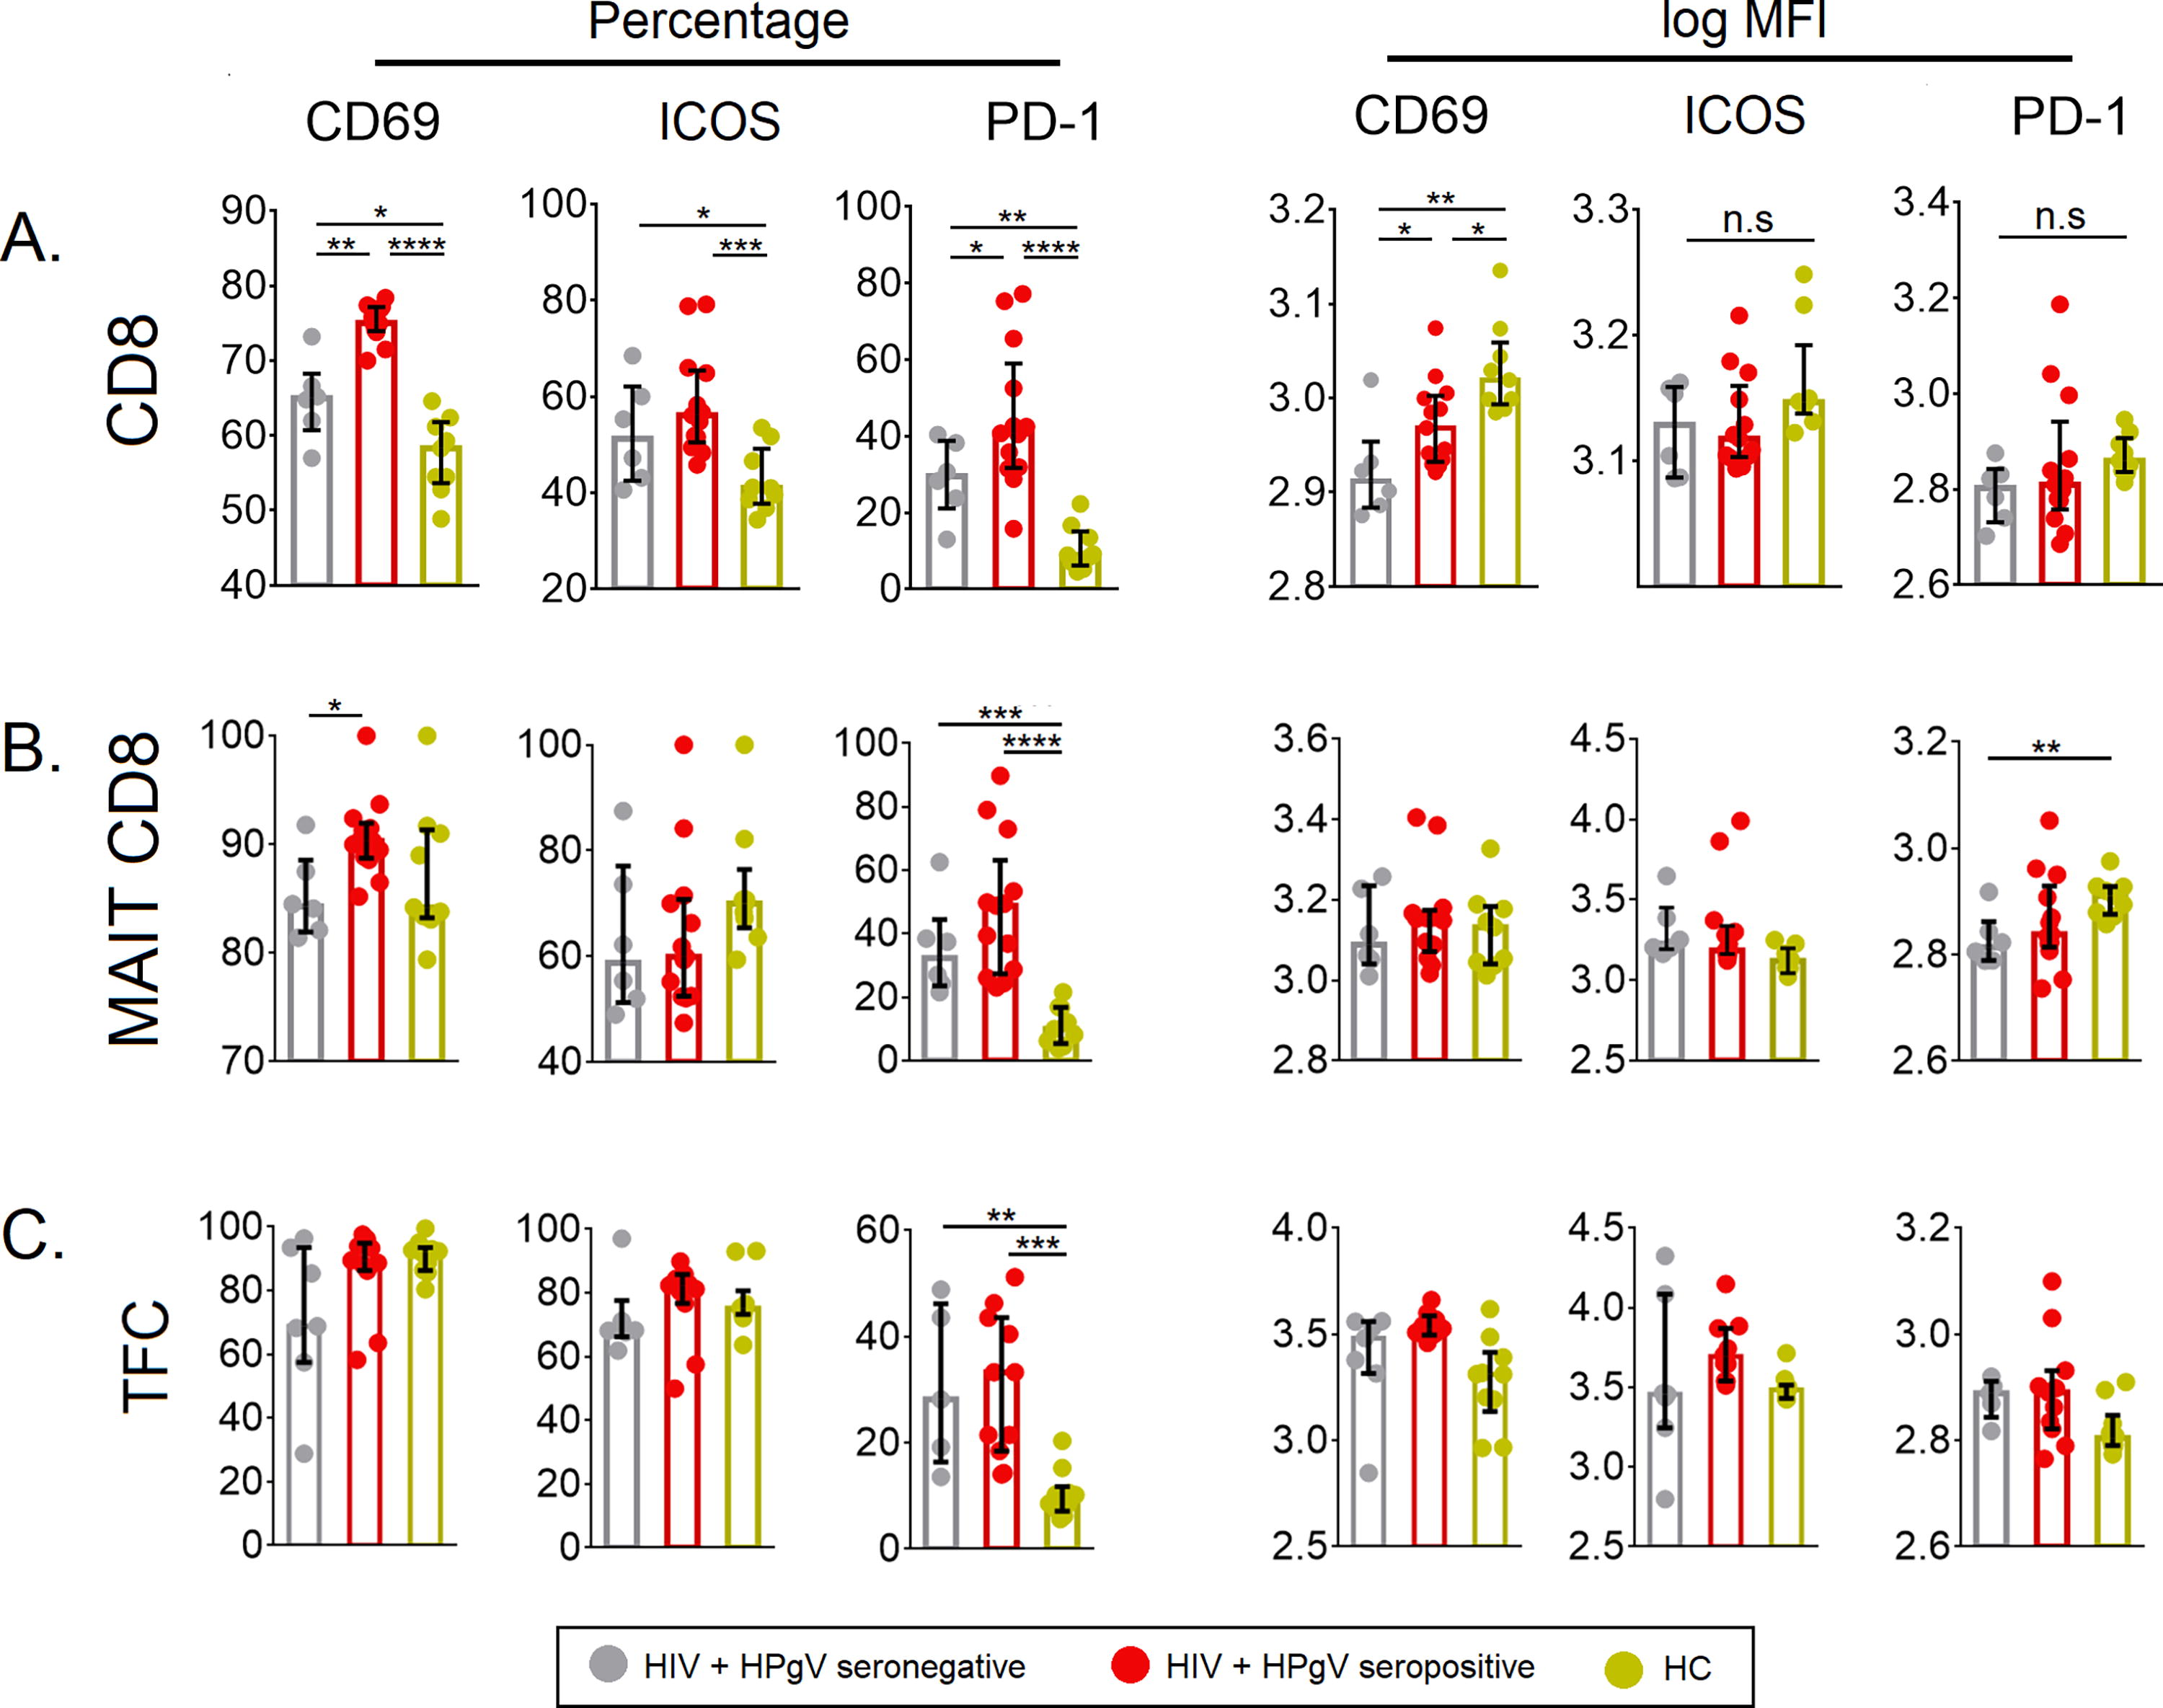
Percentage and expression levels (log MFI) of CD69, ICOS, and PD-1.
HIV+HPgV− and HIV+HPgV− individuals had elevated levels of cytokine-producing T cells
To understand the functionality of the T cell subsets, we stimulated PBMCs with PMA/ionomycin overnight and examined for their intracellular TNF-α- and IFN-γ-producing abilities along with ki67, the proliferation marker in the different T cell subsets, and compared their levels with HCs. We found that in comparison with HCs, there was a relative increase in the number of intracellular TNF-α and IFN-γ-producing CD4+ T cells, as well as CD8+ T cells, in both the HIV+HPgV− and HIV+HPgV+ individuals compared to HCs (Fig. 4A and 4B). The levels of ki67 revealed a relative increase among both HIV+HPgV− and HIV+HPgV+ individuals, except for the CD4+ MAIT cell population (Fig. 4B).
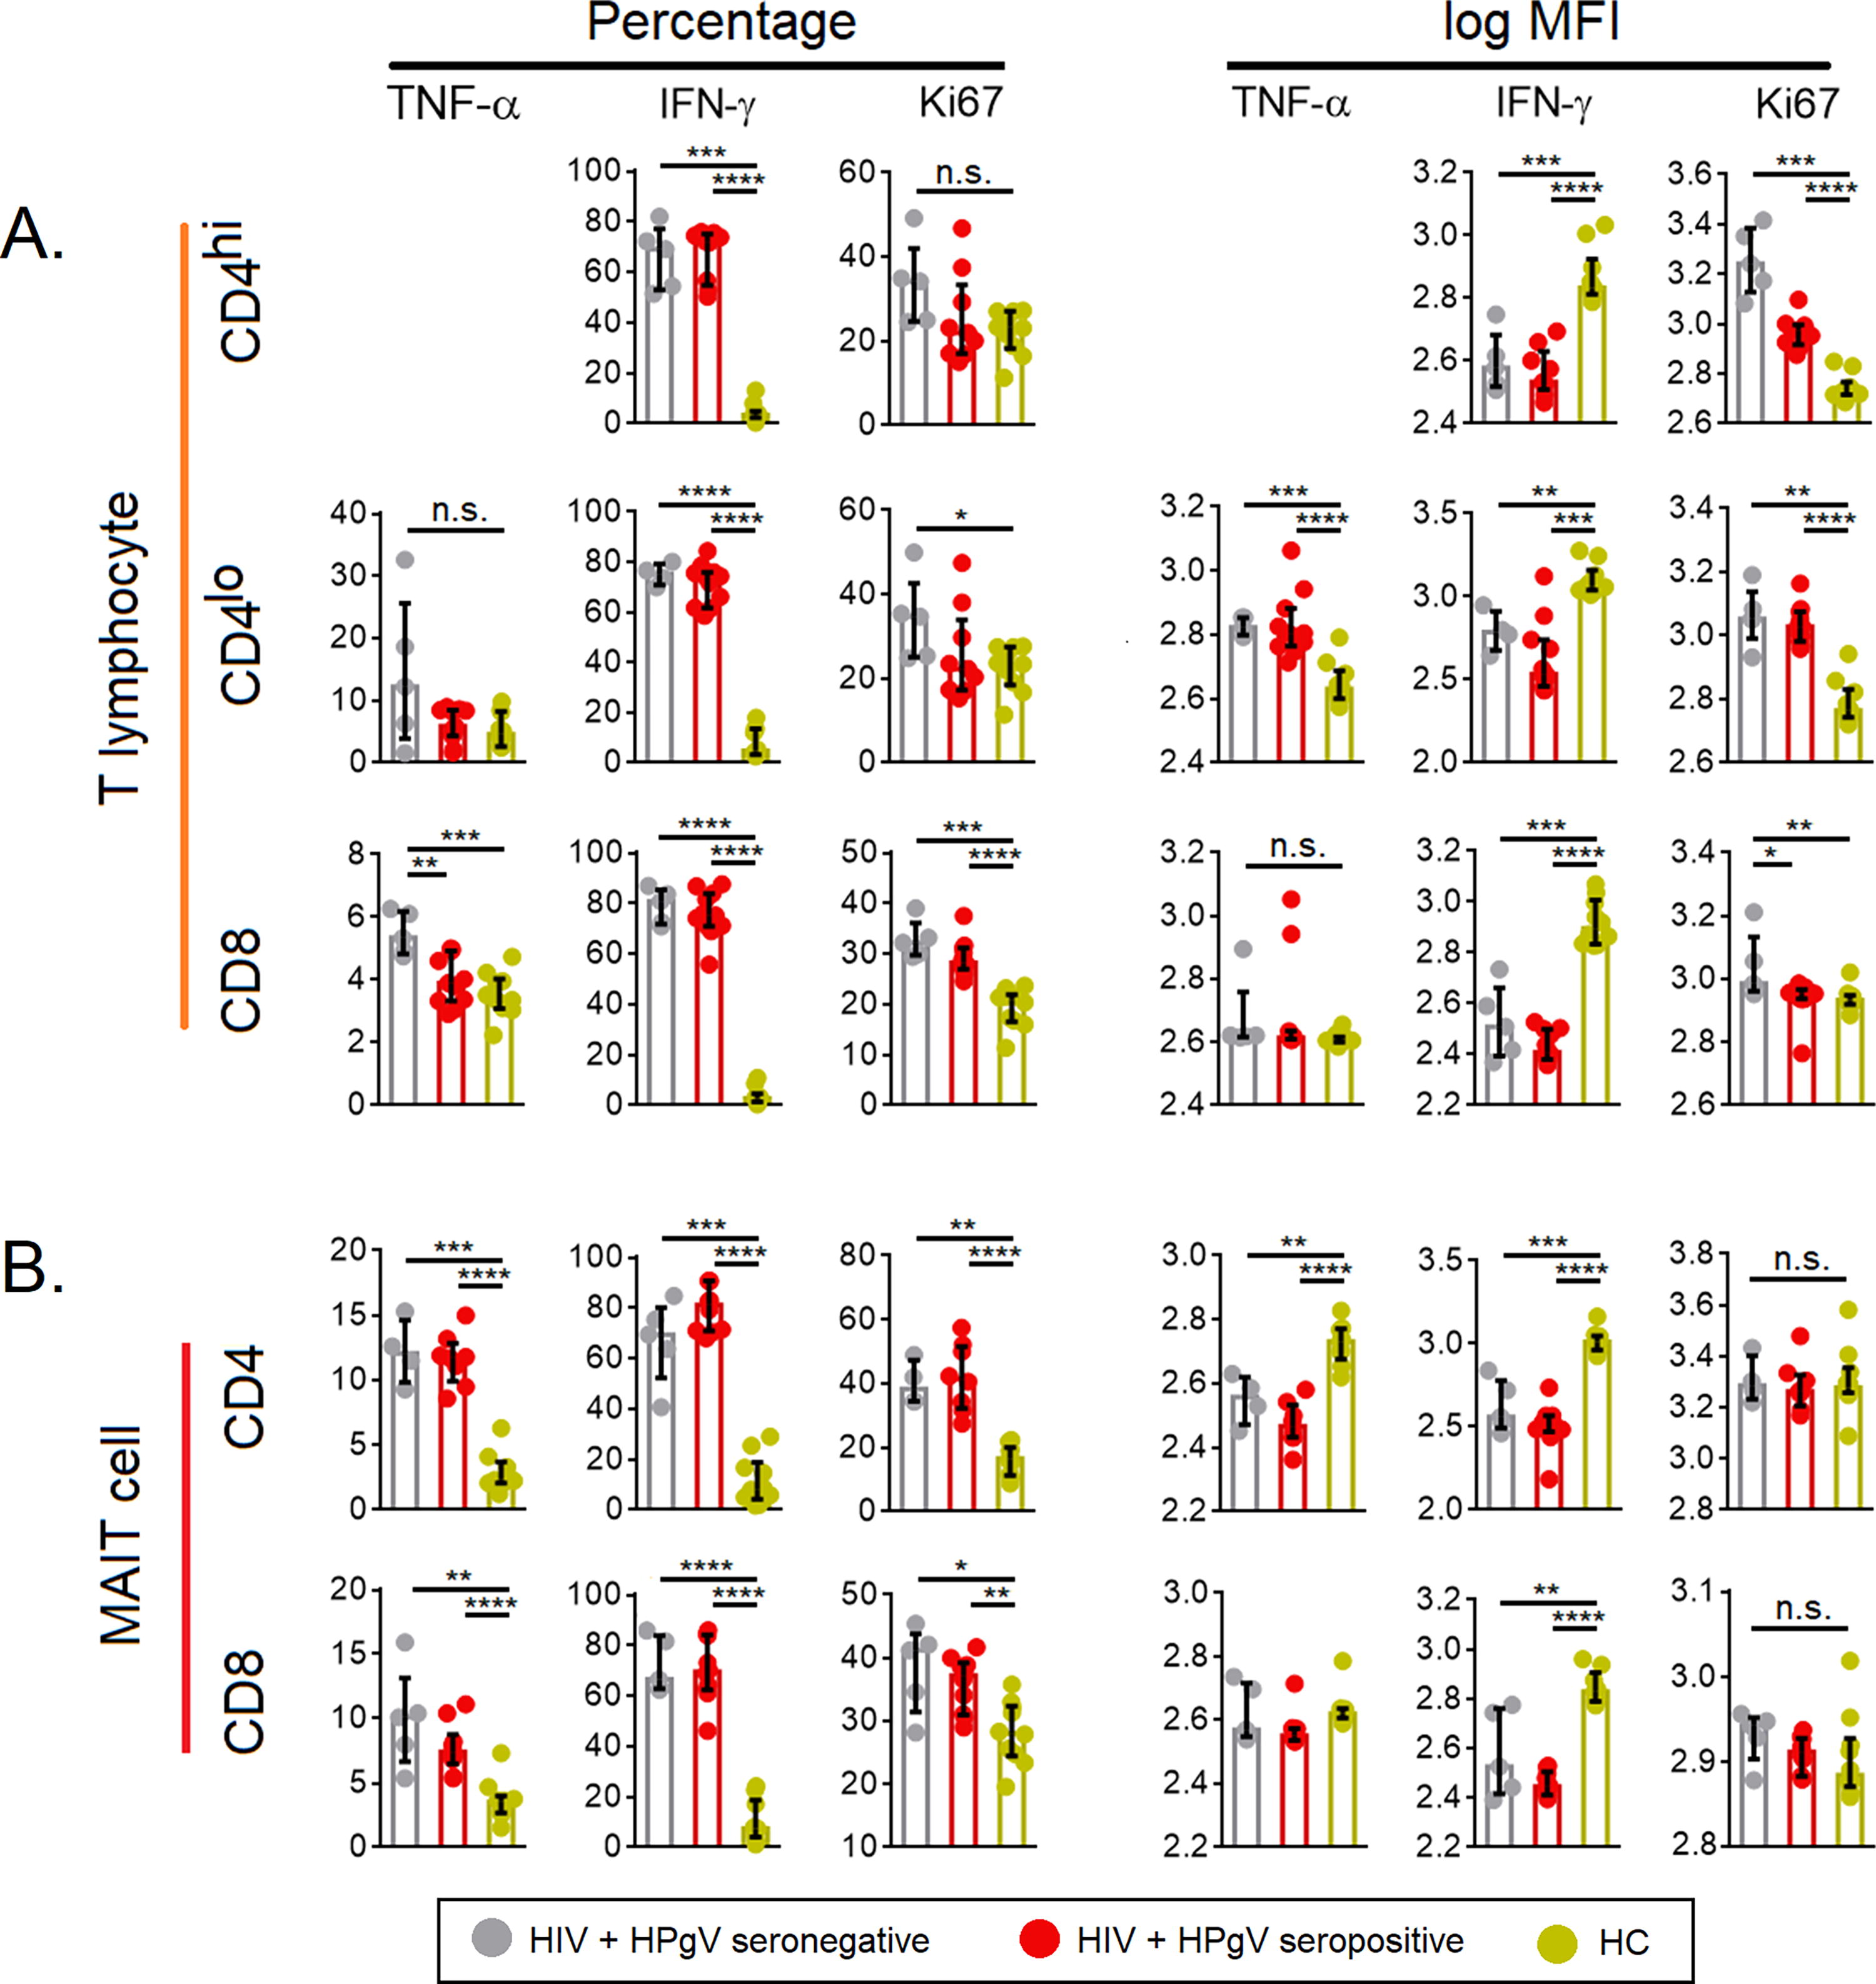
Percentage and expression levels (log MFI) of TNF-α, IFN-γ, and ki67.
HIV+HPgV− and HIV+HPgV+ individuals showed a similar expression profile with T cell activation and exhaustion markers
By standardizing each cytokine against its median level in the HC group, the fold change of TNF-α and IFN-γ was determined (Fig. 5A). We found that the two HIV-infected groups exhibited similar cytokine and activation profiles, with total CD4+ T cells, CD8+ T cells, TFH, TFC, and MAIT cells being the main cells expressing higher levels of TNF-α and IFN-γ and activation markers (Fig. 5B and 5C). After the cytokine fold change was graded in descending order, the cells that increased >2-fold for each chronic infection were identified (Fig. 5C and 5D). The analysis showed that of all the immune cells, 15 were shared between HIV+HPgV− and HIV+HPgV+ individuals (Fig. 5E).
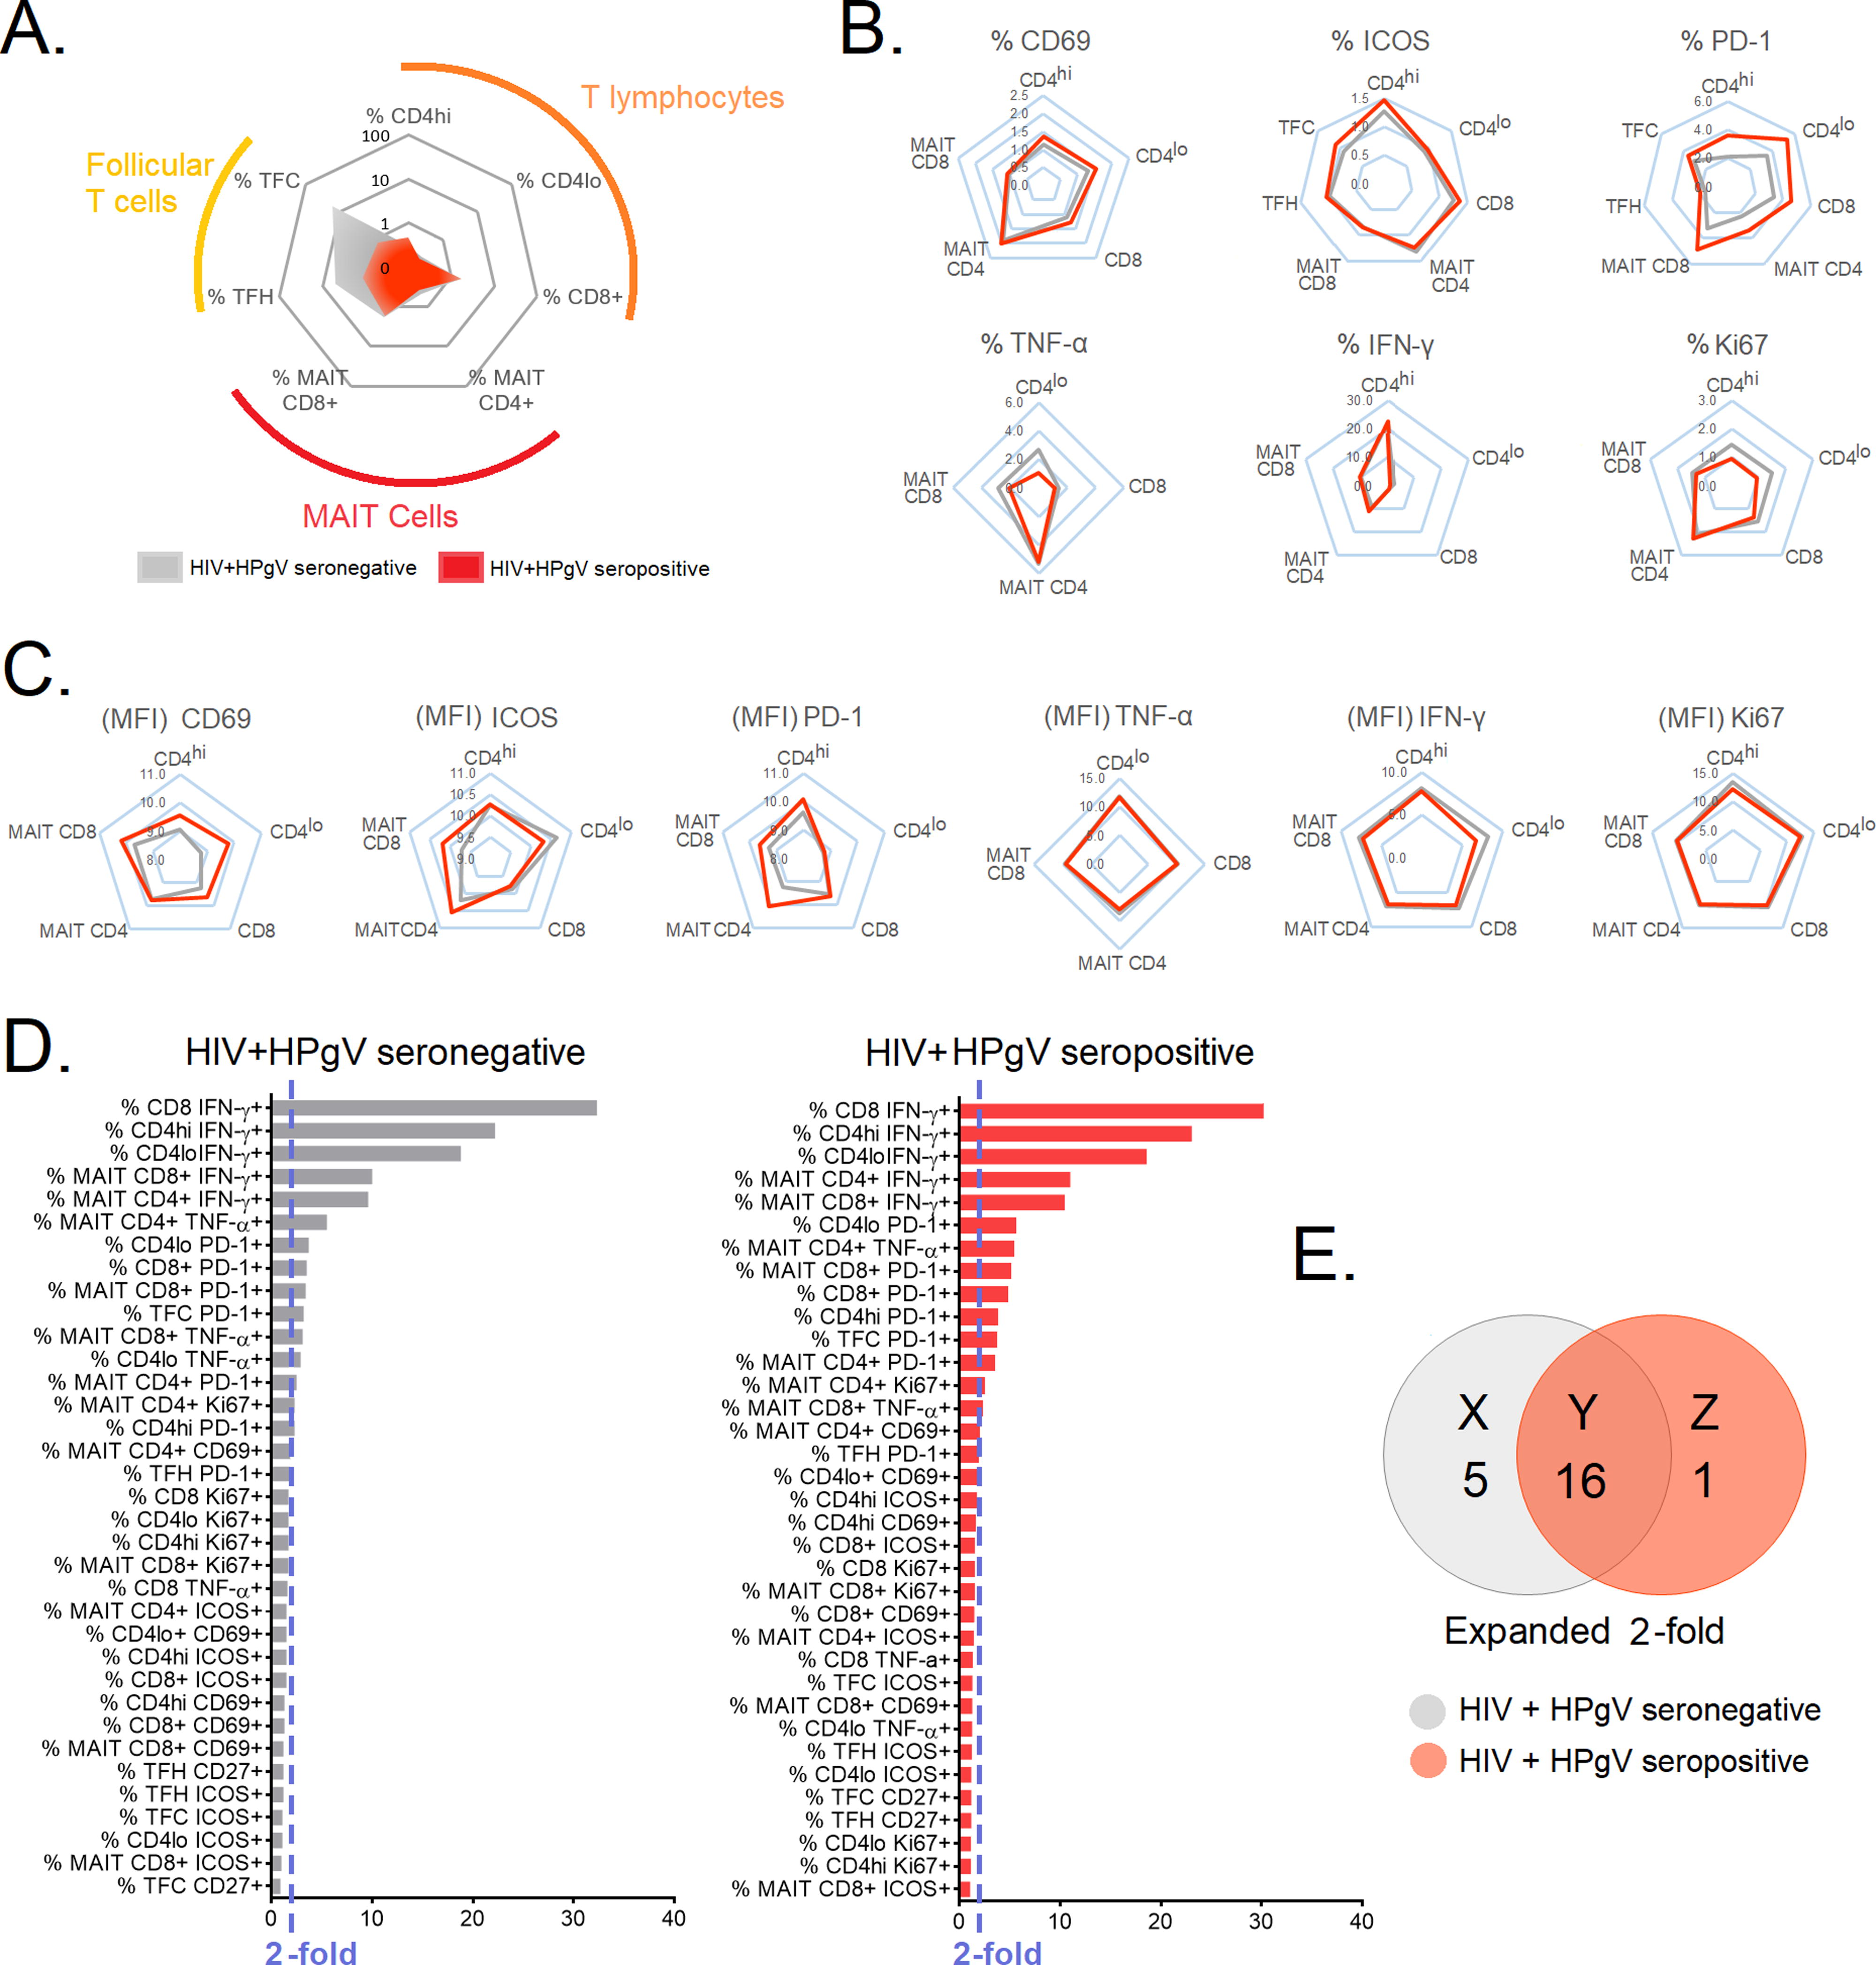
Radar plot to depict the preferential expression of T cell subsets and biomarkers in HIV+HPgV- and HIV+HPgV+ patients
Cellular markers were inversely correlated with absolute CD4+ T cell counts in HIV-infected HPgV positive and negative individuals
To examine the relationship between cellular markers and absolute CD4+ T cell counts among HIV+HPgV− and HIV+HPgV+, we performed univariate linear regression. Variables that showed significant association in the univariate regression analysis will then be included into the multivariate analysis using a stepwise forward approach (Fig. 6A). Given that absolute CD4+ T cell counts were affected by age and nadir/baseline CD4+ T cell count (Chow et al., 2015; Yong et al., 2016), these two variables were also adjusted in the multivariate model. The univariate linear regression identified a series of cellular markers that predict increased or decreased absolute CD4+ T cell counts among HIV+HPgV−, common for both HIV+HPgV− and HIV+HPgV+ and specific to HIV−HPgV+, depicted as R, S, T, U V, W in Figure 6B. Cellular markers that fell within subset S and V (common for both HIV+HPgV− and HIV+HPgV+) were selected for the multivariate analysis. The multivariate analyses were performed in a stepwise forward manner, and the cellular markers that showed significant association with absolute CD4+ T cell counts in the multivariate model were regarded as independent predictors of absolute CD4+ T cell counts. The multivariate analysis showed that the expression of IFN-γ in CD4hi was a predictor of increased absolute CD4+ T cell counts, where every increase of MFI of IFN-γ in CD4hi by one unit was associated with increased absolute CD4+ T cell counts by 1.183 (95% CI = 0.894–1.473; p < 0.0001). In contrast, % CD4lo TNF-α and MFI CD4lo TNF-α were predictors for decreased absolute CD4+ T cell counts (Fig. 6C). The cytokine levels documented across HIV+HPgV− and HIV+HPgV+ study groups are presented in Supplementary Table S2.
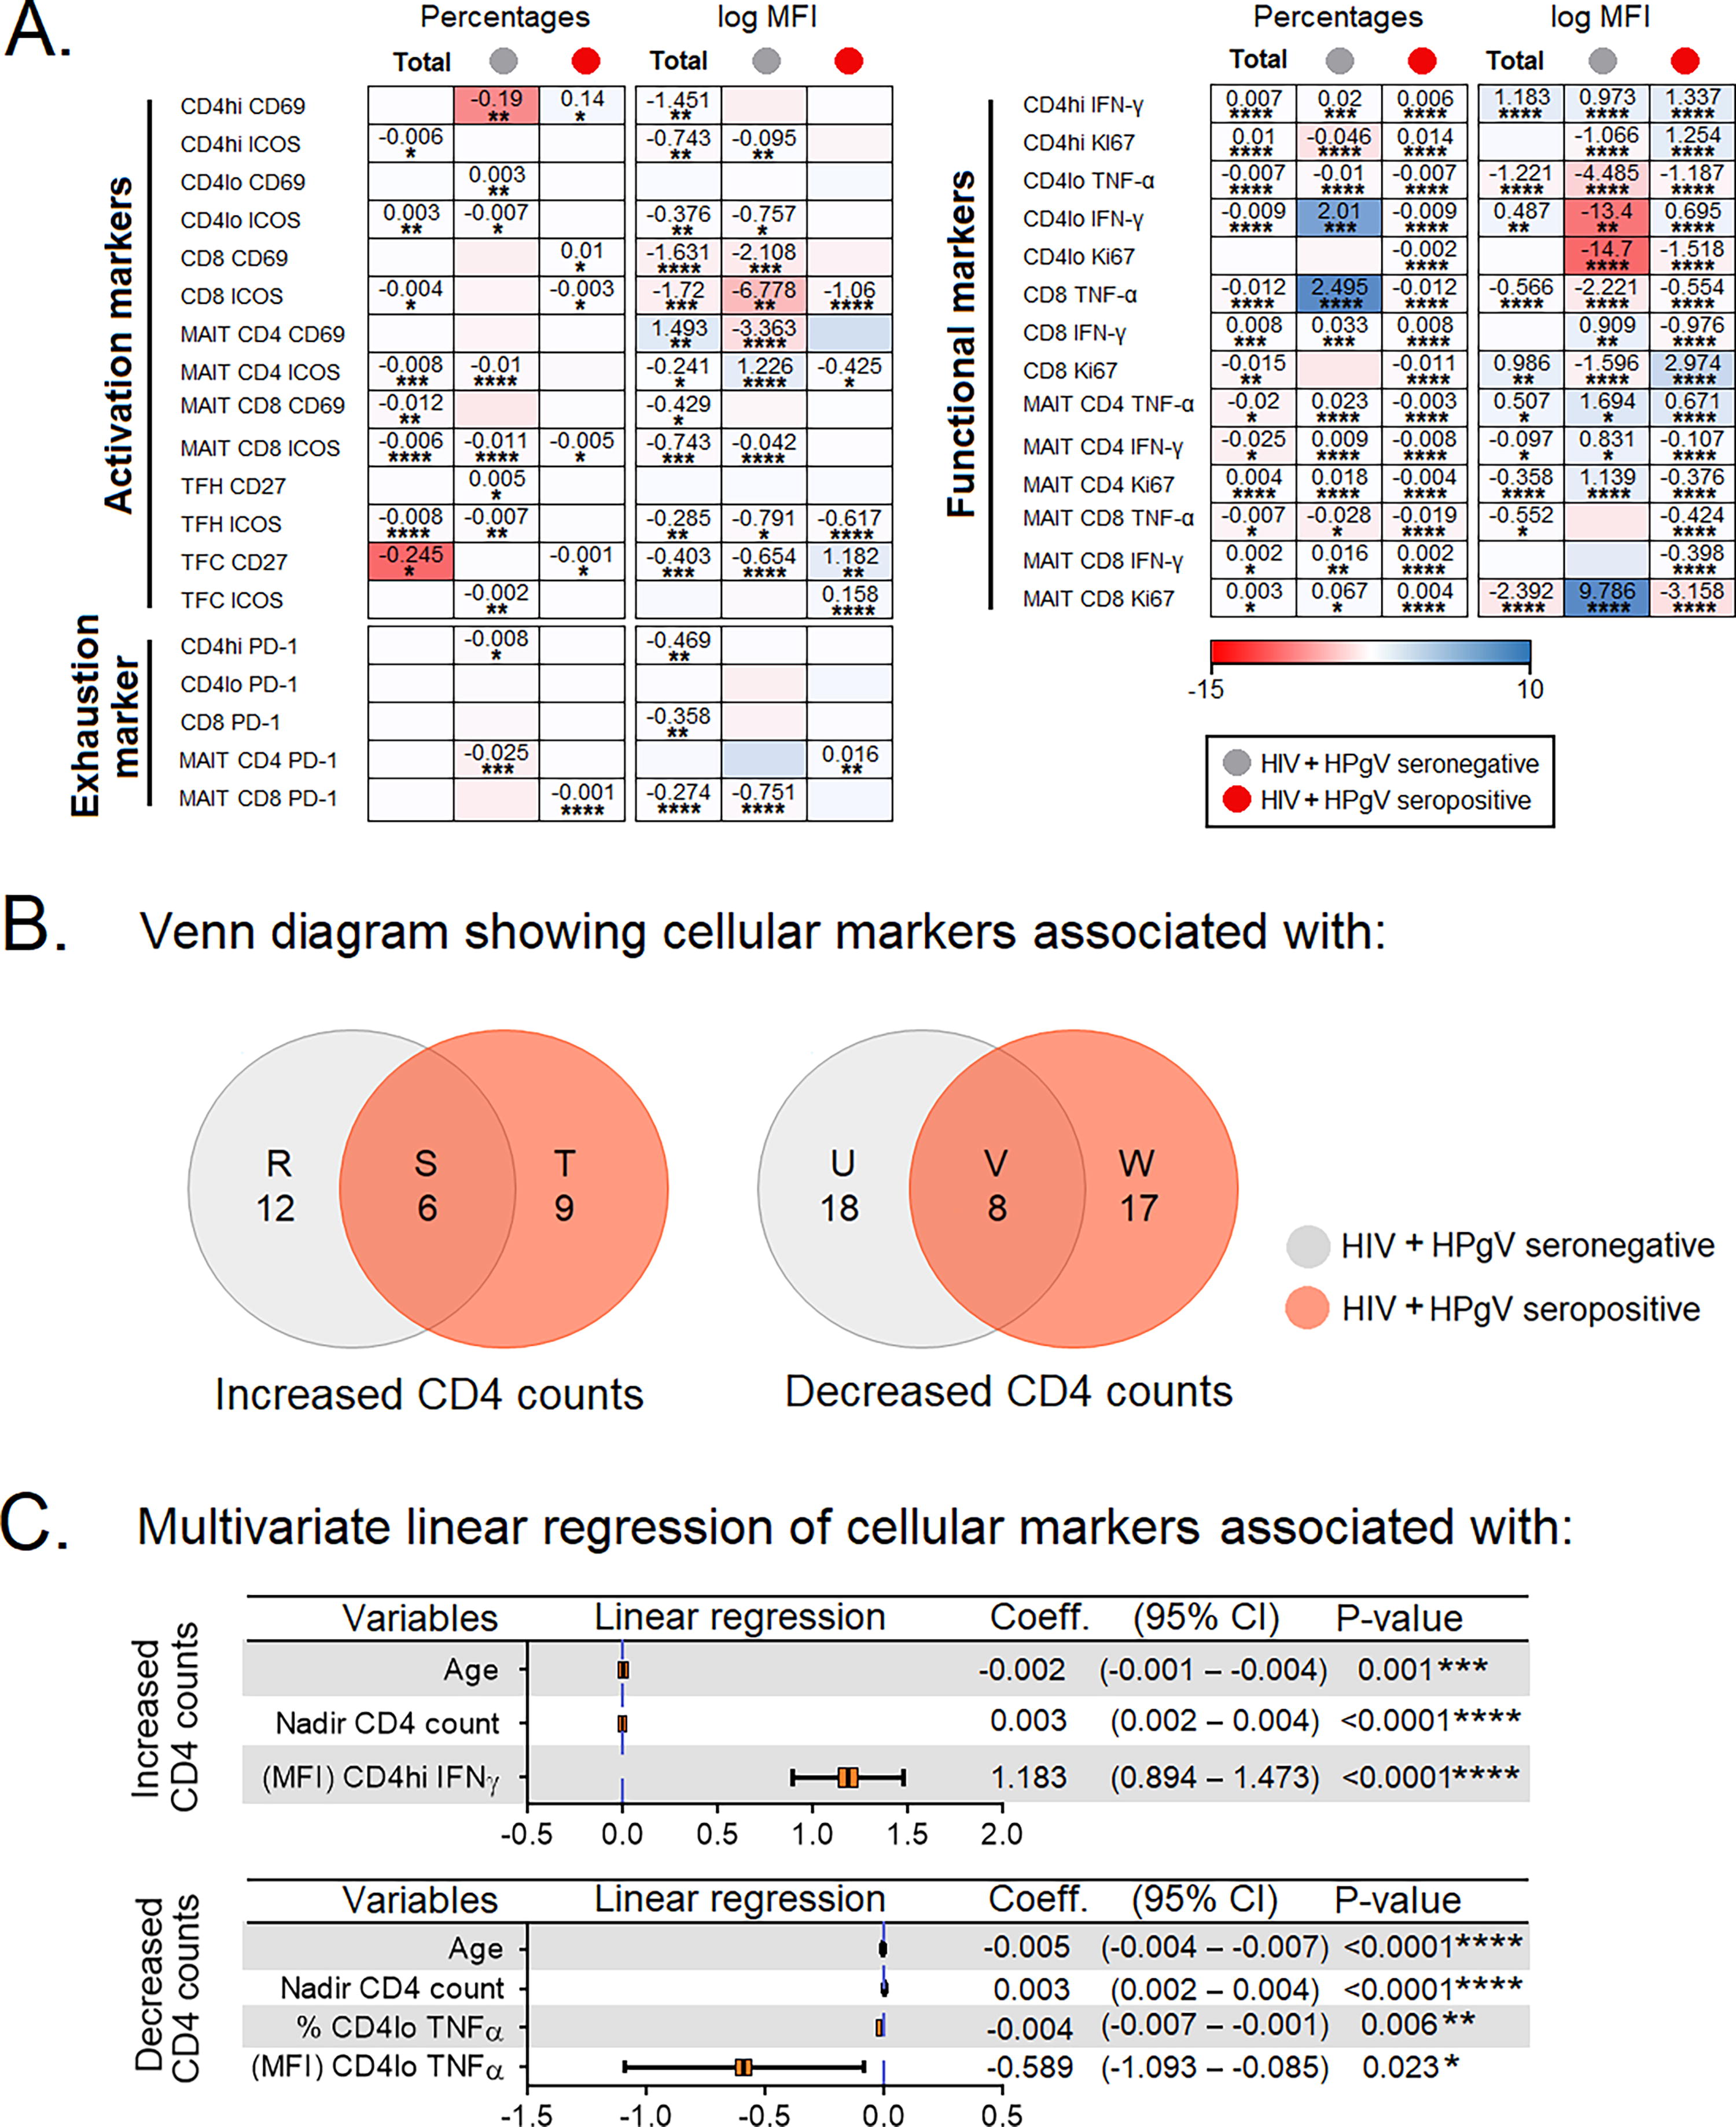
Linear regression model for cellular markers associated with absolute CD4+ T cell counts.
Discussion
In the present study, we sought to understand the impact of HPgV on HIV disease progression. We found a significant increase in the absolute CD4+ T cell counts in HPgV+ patients adjusting for age and nadir CD4+ T cell counts. We found that HIV+HPgV+ patients generally had greater degree of immune activation and immune exhaustion in major T cell subsets, including CD4+hi, CD4+lo, CD8+ T cells, CD4+ MAIT cells, as well as CD8+ MAIT cells. The levels of intracellular TNF-α, IFN-γ, and ki67 were comparable between both HPgV− and HPgV+ patients except for intracellular TNF-α in CD8+ T cells, where HPgV− patients had higher levels than for HPgV+ patients. Our analysis clearly showed that HIV+ HPgV− patients had preferentially expanded TFH cells. Regression analysis identified six and eight cellular markers that were common across both HPgV− and HPgV+ patients that were associated with increased and decreased absolute CD4+ T cell counts, respectively. In addition, expression of IFN-γ in CD4+hi T cells were independently associated with increased absolute CD4+ T cell counts.
Evidence suggests that HPgV viremia is linked to reduced mortality in HIV-infected individuals, with a slower progression to terminal disease and prolonged survival after AIDS onset (Tillmann et al., 2001). Others reported that the effects were unrelated to age, HIV PVL, HCV PVL, CD4+, and CD8+ T cell numbers (Lopalco, 2010). The clearance of HPgV has an adverse impact on HIV disease progression hinting the beneficial role of HPgV (Lisco et al., 2009; Shankar et al., 2008; Vimali et al., 2023). Nonetheless, a minimum threshold of HPgV viral load is required for exerting the positive impact (Horemheb-Rubio et al., 2017). HIV/HPgV coinfection results in lower HIV-1 PVL and higher absolute CD4+ T cell counts than HIV mono-infection (de Miranda et al., 2017). A tendency toward lower mortality and lower HIV PVL is associated with HPgV viremia (Schwarze-Zander et al., 2012). Compared with HIV mono-infected individuals, those with HIV/HPgV coinfection have longer survival rates. It is also clear that HPgV appears to alleviate liver damage as evident from our current findings. High HPgV PVL is reportedly associated with reduction in immune activation markers (Stapleton 2022). HPgV infection appears to improve responsiveness to HAART, and the duration of HAART did not affect HPgV viremia (Björkman et al., 2007; Mosam et al., 2007).
Our study showed that CD69 was significantly increased on CD8+ T cells and CD8+ MAIT cells of HPgV+ HIV-infected individuals. During an inflammatory milieu, MAIT cells express high CD69 levels (Matsuyama et al., 2019; Murugesan et al., 2020). CD69 expression on CD8+ T cells may serve as a marker to assess therapy efficacy and monitor disease progression (De Martino et al., 1999). We observed that the levels of CD69-expressing CD8+ T cells and CD8+ MAIT cells were associated with a decrease in PVL indicating the likely role of CD69 in viral control. Hence, HIV-infected individuals have a reduced proportion of CD69-expressing T cells. However, in general, CD69 was significantly enhanced in HIV+HPgV+ individuals in the current study, which is intriguing given that activated T cells largely assist HIV proliferation. IFN-γ suggests its role in increasing the absolute CD4+ T cell counts, whereas TNF-α has its significance in decreasing the same among both HIV+HPgV+ and HIV+HPgV− individuals. We identified a significant elevation in intracellular TNF-α among HIV-infected individuals that were HPgV−.
HPgV coinfection minimizes HIV-mediated activation of T cells and B cells and aids in delaying the onset of AIDS (Spellberg and Edwards, 2001). In both HIV RNA positive and suppressed individuals, HPgV resulted in reduced CD4+ and CD8+ T cell activation (Stapleton et al., 2012). TNF-α has been linked to enhanced HIV replication (Nakajima et al., 2004). The current study supports the above finding in that intracellular TNF-α was significantly higher among HIV-infected HPgV− individuals than among HIV+HPgV+ subjects demonstrating the reactivation of the virus in HIV+HPgV− individuals. Lowered T cell activation is linked to HPgV and could protect against HIV pathogenesis (Shankar et al., 2011). ki67 acts as a marker for determining antigen-specific T cells (Soares et al., 2010). Increased expression of ki67 among HIV+HPgV+ patients indicates that HPgV seropositivity preserves active cellular proliferation.
In chronic HIV infection, there is a marked increase in TFH, which has been linked to increased HIV replication (Velu et al., 2018). PD-1 is highly expressed on TFH cells, where it appears to inhibit TCR signaling (Shi et al., 2018). Our study revealed enhanced expression of PD-1 on TFH, TFC, and CD8+ T cells in HIV+HPgV+ individuals, which has been correlated with decreased HIV PVL likely to prevent T cells from destroying other cells. In some instances, enhanced PD-1 in HIV+HPgV+ individuals determines the management of immune response to prevent immune exhaustion.
Having discussed in detail the salubrious role of HPgV in HIV infection, evidence suggests that the potential role of HPgV could differ based on which virus infects an individual first (Xiang et al., 2001). An in vitro study demonstrated that when HIV infects lymphocytes first followed by HPgV infection, HIV succeeds in actively proliferating in the cells. In contrast, if the same are exposed with HPgV followed by HIV exposure, HPgV likely inhibited HIV proliferation marked by reduced HIV p24 antigen levels (Xiang et al., 2001). In the current study, we merely investigated if HPgV serostatus had any effect on T cell quality and not the sequence of infection by HIV or HPgV and the subsequent disease outcome. Furthermore, our results were based only on HPgV serostatus and not on HPgV ‘infection’ status. Therefore, the status of active infection in the current study remains speculative. In addition, the HPgV viral load and E2 antigenemia status were not determined. Moreover, the time of HPgV being coinfected with HIV or superinfected by HIV has not been studied herein.
In conclusion, our data suggest that HIV+HPgV+ individuals had relatively lower plasma levels of hepatobiliary transaminases SGOT and GGT. HIV/HPgV coinfection was significantly associated with increased absolute CD4+ T cell counts. Decrease in absolute CD4+ T cell counts had a positive correlation with intracellular IFN-γ production by CD4lo T cells, whereas increased absolute CD4+ T cell counts were inversely correlated with TNF-α production by CD4lo T cells among HIV+HPgV+ individuals. Together, our findings indicate that HIV/HPgV coinfected individuals display functional CD4+ and CD8+ MAIT, TFH, and TFC cells irrespective of PD-1 expression. Hence, future research should be aimed at understanding the widely acclaimed beneficial impact of HPgV in HIV disease through addressing the gaps in knowledge pertinent to immune mechanisms associated thereof.
Limitations of the Study
The study did not measure HPgV viral load in the HPgV positive subjects but rather surveyed the levels of IgG and IgM antibodies, and hence, the HPgV group was categorized not based on HPgV viral load but based on the presence of antibodies to HPgV. For any study to arrive at concrete conclusions, it should have been designed as a longitudinal rather than a cross-sectional investigation. In being cross-sectional, our current study was unable to address key gaps in knowledge to clearly prove the widely claimed concept that HPgV is a ‘good-boy virus’ that would preserve the quality of immune cells during HIV disease progression. Immune exhaustion is a broad and versatile area, which includes various cellular and humoral players, and our study did not experiment the diverse functional aspects of the immune cells involved in proving their potential role in HIV-HPgV infection.
Footnotes
Acknowledgments
The authors are grateful to all the participants, paraclinical, and laboratory staff of the Government Theni Medical College and Hospitals, Theni, India, for assistance with patient recruitment, specimen collection, and cooperation. Prahalathan Chidambaram, Meganathan Kannan, Shanmugam Saravanan, Ashwin Rajeev, and Abdul R Anshad are acknowledged for extending logical and technical supports.
Data Availability Statement
All supporting data are included within the main article and/or its supplementary files.
Authors’ Contributions
Conceptualization, E.M.S.; Methodology & Investigation, J.V., and A.M.; Methodology & Software, Y.K.Y., E.M.S., M.L., and Y.K.Y., E.M.S., and M.L.; Formal Analysis, E.M.S., Y.K.Y., and V.V.; Resources, S.R., P.B., M.L., and V.V.; Writing—Original Draft, J.V., E.M.S, and V.V.; Writing—Review & Editing, M.L., Y.K.Y., S.G., and V.V.; Project Administration, E.M.S.; and Supervision, E.M.S.
Funding Information
E.M.S. is funded by the Department of Science and Technology-Science and Engineering Research Board, Government of India (CRG/2019/006096). This work is also supported by grants through AI52731, the Swedish Research Council, the Swedish, Physicians against AIDS Research Foundation, the Swedish International Development Cooperation Agency, SIDA SARC, VINNMER for Vinnova, Linköping University Hospital Research Fund, CALF, and the Swedish Society of Medicine (to M.L.). V.V. is supported by: The NIH Office of Research Infrastructure Programs (P51 OD011132 to ENPRC) and Emory CFAR (P30 AI050409).
Author Disclosure Statement
The authors declare no competing interests.